Estimated zip code population in 2022: 3,525 Zip code population in 2010: 3,825 Zip code population in 2000: 3,859
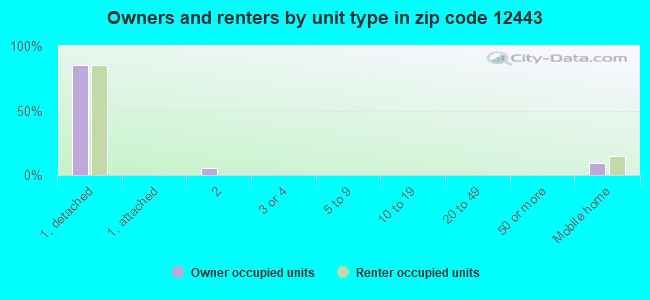
Houses and condos: 1,819 Renter-occupied apartments: 137
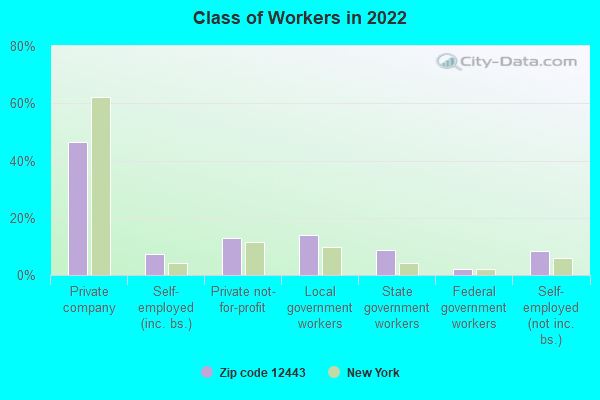
% of renters here:
9%
State:
46%
March 2022 cost of living index in zip code 12443: 108.4 (more than average, U.S. average is 100)
Land area: 18.0 sq. mi. Water area: 0.1 sq. mi.
Population density: 196 people per square mile
(very low).
OSM Map
General Map
Google Map
MSN Map
OSM Map
General Map
Google Map
MSN Map
OSM Map
General Map
Google Map
MSN Map
OSM Map
General Map
Google Map
MSN Map
Please wait while loading the map...
Real estate property taxes paid for housing units in 2022:
This zip code:
1.8% ($5,105)
New York:
1.5% ($6,180)
Median real estate property taxes paid for housing units with mortgages in 2022: $5,037 (1.5%) Median real estate property taxes paid for housing units with no mortgage in 2022: $5,305 (2.2%)
Business Search- 14 Million verified businesses
Males: 1,561
(44.3%)
Females: 1,963
(55.7%)
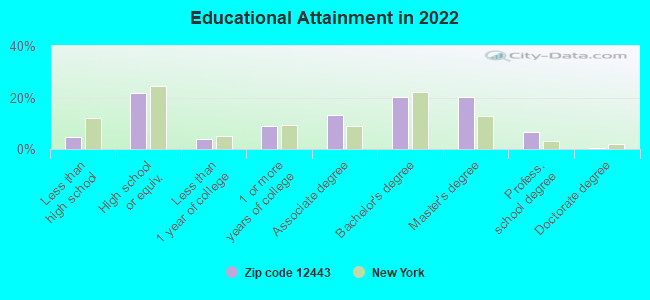
For population 25 years and over in 12443:
High school or higher: 95.8%
Bachelor's degree or higher: 47.9%
Graduate or professional degree: 27.7%
Unemployed: 1.1%
Mean travel time to work (commute): 21.8 minutes
For population 15 years and over in 12443:
Never married: 22.6%
Now married: 57.8%
Separated: 2.1%
Widowed: 6.9%
Divorced: 10.7%
Zip code 12443 compared to state average:
Unemployed percentage significantly below state average.
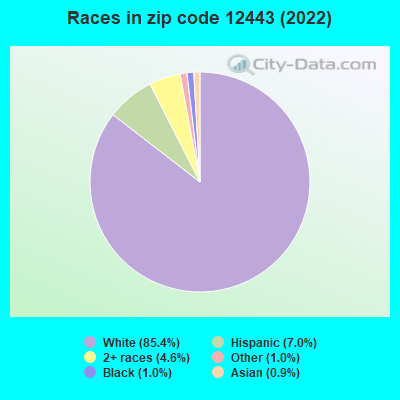
Black race population percentage significantly below state average.
Hispanic race population percentage below state average.
Median age significantly above state average.
Foreign-born population percentage significantly below state average.
Renting percentage significantly below state average.
Length of stay since moving in significantly above state average.
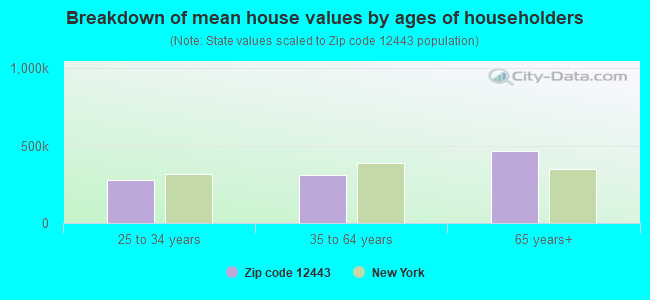
Estimated median house/condo value in 2022: $286,045
12443:
$286,045
New York:
$400,400
According to our research of New York and other state lists, there was 1 registered sex offender living in 12443 zip code as of May 28, 2024. The ratio of all residents to sex offenders in zip code 12443 is 3,726 to 1. The ratio of registered sex offenders to all residents in this zip code is much lower than the state average.
Median resident age:
This zip code:
50.7 years
New York median age:
40.0 years
Average household size:
This zip code:
2.2 people
New York:
2.5 people
Averages for the 2020 tax year for zip code 12443, filed in 2021:
Average Adjusted Gross Income (AGI) in 2020: $95,435 (Individual Income Tax Returns)
Here:
$95,435
State:
$90,930
Salary/wage: $74,723 (reported on 76.4% of returns)
Here:
$74,723
State:
$72,104
(% of AGI for various income ranges: 1081.1% for AGIs below $25k, 3341.2% for AGIs $25k-50k, 6112.1% for AGIs $50k-75k, 9965.7% for AGIs $75k-100k, 17093.2% for AGIs $100k-200k, 91147.5% for AGIs over 200k)
Taxable interest for individuals: $1,305 (reported on 51.9% of returns)
This zip code:
$1,305
New York:
$3,075
(% of AGI for various income ranges: 26.8% for AGIs below $25k, 30.6% for AGIs $25k-50k, 144.7% for AGIs $50k-75k, 121.4% for AGIs $75k-100k, 178.0% for AGIs $100k-200k, 857.5% for AGIs over 200k)
Ordinary dividends: $7,141 (reported on 34.1% of returns)
Here:
$7,141
State:
$11,095
(% of AGI for various income ranges: 60.4% for AGIs below $25k, 83.9% for AGIs $25k-50k, 365.8% for AGIs $50k-75k, 296.4% for AGIs $75k-100k, 643.6% for AGIs $100k-200k, 4762.5% for AGIs over 200k)
Net capital gain/loss in AGI: +$23,003 (reported on 27.9% of returns)
Here:
+$23,003
State:
+$44,925
(% of AGI for various income ranges: 30.7% for AGIs below $25k, 34.8% for AGIs $25k-50k, 141.6% for AGIs $50k-75k, 246.4% for AGIs $75k-100k, 902.8% for AGIs $100k-200k, 25675.0% for AGIs over 200k)
Profit/loss from business: +$17,716 (reported on 17.8% of returns)
Here:
+$17,716
State:
+$14,940
(% of AGI for various income ranges: 103.6% for AGIs below $25k, 153.9% for AGIs $25k-50k, 221.6% for AGIs $50k-75k, 456.4% for AGIs $75k-100k, 709.2% for AGIs $100k-200k, 7310.0% for AGIs over 200k)
Taxable individual retirement arrangement distribution: $18,966 (reported on 13.9% of returns)
12443:
$18,966
New York:
$19,609
(% of AGI for various income ranges: 77.9% for AGIs below $25k, 103.0% for AGIs $25k-50k, 311.1% for AGIs $50k-75k, 358.6% for AGIs $75k-100k, 854.8% for AGIs $100k-200k, 4280.0% for AGIs over 200k)
Total itemized deductions: $27,063 (reported on 9.1% of returns)
Here:
$27,063
State:
$39,326
(% of AGI for various income ranges: 226.4% for AGIs below $25k, 427.9% for AGIs $50k-75k, 412.1% for AGIs $75k-100k, 672.8% for AGIs $100k-200k, 3590.0% for AGIs over 200k)
Charity contributions: $6,533 (reported on 7.2% of returns)
Here:
$6,533
State:
$15,420
(% of AGI for various income ranges: 84.7% for AGIs $50k-75k, 128.8% for AGIs $100k-200k, 1242.5% for AGIs over 200k)
Taxes paid: $8,779 (reported on 9.1% of returns)
12443:
$8,779
State:
$9,183
(% of AGI for various income ranges: 48.6% for AGIs below $25k, 154.7% for AGIs $50k-75k, 144.3% for AGIs $75k-100k, 267.2% for AGIs $100k-200k, 920.0% for AGIs over 200k)
Earned income credit: $1,728 (reported on 8.7% of returns)
Here:
$1,728
State:
$2,138
(% of AGI for various income ranges: 48.6% for AGIs below $25k, 53.0% for AGIs $25k-50k)
Percentage of individuals using paid preparers for their 2020 taxes: 94.7%
Here:
95%
State:
95%
(% for various income ranges: 93.6% for AGIs below $25k, 95.5% for AGIs $25k-50k, 93.3% for AGIs $50k-75k, 95.7% for AGIs $75k-100k, 95.7% for AGIs $100k-200k, 94.1% for AGIs over 200k)
Averages for the 2012 tax year for zip code 12443, filed in 2013:
Average Adjusted Gross Income (AGI) in 2012: $69,721 (Individual Income Tax Returns)
Here:
$69,721
State:
$77,088
Salary/wage: $58,554 (reported on 79.5% of returns)
Here:
$58,554
State:
$60,593
(% of AGI for various income ranges: 63.3% for AGIs below $25k, 68.7% for AGIs $25k-50k, 63.9% for AGIs $50k-75k, 66.9% for AGIs $75k-100k, 73.6% for AGIs $100k-200k, 56.5% for AGIs over 200k)
Taxable interest for individuals: $1,121 (reported on 59.0% of returns)
This zip code:
$1,121
New York:
$3,125
(% of AGI for various income ranges: 1.7% for AGIs below $25k, 0.9% for AGIs $25k-50k, 1.5% for AGIs $50k-75k, 0.9% for AGIs $75k-100k, 0.8% for AGIs $100k-200k, 0.7% for AGIs over 200k)
Ordinary dividends: $5,419 (reported on 37.6% of returns)
Here:
$5,419
State:
$10,299
(% of AGI for various income ranges: 4.7% for AGIs below $25k, 2.2% for AGIs $25k-50k, 2.7% for AGIs $50k-75k, 2.5% for AGIs $75k-100k, 2.5% for AGIs $100k-200k, 3.9% for AGIs over 200k)
Net capital gain/loss in AGI: +$4,070 (reported on 26.3% of returns)
Here:
+$4,070
State:
+$42,474
(% of AGI for various income ranges: 0.5% for AGIs $25k-50k, 1.0% for AGIs $50k-75k, 1.4% for AGIs $75k-100k, 2.0% for AGIs $100k-200k, 2.2% for AGIs over 200k)
Profit/loss from business: +$10,272 (reported on 17.6% of returns)
Here:
+$10,272
State:
+$16,168
(% of AGI for various income ranges: 10.1% for AGIs below $25k, 2.2% for AGIs $25k-50k, 3.1% for AGIs $50k-75k, 2.7% for AGIs $75k-100k, 1.1% for AGIs $100k-200k, 3.2% for AGIs over 200k)
Taxable individual retirement arrangement distribution: $12,471 (reported on 15.1% of returns)
12443:
$12,471
New York:
$17,621
(% of AGI for various income ranges: 3.7% for AGIs below $25k, 3.2% for AGIs $25k-50k, 3.4% for AGIs $50k-75k, 2.4% for AGIs $75k-100k, 3.8% for AGIs $100k-200k)
Total itemized deductions: $24,042 (21% of AGI, reported on 44.4% of returns)
Here:
$24,042
State:
$34,985
Here:
20.9% of AGI
State:
21.3% of AGI
(% of AGI for various income ranges: 15.0% for AGIs below $25k, 11.8% for AGIs $25k-50k, 16.0% for AGIs $50k-75k, 16.2% for AGIs $75k-100k, 16.3% for AGIs $100k-200k, 14.5% for AGIs over 200k)
Charity contributions: $2,549 (reported on 38.5% of returns)
Here:
$2,549
State:
$5,572
(% of AGI for various income ranges: 0.5% for AGIs below $25k, 0.9% for AGIs $25k-50k, 1.3% for AGIs $50k-75k, 1.3% for AGIs $75k-100k, 1.7% for AGIs $100k-200k, 1.5% for AGIs over 200k)
Taxes paid: $12,281 (reported on 44.4% of returns)
12443:
$12,281
State:
$18,656
(% of AGI for various income ranges: 4.5% for AGIs below $25k, 4.3% for AGIs $25k-50k, 6.8% for AGIs $50k-75k, 7.7% for AGIs $75k-100k, 8.6% for AGIs $100k-200k, 9.8% for AGIs over 200k)
Earned income credit: $1,589 (reported on 9.3% of returns)
Here:
$1,589
State:
$2,230
(% of AGI for various income ranges: 2.9% for AGIs below $25k, 0.6% for AGIs $25k-50k)
Percentage of individuals using paid preparers for their 2012 taxes: 62.0%
Here:
62%
State:
66%
(% for various income ranges: 52.4% for AGIs below $25k, 55.8% for AGIs $25k-50k, 66.7% for AGIs $50k-75k, 65.2% for AGIs $75k-100k, 74.4% for AGIs $100k-200k, 85.7% for AGIs over 200k)
Averages for the 2004 tax year for zip code 12443, filed in 2005:
Average Adjusted Gross Income (AGI) in 2004: $55,214 (Individual Income Tax Returns)
Here:
$55,214
State:
$59,519
Salary/wage: $49,013 (reported on 78.5% of returns)
Here:
$49,013
State:
$50,673
(% of AGI for various income ranges: 174.6% for AGIs below $10k, 60.9% for AGIs $10k-25k, 66.7% for AGIs $25k-50k, 70.3% for AGIs $50k-75k, 75.6% for AGIs $75k-100k, 67.1% for AGIs over 100k)
Taxable interest for individuals: $1,519 (reported on 68.9% of returns)
This zip code:
$1,519
New York:
$2,377
(% of AGI for various income ranges: 9.7% for AGIs below $10k, 3.3% for AGIs $10k-25k, 2.3% for AGIs $25k-50k, 1.8% for AGIs $50k-75k, 1.6% for AGIs $75k-100k, 1.6% for AGIs over 100k)
Taxable dividends: $3,061 (reported on 45.0% of returns)
Here:
$3,061
State:
$5,394
(% of AGI for various income ranges: 10.7% for AGIs below $10k, 3.9% for AGIs $10k-25k, 2.2% for AGIs $25k-50k, 2.2% for AGIs $50k-75k, 1.9% for AGIs $75k-100k, 2.6% for AGIs over 100k)
Net capital gain/loss: +$7,313 (reported on 34.2% of returns)
Here:
+$7,313
State:
+$23,581
(% of AGI for various income ranges: -9.4% for AGIs below $10k, 0.7% for AGIs $10k-25k, 1.1% for AGIs $25k-50k, 0.6% for AGIs $50k-75k, 1.6% for AGIs $75k-100k, 8.9% for AGIs over 100k)
Profit/loss from business: +$15,773 (reported on 17.5% of returns)
Here:
+$15,773
State:
+$13,809
(% of AGI for various income ranges: 5.4% for AGIs below $10k, 7.1% for AGIs $10k-25k, 4.8% for AGIs $25k-50k, 3.6% for AGIs $50k-75k, 3.6% for AGIs $75k-100k, 5.8% for AGIs over 100k)
IRA payment deduction: $2,851 (reported on 4.7% of returns)
12443:
$2,851
New York:
$3,115
(% of AGI for various income ranges: 0.5% for AGIs $10k-25k, 0.5% for AGIs $25k-50k, 0.4% for AGIs $50k-75k, 0.2% for AGIs $75k-100k, 0.1% for AGIs over 100k)
Self-employed pension: $15,893 (reported on 1.4% of returns)
Here:
$15,893
New York:
$19,016
Total itemized deductions: $19,892 (21% of AGI, reported on 43.8% of returns)
Here:
$19,892
State:
$25,864
Here:
21.0% of AGI
State:
21.9% of AGI
(% of AGI for various income ranges: 15.2% for AGIs below $10k, 15.6% for AGIs $10k-25k, 15.5% for AGIs $25k-50k, 17.3% for AGIs $50k-75k, 17.2% for AGIs $75k-100k, 14.8% for AGIs over 100k)
Charity contributions deductions: $2,490 (3% of AGI, reported on 41.1% of returns)
Here:
$2,490
State:
$4,439
Here:
2.6% of AGI
State:
3.6% of AGI
(% of AGI for various income ranges: 1.5% for AGIs below $10k, 0.9% for AGIs $10k-25k, 1.6% for AGIs $25k-50k, 1.9% for AGIs $50k-75k, 2.3% for AGIs $75k-100k, 1.9% for AGIs over 100k)
Total tax: $8,710 (reported on 80.6% of returns)
12443:
$8,710
State:
$11,730
(% of AGI for various income ranges: 4.0% for AGIs below $10k, 4.8% for AGIs $10k-25k, 7.9% for AGIs $25k-50k, 9.2% for AGIs $50k-75k, 10.3% for AGIs $75k-100k, 17.7% for AGIs over 100k)
Earned income credit: $1,511 (reported on 6.6% of returns)
Here:
$1,511
State:
$1,757
Percentage of individuals using paid preparers for their 2004 taxes: 63.4%
Here:
63%
State:
67%
(% for various income ranges: 57.1% for AGIs below $10k, 56.8% for AGIs $10k-25k, 63.3% for AGIs $25k-50k, 69.4% for AGIs $50k-75k, 65.3% for AGIs $75k-100k, 72.9% for AGIs over 100k)
Likely homosexual households (counted as self-reported same-sex unmarried-partner households)
Lesbian couples: 0.0% of all households
Gay men: 1.0% of all households
Household received Food Stamps/SNAP in the past 12 months: 103 Household did not receive Food Stamps/SNAP in the past 12 months: 1,490
Women who had a birth in the past 12 months: 49 (41 now married, 8 unmarried) Women who did not have a birth in the past 12 months: 745 (373 now married, 367 unmarried)
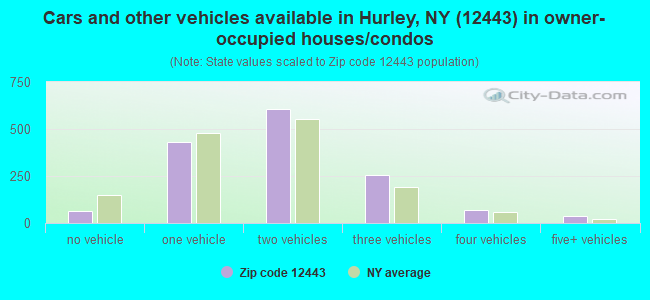
Housing units in zip code 12443 with a mortgage: 881 (63 second mortgage, 43 both second mortgage and home equity loan) Houses without a mortgage: 24
Median monthly owner costs for units with a mortgage: $1,994 Median monthly owner costs for units without a mortgage: $901
Residents with income below the poverty level in 2022:
This zip code:
4.0%
Whole state:
14.3%
Residents with income below 50% of the poverty level in 2022:
This zip code:
2.9%
Whole state:
6.8%
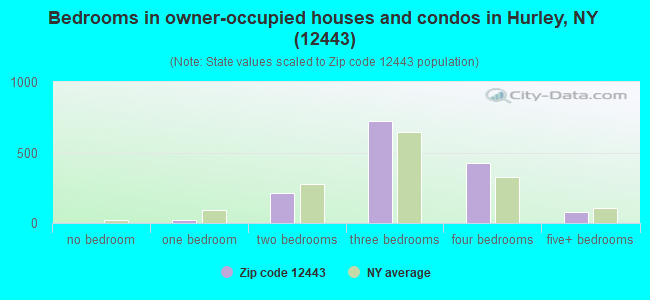
Median number of rooms in houses and condos:
Here:
6.5
State:
6.3
Median number of rooms in apartments:
Here:
6.0
State:
3.8
Notable locations in this zip code not listed on our city pages
Churches in zip code 12443 include: Saint Johns Church (A), Saint Josephs Hall (B), Good Shepherd Lutheran Church (C), New Hope Baptist Church (D), The Hurley Reformed Church (E). Display/hide their locations on the map
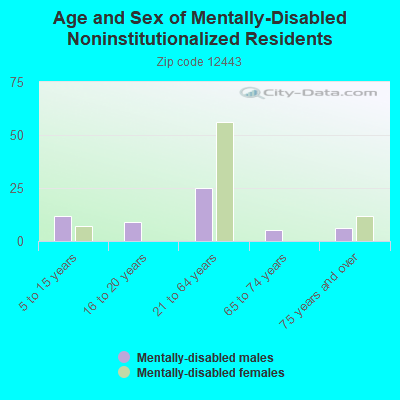
In group quarters: 35 (-1 institutionalized population)
Size of family households: 624 2-persons, 252 3-persons, 130 4-persons, 51 5-persons, 36 7-or-more-persons
Size of nonfamily households: 439 1-person, 79 2-persons
341 married couples with children.
111 single-parent households (12 men, 99 women).
90.6% of residents of 12443 zip code speak English at home.
5.4% of residents speak Spanish at home (85% very well, 15% well).
3.6% of residents speak other Indo-European language at home (86% very well, 14% well).
0.1% of residents speak Asian or Pacific Island language at home (100% very well).
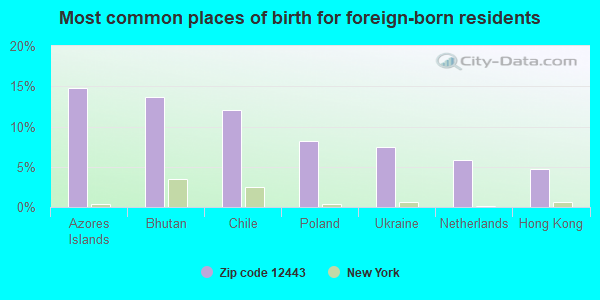
Foreign born population: 258 (7.3%) (76.2% of them are naturalized citizens)
This zip code:
7.3%
Whole state:
22.7%
15%Azores Islands
14%Bhutan
12%Chile
8%Poland
7%Ukraine
6%Netherlands
5%Hong Kong
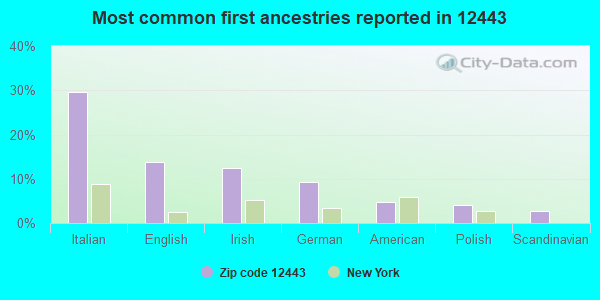
30%Italian
14%English
12%Irish
9%German
5%American
4%Polish
3%Scandinavian
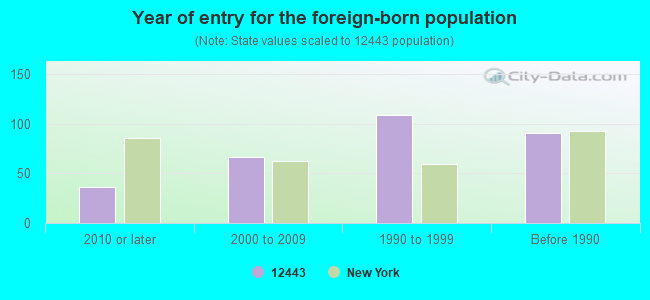
Year of entry for the foreign-born population
362010 or later
672000 to 2009
1091990 to 1999
91Before 1990
Facilities with environmental interests located in this zip code:
HURLEY VETERINARY HOSPITAL (509 HURLEY AVE in HURLEY, NY)
(Resource Conservation and Recovery Act (tracking hazardous waste))
Housing units lacking complete plumbing facilities: 0.9% Housing units lacking complete kitchen facilities: 0.9%
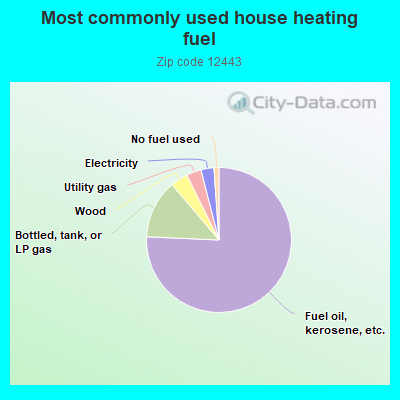
75.8%Fuel oil, kerosene, etc.
13.1%Bottled, tank, or LP gas
3.9%Wood
3.3%Utility gas
2.9%Electricity
1.1%No fuel used
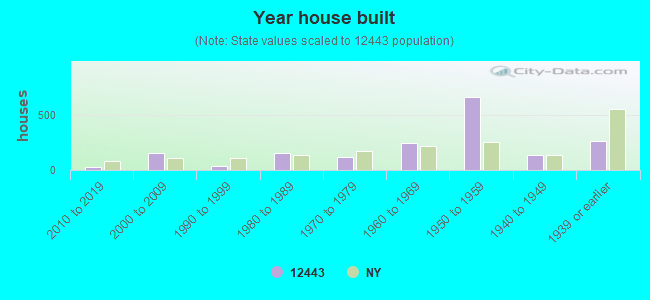
Population in 1990: 1,229. Population change in the 1990s: +2,630 (+214.0%).
Place of birth for U.S.-born residents:
This state: 2,751
Northeast: 197
Midwest: 28
South: 179
West: 41
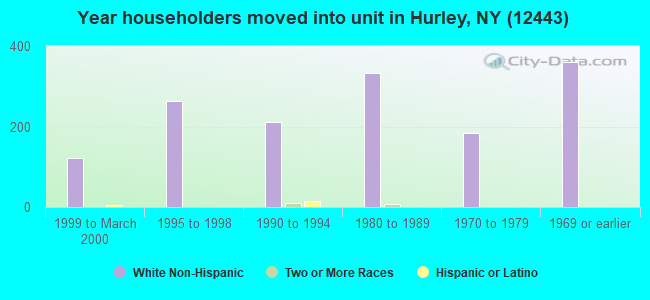
72% of the 12443 zip code residents lived in the same house 5 years ago. Out of people who lived in different houses, 78% lived in this county. Out of people who lived in different counties, 50% lived in New York.
94% of the 12443 zip code residents lived in the same house 1 year ago. Out of people who lived in different houses, 21% moved from this county. Out of people who lived in different houses, 39% moved from different county within same state. Out of people who lived in different houses, 44% moved from different state.
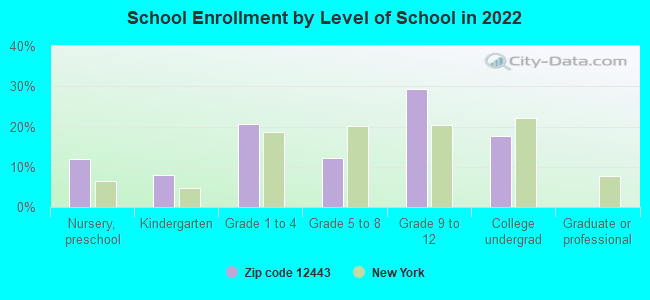
Private vs. public school enrollment:
Students in private schools in grades 1 to 8 (elementary and middle school): 31
Here:
18.5%
New York:
15.6%
Students in private schools in grades 9 to 12 (high school):
Here:
0.0%
New York:
15.0%
Students in private undergraduate colleges:
Here:
0.0%
New York:
39.2%
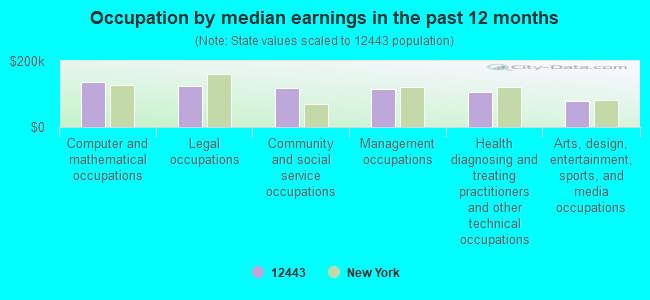
Occupation by median earnings in the past 12 months ($)
135,749Computer and mathematical occupations
125,751Legal occupations
118,717Community and social service occupations
115,909Management occupations
107,448Health diagnosing and treating practitioners and other technical occupations
79,617Arts, design, entertainment, sports, and media occupations
Companies with federal contracts located in this zip code:
LIFEGUARD SYSTEMS INC (CANARY HILL RD in HURLEY, NY; small business)
$3,529 with Army for Safety and Rescue Equipment. Signed on 2003-09-30. Completion date: 2003-09-15.
Top industries in this zip code by the number of employees in 2005:
Other Services (except Public Administration): Religious Organizations (20-49 employees: 1 establishment, 1-4 employees: 1 establishment)
Wholesale Trade: Toy and Hobby Goods and Supplies Merchant Wholesalers (20-49: 1)
Health Care and Social Assistance: Residential Mental Health and Substance Abuse Facilities (20-49: 1)
Health Care and Social Assistance: Child Day Care Services (10-19: 1, 5-9: 1)


 Nearest zip codes: 12491, 12411, 12419, 12472, 12401, 12433.