Estimated zip code population in 2022: 790 Zip code population in 2010: 677 Zip code population in 2000: 783
March 2022 cost of living index in zip code 12469: 92.5 (less than average, U.S. average is 100)
Land area: 33.9 sq. mi. Water area: 0.0 sq. mi.
Population density: 23 people per square mile
(very low).
OSM Map
General Map
Google Map
MSN Map
OSM Map
General Map
Google Map
MSN Map
OSM Map
General Map
Google Map
MSN Map
OSM Map
General Map
Google Map
MSN Map
Please wait while loading the map...
Real estate property taxes paid for housing units in 2022:
This zip code:
1.9% ($3,707)
New York:
1.5% ($6,180)
Median real estate property taxes paid for housing units with mortgages in 2022: $3,566 (1.8%) Median real estate property taxes paid for housing units with no mortgage in 2022: $4,936 (2.5%)
Business Search- 14 Million verified businesses
Males: 431
(54.6%)
Females: 359
(45.4%)
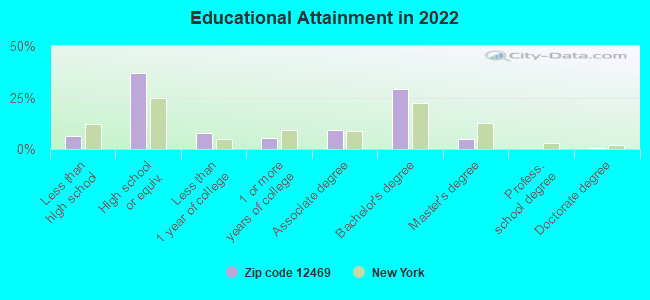
For population 25 years and over in 12469:
High school or higher: 93.7%
Bachelor's degree or higher: 34.5%
Graduate or professional degree: 5.5%
Unemployed: 2.2%
Mean travel time to work (commute): 32.2 minutes
For population 15 years and over in 12469:
Never married: 24.9%
Now married: 54.9%
Separated: 9.5%
Widowed: 2.3%
Divorced: 8.4%
Zip code 12469 compared to state average:
Median house value below state average.
Unemployed percentage below state average.
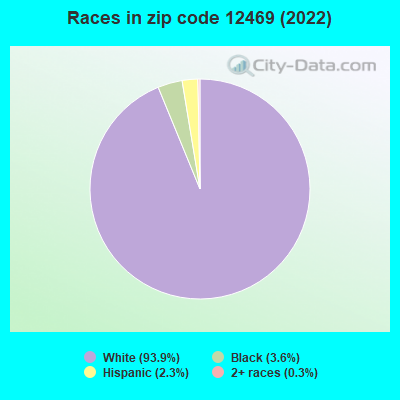
Black race population percentage significantly below state average.
Hispanic race population percentage significantly below state average.
Median age significantly above state average.
Foreign-born population percentage significantly below state average.
Renting percentage significantly below state average.
Length of stay since moving in significantly above state average.
Number of college students significantly below state average.
Estimated median house/condo value in 2022: $199,731
12469:
$199,731
New York:
$400,400
According to our research of New York and other state lists, there was 1 registered sex offender living in 12469 zip code as of May 28, 2024. The ratio of all residents to sex offenders in zip code 12469 is 787 to 1. The ratio of registered sex offenders to all residents in this zip code is near the state average.
Median resident age:
This zip code:
58.1 years
New York median age:
40.0 years
Average household size:
This zip code:
2.1 people
New York:
2.5 people
Averages for the 2020 tax year for zip code 12469, filed in 2021:
Average Adjusted Gross Income (AGI) in 2020: $65,318 (Individual Income Tax Returns)
Here:
$65,318
State:
$90,930
Salary/wage: $54,300 (reported on 67.6% of returns)
Here:
$54,300
State:
$72,104
(% of AGI for various income ranges: 940.0% for AGIs below $25k, 3236.7% for AGIs $25k-50k, 5705.0% for AGIs $50k-75k, 13185.0% for AGIs $75k-100k, 17193.3% for AGIs $100k-200k)
Taxable interest for individuals: $324 (reported on 50.0% of returns)
This zip code:
$324
New York:
$3,075
(% of AGI for various income ranges: 4.0% for AGIs below $25k, 13.3% for AGIs $25k-50k, 30.0% for AGIs $50k-75k, 25.0% for AGIs $75k-100k, 93.3% for AGIs $100k-200k)
Ordinary dividends: $4,400 (reported on 20.6% of returns)
Here:
$4,400
State:
$11,095
(% of AGI for various income ranges: 128.0% for AGIs below $25k, 145.0% for AGIs $50k-75k, 620.0% for AGIs $100k-200k)
Net capital gain/loss in AGI: +$3,800 (reported on 17.6% of returns)
Here:
+$3,800
State:
+$44,925
(% of AGI for various income ranges: 108.3% for AGIs $25k-50k, 815.0% for AGIs $75k-100k)
Profit/loss from business: +$5,850 (reported on 11.8% of returns)
Here:
+$5,850
State:
+$14,940
(% of AGI for various income ranges: 585.0% for AGIs $50k-75k)
Taxable individual retirement arrangement distribution: $20,040 (reported on 14.7% of returns)
12469:
$20,040
New York:
$19,609
(% of AGI for various income ranges: 483.3% for AGIs $25k-50k, 3560.0% for AGIs $75k-100k)
Total itemized deductions: $26,500 (reported on 8.8% of returns)
Here:
$26,500
State:
$39,326
(% of AGI for various income ranges: 3975.0% for AGIs $75k-100k)
Taxes paid: $7,600 (reported on 11.8% of returns)
12469:
$7,600
State:
$9,183
(% of AGI for various income ranges: 1520.0% for AGIs $75k-100k)
Earned income credit: $2,167 (reported on 8.8% of returns)
Here:
$2,167
State:
$2,138
(% of AGI for various income ranges: 130.0% for AGIs below $25k)
Percentage of individuals using paid preparers for their 2020 taxes: 94.1%
Here:
94%
State:
95%
(% for various income ranges: 87.5% for AGIs below $25k, 100.0% for AGIs $25k-50k, 100.0% for AGIs $50k-75k, 80.0% for AGIs $75k-100k, 100.0% for AGIs $100k-200k)
Averages for the 2012 tax year for zip code 12469, filed in 2013:
Average Adjusted Gross Income (AGI) in 2012: $47,790 (Individual Income Tax Returns)
Here:
$47,790
State:
$77,088
Salary/wage: $44,295 (reported on 72.4% of returns)
Here:
$44,295
State:
$60,593
(% of AGI for various income ranges: 60.9% for AGIs below $25k, 68.1% for AGIs $25k-50k, 70.2% for AGIs $50k-75k, 74.8% for AGIs $75k-100k, 61.5% for AGIs $100k-200k)
Taxable interest for individuals: $506 (reported on 58.6% of returns)
This zip code:
$506
New York:
$3,125
(% of AGI for various income ranges: 1.8% for AGIs below $25k, 0.5% for AGIs $25k-50k, 1.1% for AGIs $50k-75k, 0.4% for AGIs $100k-200k)
Ordinary dividends: $1,167 (reported on 20.7% of returns)
Here:
$1,167
State:
$10,299
Profit/loss from business: +$4,450 (reported on 13.8% of returns)
Here:
+$4,450
State:
+$16,168
Taxable individual retirement arrangement distribution: $13,200 (reported on 10.3% of returns)
12469:
$13,200
New York:
$17,621
Total itemized deductions: $17,717 (27% of AGI, reported on 41.4% of returns)
Here:
$17,717
State:
$34,985
Here:
26.6% of AGI
State:
21.3% of AGI
(% of AGI for various income ranges: 22.4% for AGIs $25k-50k, 14.7% for AGIs $50k-75k, 17.3% for AGIs $75k-100k, 14.4% for AGIs $100k-200k)
Charity contributions: $1,562 (reported on 27.6% of returns)
Here:
$1,562
State:
$5,572
Taxes paid: $7,817 (reported on 41.4% of returns)
12469:
$7,817
State:
$18,656
(% of AGI for various income ranges: 8.5% for AGIs $25k-50k, 6.4% for AGIs $50k-75k, 7.1% for AGIs $75k-100k, 7.6% for AGIs $100k-200k)
Earned income credit: $1,460 (reported on 17.2% of returns)
Here:
$1,460
State:
$2,230
(% of AGI for various income ranges: 6.1% for AGIs below $25k)
Percentage of individuals using paid preparers for their 2012 taxes: 58.6%
Here:
59%
State:
66%
(% for various income ranges: 54.5% for AGIs below $25k, 57.1% for AGIs $25k-50k, 100.0% for AGIs $50k-75k, 66.7% for AGIs $100k-200k)
Averages for the 2004 tax year for zip code 12469, filed in 2005:
Average Adjusted Gross Income (AGI) in 2004: $36,599 (Individual Income Tax Returns)
Here:
$36,599
State:
$59,519
Salary/wage: $33,912 (reported on 74.4% of returns)
Here:
$33,912
State:
$50,673
(% of AGI for various income ranges: 73.2% for AGIs below $10k, 64.2% for AGIs $10k-25k, 71.0% for AGIs $25k-50k, 75.3% for AGIs $50k-75k, 70.8% for AGIs $75k-100k, 56.0% for AGIs over 100k)
Taxable interest for individuals: $917 (reported on 62.6% of returns)
This zip code:
$917
New York:
$2,377
(% of AGI for various income ranges: 6.7% for AGIs below $10k, 3.9% for AGIs $10k-25k, 1.6% for AGIs $25k-50k, 0.8% for AGIs $50k-75k, 0.6% for AGIs $75k-100k, 1.5% for AGIs over 100k)
Taxable dividends: $769 (reported on 22.5% of returns)
Here:
$769
State:
$5,394
(% of AGI for various income ranges: 1.4% for AGIs $10k-25k, 0.7% for AGIs $25k-50k, 0.3% for AGIs $50k-75k, 0.1% for AGIs $75k-100k)
Net capital gain/loss: +$3,685 (reported on 18.7% of returns)
Here:
+$3,685
State:
+$23,581
Profit/loss from business: +$6,111 (reported on 18.7% of returns)
Here:
+$6,111
State:
+$13,809
(% of AGI for various income ranges: -8.1% for AGIs below $10k, 9.0% for AGIs $10k-25k, 5.8% for AGIs $25k-50k, 2.4% for AGIs $50k-75k)
Total itemized deductions: $13,466 (24% of AGI, reported on 35.6% of returns)
Here:
$13,466
State:
$25,864
Here:
23.7% of AGI
State:
21.9% of AGI
(% of AGI for various income ranges: 16.1% for AGIs $10k-25k, 12.5% for AGIs $25k-50k, 14.9% for AGIs $50k-75k, 12.8% for AGIs $75k-100k, 11.3% for AGIs over 100k)
Charity contributions deductions: $1,338 (2% of AGI, reported on 26.6% of returns)
Here:
$1,338
State:
$4,439
Here:
2.2% of AGI
State:
3.6% of AGI
(% of AGI for various income ranges: 2.9% for AGIs below $10k, 1.3% for AGIs $25k-50k, 1.0% for AGIs $50k-75k, 1.9% for AGIs $75k-100k)
Total tax: $4,330 (reported on 79.6% of returns)
12469:
$4,330
State:
$11,730
(% of AGI for various income ranges: 5.3% for AGIs below $10k, 4.8% for AGIs $10k-25k, 7.5% for AGIs $25k-50k, 9.3% for AGIs $50k-75k, 11.8% for AGIs $75k-100k, 14.3% for AGIs over 100k)
Earned income credit: $1,154 (reported on 13.5% of returns)
Here:
$1,154
State:
$1,757
Percentage of individuals using paid preparers for their 2004 taxes: 57.1%
Here:
57%
State:
67%
(% for various income ranges: 51.6% for AGIs below $10k, 57.8% for AGIs $10k-25k, 58.1% for AGIs $25k-50k, 55.6% for AGIs $50k-75k, 110.5% for AGIs $75k-100k)
Household received Food Stamps/SNAP in the past 12 months: 90 Household did not receive Food Stamps/SNAP in the past 12 months: 287
Women who had a birth in the past 12 months: 30 (30 now married, 0 unmarried) Women who did not have a birth in the past 12 months: 56 (28 now married, 27 unmarried)
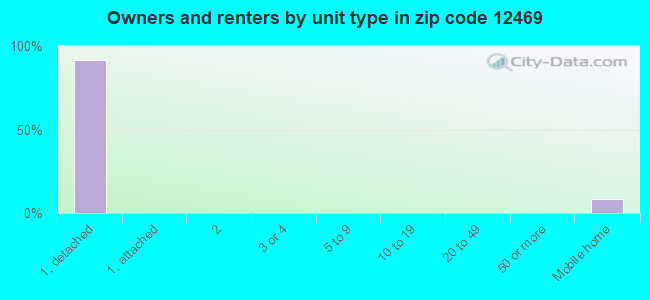
Housing units in zip code 12469 with a mortgage: 211 (4 second mortgage, 4 both second mortgage and home equity loan) Houses without a mortgage: 43
Median monthly owner costs for units with a mortgage: $1,547 Median monthly owner costs for units without a mortgage: $761
Residents with income below the poverty level in 2022:
This zip code:
1.9%
Whole state:
14.3%
Residents with income below 50% of the poverty level in 2022:
This zip code:
1.1%
Whole state:
6.8%
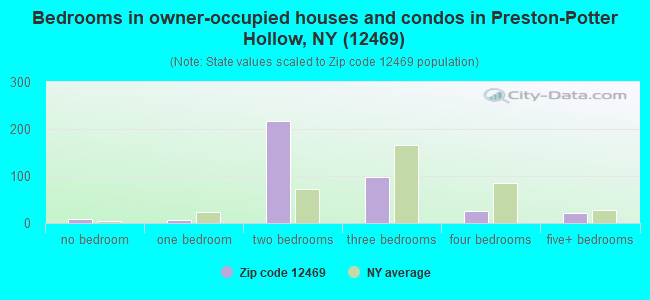
Median number of rooms in houses and condos:
Here:
4.7
State:
6.3
Notable locations in this zip code not listed on our city pages
Cemeteries: Bates Hollow Church Cemetery (1), Scott Patent Cemetery (2), Brookside Cemetery (3), Ellis Cemetery (4). Display/hide their locations on the map
Size of family households: 147 2-persons, 42 3-persons, 3 4-persons, 9 5-persons
Size of nonfamily households: 71 1-person, 104 2-persons, 3 3-persons
64 married couples with children.
12 single-parent households (12 women).
98.0% of residents of 12469 zip code speak English at home.
0.4% of residents speak Spanish at home (100% very well).
1.8% of residents speak other Indo-European language at home (71% very well, 29% not well).
Foreign born population: 37 (4.7%) (100.0% of them are naturalized citizens)
This zip code:
4.7%
Whole state:
22.7%
36%Sweden
33%United Kingdom, excluding England and Scotland
25%Iran
11%North Macedonia (Macedonia)
8%France
8%Barbados
6%Denmark
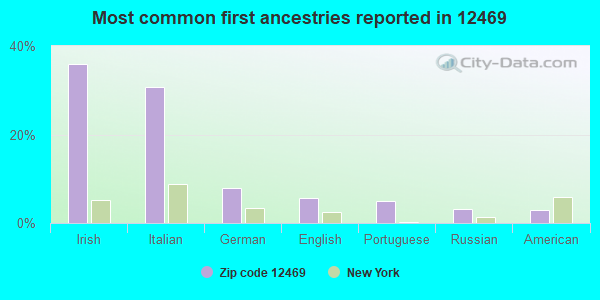
36%Irish
31%Italian
8%German
6%English
5%Portuguese
3%Russian
3%American
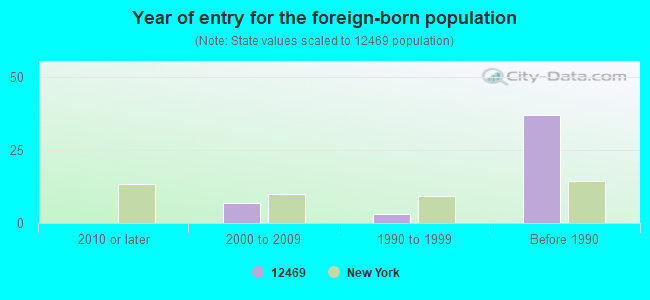
Year of entry for the foreign-born population
02010 or later
72000 to 2009
31990 to 1999
37Before 1990
Housing units lacking complete plumbing facilities: 3.5% Housing units lacking complete kitchen facilities: 2.9%
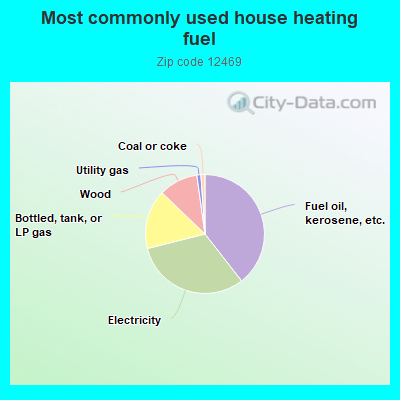
39.7%Fuel oil, kerosene, etc.
31.8%Electricity
16.2%Bottled, tank, or LP gas
10.7%Wood
1.1%Utility gas
1.1%Coal or coke
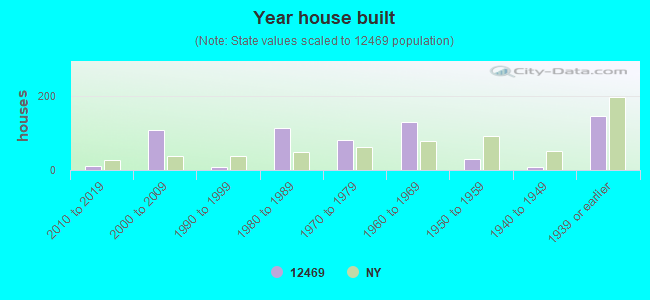
Population in 1990: 421. Population change in the 1990s: +362 (+86.0%).
Place of birth for U.S.-born residents:
This state: 642
Northeast: 66
Midwest: 19
South: 1
West: 7
80% of the 12469 zip code residents lived in the same house 5 years ago. Out of people who lived in different houses, 34% lived in this county. Out of people who lived in different counties, 50% lived in New York.
98% of the 12469 zip code residents lived in the same house 1 year ago. Out of people who lived in different houses, 75% moved from this county. Out of people who lived in different houses, 12% moved from different state.
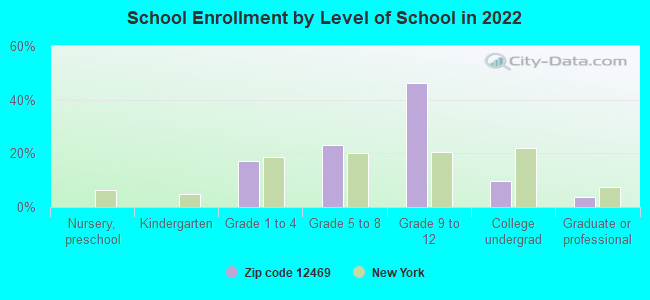
Private vs. public school enrollment:
Students in private schools in grades 1 to 8 (elementary and middle school): 18
Here:
82.8%
New York:
15.6%
Students in private schools in grades 9 to 12 (high school): 6
Here:
25.1%
New York:
15.0%
Students in private undergraduate colleges:
Here:
0.0%
New York:
39.2%
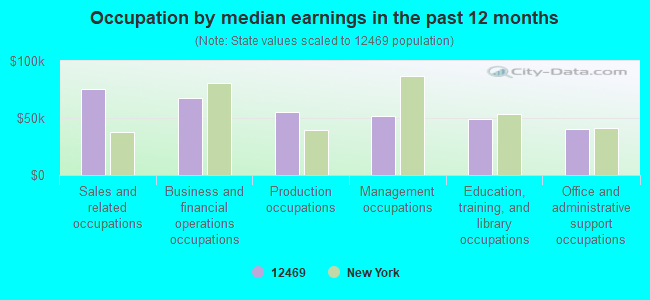
Occupation by median earnings in the past 12 months ($)
75,261Sales and related occupations
67,308Business and financial operations occupations
55,094Production occupations
51,989Management occupations
48,758Education, training, and library occupations
40,521Office and administrative support occupations
Top industries in this zip code by the number of employees in 2005:
Professional, Scientific, and Technical Services: Other Accounting Services (1-4 employees: 1 establishment)
Construction: Site Preparation Contractors (1-4: 1)
Construction: New Single-Family Housing Construction (except Operative Builders) (1-4: 1)
Professional, Scientific, and Technical Services: Advertising Agencies (1-4: 1)
Information: All Other Information Services (1-4: 1)
Other Services (except Public Administration): General Automotive Repair (1-4: 1)
Fatal accident statistics in 2013:
Fatal accident count: 1
Vehicles involved in fatal accidents: 1
Fatal accidents caused by drunken drivers: 1
Fatalities: 1
Persons involved in fatal accidents: 1
Pedestrians involved in fatal accidents: 0
Home Mortgage Disclosure Act Aggregated Statistics For Year 2009 (Based on 4 partial tracts)
A) FHA, FSA/RHS & VA Home Purchase Loans
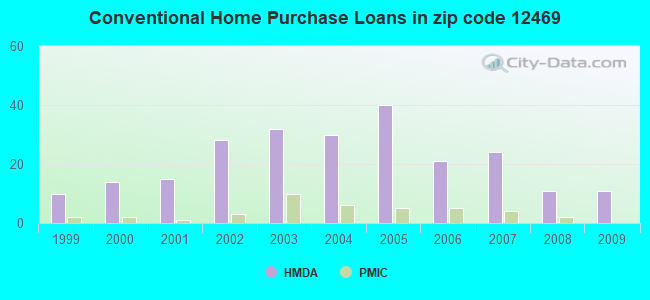
B) Conventional Home Purchase Loans
C) Refinancings
D) Home Improvement Loans
F) Non-occupant Loans on < 5 Family Dwellings (A B C & D)
G) Loans On Manufactured Home Dwelling (A B C & D)
Number
Average Value
Number
Average Value
Number
Average Value
Number
Average Value
Number
Average Value
Number
Average Value
LOANS ORIGINATED
2
$148,650
11
$142,593
26
$140,527
8
$55,949
4
$114,842
5
$121,654
APPLICATIONS APPROVED, NOT ACCEPTED
1
$100,710
1
$155,870
4
$125,175
0
$0
0
$0
2
$126,755
APPLICATIONS DENIED
1
$110,710
4
$75,980
18
$165,669
3
$26,853
4
$163,550
3
$55,053
APPLICATIONS WITHDRAWN
0
$0
1
$123,010
9
$138,638
0
$0
0
$0
0
$0
FILES CLOSED FOR INCOMPLETENESS
0
$0
0
$0
2
$142,725
0
$0
0
$0
0
$0
Aggregated Statistics For Year 2008 (Based on 4 partial tracts)
A) FHA, FSA/RHS & VA Home Purchase Loans
B) Conventional Home Purchase Loans
C) Refinancings
D) Home Improvement Loans
F) Non-occupant Loans on < 5 Family Dwellings (A B C & D)
G) Loans On Manufactured Home Dwelling (A B C & D)
Number
Average Value
Number
Average Value
Number
Average Value
Number
Average Value
Number
Average Value
Number
Average Value
LOANS ORIGINATED
2
$175,465
11
$133,622
24
$138,721
10
$35,500
9
$130,360
2
$63,320
APPLICATIONS APPROVED, NOT ACCEPTED
0
$0
2
$137,075
3
$179,397
2
$46,095
2
$137,565
1
$127,720
APPLICATIONS DENIED
0
$0
3
$96,617
22
$168,747
11
$26,726
2
$114,270
2
$66,295
APPLICATIONS WITHDRAWN
1
$145,890
3
$93,697
6
$141,152
1
$121,040
1
$116,350
0
$0
FILES CLOSED FOR INCOMPLETENESS
0
$0
2
$250,480
2
$148,515
0
$0
1
$341,260
0
$0
Aggregated Statistics For Year 2007 (Based on 4 partial tracts)
A) FHA, FSA/RHS & VA Home Purchase Loans
B) Conventional Home Purchase Loans
C) Refinancings
D) Home Improvement Loans
F) Non-occupant Loans on < 5 Family Dwellings (A B C & D)
G) Loans On Manufactured Home Dwelling (A B C & D)
Number
Average Value
Number
Average Value
Number
Average Value
Number
Average Value
Number
Average Value
Number
Average Value
LOANS ORIGINATED
4
$140,895
24
$152,250
35
$139,488
15
$68,384
13
$160,662
2
$114,835
APPLICATIONS APPROVED, NOT ACCEPTED
1
$137,620
5
$95,612
7
$111,951
2
$69,885
2
$121,615
2
$49,630
APPLICATIONS DENIED
1
$61,410
9
$117,480
36
$168,973
14
$69,364
8
$189,928
5
$72,322
APPLICATIONS WITHDRAWN
0
$0
3
$104,103
12
$132,922
1
$159,220
2
$38,965
2
$137,605
FILES CLOSED FOR INCOMPLETENESS
0
$0
1
$70,650
2
$145,070
0
$0
0
$0
0
$0
Aggregated Statistics For Year 2006 (Based on 4 partial tracts)
A) FHA, FSA/RHS & VA Home Purchase Loans
B) Conventional Home Purchase Loans
C) Refinancings
D) Home Improvement Loans
F) Non-occupant Loans on < 5 Family Dwellings (A B C & D)
G) Loans On Manufactured Home Dwelling (A B C & D)
Number
Average Value
Number
Average Value
Number
Average Value
Number
Average Value
Number
Average Value
Number
Average Value
LOANS ORIGINATED
4
$160,018
21
$135,475
45
$119,888
26
$46,617
7
$146,231
6
$73,145
APPLICATIONS APPROVED, NOT ACCEPTED
0
$0
3
$151,170
8
$138,321
1
$44,180
1
$120,620
0
$0
APPLICATIONS DENIED
0
$0
4
$79,995
52
$147,152
9
$66,329
4
$88,640
5
$125,396
APPLICATIONS WITHDRAWN
0
$0
3
$111,147
23
$148,373
1
$107,630
2
$94,710
1
$119,460
FILES CLOSED FOR INCOMPLETENESS
0
$0
3
$143,253
10
$216,518
0
$0
3
$274,903
0
$0
Aggregated Statistics For Year 2005 (Based on 4 partial tracts)
A) FHA, FSA/RHS & VA Home Purchase Loans
B) Conventional Home Purchase Loans
C) Refinancings
D) Home Improvement Loans
F) Non-occupant Loans on < 5 Family Dwellings (A B C & D)
G) Loans On Manufactured Home Dwelling (A B C & D)
Number
Average Value
Number
Average Value
Number
Average Value
Number
Average Value
Number
Average Value
Number
Average Value
LOANS ORIGINATED
4
$140,085
40
$153,410
46
$132,061
11
$51,350
16
$147,351
10
$97,107
APPLICATIONS APPROVED, NOT ACCEPTED
0
$0
6
$171,820
13
$104,668
0
$0
4
$168,595
1
$68,240
APPLICATIONS DENIED
0
$0
10
$100,918
50
$133,013
14
$70,224
7
$100,831
6
$62,343
APPLICATIONS WITHDRAWN
1
$98,520
5
$143,854
34
$140,878
4
$138,268
4
$95,145
4
$72,302
FILES CLOSED FOR INCOMPLETENESS
0
$0
1
$119,650
17
$141,222
0
$0
0
$0
0
$0
Aggregated Statistics For Year 2004 (Based on 4 partial tracts)
A) FHA, FSA/RHS & VA Home Purchase Loans
B) Conventional Home Purchase Loans
C) Refinancings
D) Home Improvement Loans
E) Loans on Dwellings For 5+ Families
F) Non-occupant Loans on < 5 Family Dwellings (A B C & D)
G) Loans On Manufactured Home Dwelling (A B C & D)
Number
Average Value
Number
Average Value
Number
Average Value
Number
Average Value
Number
Average Value
Number
Average Value
Number
Average Value
LOANS ORIGINATED
4
$80,842
30
$125,911
44
$107,678
17
$41,714
0
$0
13
$116,972
7
$74,300
APPLICATIONS APPROVED, NOT ACCEPTED
0
$0
5
$57,234
8
$100,095
1
$26,780
1
$56,120
0
$0
4
$54,372
APPLICATIONS DENIED
2
$91,405
6
$86,953
39
$108,708
10
$35,662
0
$0
4
$159,465
3
$65,947
APPLICATIONS WITHDRAWN
2
$143,350
4
$117,818
23
$104,529
3
$68,603
0
$0
3
$73,030
0
$0
FILES CLOSED FOR INCOMPLETENESS
0
$0
1
$172,410
9
$125,149
1
$65,350
0
$0
0
$0
0
$0
Aggregated Statistics For Year 2003 (Based on 4 partial tracts)
A) FHA, FSA/RHS & VA Home Purchase Loans
B) Conventional Home Purchase Loans
C) Refinancings
D) Home Improvement Loans
E) Loans on Dwellings For 5+ Families
F) Non-occupant Loans on < 5 Family Dwellings (A B C & D)
Number
Average Value
Number
Average Value
Number
Average Value
Number
Average Value
Number
Average Value
Number
Average Value
LOANS ORIGINATED
4
$95,805
32
$100,271
73
$94,640
3
$49,737
1
$38,440
15
$99,963
APPLICATIONS APPROVED, NOT ACCEPTED
0
$0
9
$61,394
11
$111,255
0
$0
0
$0
4
$112,470
APPLICATIONS DENIED
2
$26,910
4
$75,908
35
$110,285
4
$28,585
0
$0
3
$75,833
APPLICATIONS WITHDRAWN
0
$0
5
$74,688
21
$98,016
1
$29,720
0
$0
1
$98,060
FILES CLOSED FOR INCOMPLETENESS
0
$0
0
$0
2
$101,745
0
$0
0
$0
0
$0
Aggregated Statistics For Year 2002 (Based on 4 partial tracts)
A) FHA, FSA/RHS & VA Home Purchase Loans
B) Conventional Home Purchase Loans
C) Refinancings
D) Home Improvement Loans
F) Non-occupant Loans on < 5 Family Dwellings (A B C & D)
Number
Average Value
Number
Average Value
Number
Average Value
Number
Average Value
Number
Average Value
LOANS ORIGINATED
2
$85,640
28
$110,838
29
$74,337
4
$28,110
9
$96,709
APPLICATIONS APPROVED, NOT ACCEPTED
0
$0
7
$50,923
9
$82,759
1
$49,070
2
$139,290
APPLICATIONS DENIED
1
$62,270
5
$86,788
20
$70,274
5
$24,882
2
$163,515
APPLICATIONS WITHDRAWN
1
$50,740
1
$78,450
26
$75,045
1
$32,060
0
$0
FILES CLOSED FOR INCOMPLETENESS
0
$0
1
$47,630
7
$100,353
1
$40,750
0
$0
Aggregated Statistics For Year 2001 (Based on 4 partial tracts)
A) FHA, FSA/RHS & VA Home Purchase Loans
B) Conventional Home Purchase Loans
C) Refinancings
D) Home Improvement Loans
F) Non-occupant Loans on < 5 Family Dwellings (A B C & D)
Number
Average Value
Number
Average Value
Number
Average Value
Number
Average Value
Number
Average Value
LOANS ORIGINATED
4
$71,695
15
$93,001
32
$75,296
8
$19,114
9
$75,411
APPLICATIONS APPROVED, NOT ACCEPTED
0
$0
3
$53,920
8
$68,582
3
$56,123
0
$0
APPLICATIONS DENIED
0
$0
8
$57,621
31
$62,308
2
$21,385
5
$59,764
APPLICATIONS WITHDRAWN
2
$61,890
6
$118,635
21
$65,870
0
$0
1
$76,880
FILES CLOSED FOR INCOMPLETENESS
0
$0
1
$79,960
3
$67,693
0
$0
0
$0
Aggregated Statistics For Year 2000 (Based on 4 partial tracts)
A) FHA, FSA/RHS & VA Home Purchase Loans
B) Conventional Home Purchase Loans
C) Refinancings
D) Home Improvement Loans
F) Non-occupant Loans on < 5 Family Dwellings (A B C & D)
Number
Average Value
Number
Average Value
Number
Average Value
Number
Average Value
Number
Average Value
LOANS ORIGINATED
5
$77,314
14
$85,511
13
$46,977
9
$21,782
4
$54,118
APPLICATIONS APPROVED, NOT ACCEPTED
0
$0
9
$46,179
6
$52,415
2
$54,200
3
$84,917
APPLICATIONS DENIED
0
$0
13
$41,352
23
$48,015
7
$12,443
0
$0
APPLICATIONS WITHDRAWN
0
$0
1
$47,400
19
$59,395
1
$39,500
0
$0
FILES CLOSED FOR INCOMPLETENESS
0
$0
1
$97,590
3
$77,567
0
$0
2
$67,270
Aggregated Statistics For Year 1999 (Based on 2 partial tracts)
A) FHA, FSA/RHS & VA Home Purchase Loans
B) Conventional Home Purchase Loans
C) Refinancings
D) Home Improvement Loans
F) Non-occupant Loans on < 5 Family Dwellings (A B C & D)

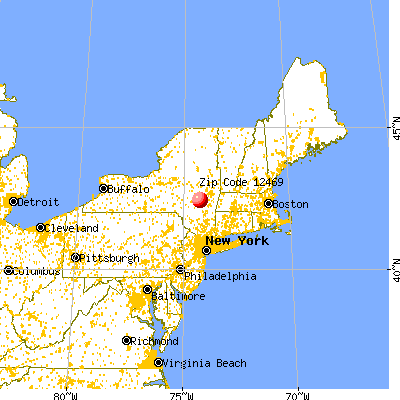


 Nearest zip codes: 12422, 12120, 12460, 12147, 12496, 12122.