Estimated zip code population in 2022: 2,657 Zip code population in 2010: 3,039 Zip code population in 2000: 3,103
Houses and condos: 1,505 Renter-occupied apartments: 277
% of renters here:
23%
State:
46%
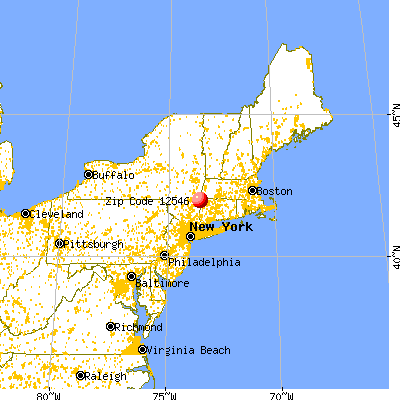
March 2022 cost of living index in zip code 12546: 116.3 (more than average, U.S. average is 100)
Land area: 45.6 sq. mi. Water area: 0.5 sq. mi.
Population density: 58 people per square mile
(very low).
OSM Map
General Map
Google Map
MSN Map
OSM Map
General Map
Google Map
MSN Map
OSM Map
General Map
Google Map
MSN Map
OSM Map
General Map
Google Map
MSN Map
Please wait while loading the map...
Real estate property taxes paid for housing units in 2022:
This zip code:
1.7% ($5,172)
New York:
1.5% ($6,180)
Median real estate property taxes paid for housing units with mortgages in 2022: $5,948 (1.6%) Median real estate property taxes paid for housing units with no mortgage in 2022: $4,450 (2.0%)
Business Search- 14 Million verified businesses
Males: 1,293
(48.7%)
Females: 1,363
(51.3%)
For population 25 years and over in 12546:
High school or higher: 91.9%
Bachelor's degree or higher: 38.8%
Graduate or professional degree: 19.3%
Unemployed: 1.7%
Mean travel time to work (commute): 27.8 minutes
For population 15 years and over in 12546:
Never married: 33.1%
Now married: 53.0%
Separated: 0.9%
Widowed: 5.5%
Divorced: 7.4%
Zip code 12546 compared to state average:
Unemployed percentage significantly below state average.
Black race population percentage below state average.
Median age significantly above state average.
Foreign-born population percentage below state average.
Renting percentage below state average.
Length of stay since moving in significantly above state average.
Averages for the 2020 tax year for zip code 12546, filed in 2021:
Average Adjusted Gross Income (AGI) in 2020: $98,989 (Individual Income Tax Returns)
Here:
$98,989
State:
$90,930
Salary/wage: $71,028 (reported on 75.5% of returns)
Here:
$71,028
State:
$72,104
(% of AGI for various income ranges: 1164.1% for AGIs below $25k, 3683.3% for AGIs $25k-50k, 6282.0% for AGIs $50k-75k, 10060.0% for AGIs $75k-100k, 15282.7% for AGIs $100k-200k)
Taxable interest for individuals: $2,175 (reported on 42.4% of returns)
This zip code:
$2,175
New York:
$3,075
(% of AGI for various income ranges: 28.6% for AGIs below $25k, 36.3% for AGIs $25k-50k, 57.3% for AGIs $50k-75k, 130.0% for AGIs $75k-100k, 316.4% for AGIs $100k-200k)
Ordinary dividends: $14,369 (reported on 23.2% of returns)
Here:
$14,369
State:
$11,095
(% of AGI for various income ranges: 37.2% for AGIs below $25k, 80.7% for AGIs $25k-50k, 267.3% for AGIs $50k-75k, 307.5% for AGIs $75k-100k, 563.6% for AGIs $100k-200k)
Net capital gain/loss in AGI: +$88,559 (reported on 19.2% of returns)
Here:
+$88,559
State:
+$44,925
(% of AGI for various income ranges: 20.3% for AGIs below $25k, 45.6% for AGIs $25k-50k, 73.3% for AGIs $50k-75k, 246.2% for AGIs $75k-100k, 734.5% for AGIs $100k-200k)
Profit/loss from business: +$19,276 (reported on 21.9% of returns)
Here:
+$19,276
State:
+$14,940
(% of AGI for various income ranges: 291.4% for AGIs below $25k, 310.7% for AGIs $25k-50k, 459.3% for AGIs $50k-75k, 772.5% for AGIs $75k-100k, 1152.7% for AGIs $100k-200k)
Taxable individual retirement arrangement distribution: $21,293 (reported on 9.9% of returns)
12546:
$21,293
New York:
$19,609
(% of AGI for various income ranges: 84.1% for AGIs below $25k, 211.1% for AGIs $25k-50k, 528.8% for AGIs $75k-100k, 1779.1% for AGIs $100k-200k)
Total itemized deductions: $46,228 (reported on 11.9% of returns)
Here:
$46,228
State:
$39,326
(% of AGI for various income ranges: 324.4% for AGIs $25k-50k, 498.7% for AGIs $50k-75k, 667.5% for AGIs $75k-100k, 1278.2% for AGIs $100k-200k)
Charity contributions: $20,894 (reported on 10.6% of returns)
Here:
$20,894
State:
$15,420
(% of AGI for various income ranges: 38.9% for AGIs $25k-50k, 83.3% for AGIs $50k-75k, 102.7% for AGIs $100k-200k)
Taxes paid: $8,739 (reported on 11.9% of returns)
12546:
$8,739
State:
$9,183
(% of AGI for various income ranges: 83.7% for AGIs $25k-50k, 163.3% for AGIs $50k-75k, 241.2% for AGIs $75k-100k, 358.2% for AGIs $100k-200k)
Earned income credit: $1,932 (reported on 12.6% of returns)
Here:
$1,932
State:
$2,138
(% of AGI for various income ranges: 81.0% for AGIs below $25k, 48.9% for AGIs $25k-50k)
Percentage of individuals using paid preparers for their 2020 taxes: 92.7%
Here:
93%
State:
95%
(% for various income ranges: 91.1% for AGIs below $25k, 90.0% for AGIs $25k-50k, 91.3% for AGIs $50k-75k, 92.9% for AGIs $75k-100k, 100.0% for AGIs $100k-200k, 100.0% for AGIs over 200k)
Averages for the 2012 tax year for zip code 12546, filed in 2013:
Average Adjusted Gross Income (AGI) in 2012: $66,502 (Individual Income Tax Returns)
Here:
$66,502
State:
$77,088
Salary/wage: $49,940 (reported on 79.9% of returns)
Here:
$49,940
State:
$60,593
(% of AGI for various income ranges: 66.5% for AGIs below $25k, 73.3% for AGIs $25k-50k, 69.7% for AGIs $50k-75k, 63.2% for AGIs $75k-100k, 68.5% for AGIs $100k-200k, 43.1% for AGIs over 200k)
Taxable interest for individuals: $1,614 (reported on 42.4% of returns)
This zip code:
$1,614
New York:
$3,125
(% of AGI for various income ranges: 2.2% for AGIs below $25k, 0.4% for AGIs $25k-50k, 1.1% for AGIs $50k-75k, 1.6% for AGIs $75k-100k, 0.9% for AGIs $100k-200k, 0.9% for AGIs over 200k)
Ordinary dividends: $9,415 (reported on 23.7% of returns)
Here:
$9,415
State:
$10,299
(% of AGI for various income ranges: 1.9% for AGIs below $25k, 1.1% for AGIs $25k-50k, 1.7% for AGIs $50k-75k, 2.8% for AGIs $75k-100k, 2.4% for AGIs $100k-200k, 6.0% for AGIs over 200k)
Net capital gain/loss in AGI: +$62,440 (reported on 14.4% of returns)
Here:
+$62,440
State:
+$42,474
(% of AGI for various income ranges: 0.5% for AGIs $25k-50k, 2.5% for AGIs $50k-75k, 2.1% for AGIs $75k-100k, 4.3% for AGIs $100k-200k, 35.8% for AGIs over 200k)
Profit/loss from business: +$13,911 (reported on 20.1% of returns)
Here:
+$13,911
State:
+$16,168
(% of AGI for various income ranges: 9.9% for AGIs below $25k, 7.2% for AGIs $25k-50k, 4.1% for AGIs $50k-75k, 1.7% for AGIs $75k-100k, 9.2% for AGIs $100k-200k)
Taxable individual retirement arrangement distribution: $11,429 (reported on 12.2% of returns)
12546:
$11,429
New York:
$17,621
(% of AGI for various income ranges: 3.8% for AGIs below $25k, 1.9% for AGIs $25k-50k, 2.9% for AGIs $50k-75k, 3.4% for AGIs $75k-100k, 3.9% for AGIs $100k-200k)
Total itemized deductions: $36,679 (28% of AGI, reported on 34.5% of returns)
Here:
$36,679
State:
$34,985
Here:
27.8% of AGI
State:
21.3% of AGI
(% of AGI for various income ranges: 17.5% for AGIs below $25k, 12.4% for AGIs $25k-50k, 14.0% for AGIs $50k-75k, 14.6% for AGIs $75k-100k, 18.9% for AGIs $100k-200k, 26.0% for AGIs over 200k)
Charity contributions: $4,085 (reported on 28.1% of returns)
Here:
$4,085
State:
$5,572
(% of AGI for various income ranges: 0.5% for AGIs below $25k, 0.8% for AGIs $25k-50k, 0.7% for AGIs $50k-75k, 0.9% for AGIs $75k-100k, 1.6% for AGIs $100k-200k, 3.2% for AGIs over 200k)
Taxes paid: $14,027 (reported on 34.5% of returns)
12546:
$14,027
State:
$18,656
(% of AGI for various income ranges: 6.9% for AGIs below $25k, 3.8% for AGIs $25k-50k, 5.7% for AGIs $50k-75k, 6.7% for AGIs $75k-100k, 9.6% for AGIs $100k-200k, 8.3% for AGIs over 200k)
Earned income credit: $1,833 (reported on 12.9% of returns)
Here:
$1,833
State:
$2,230
(% of AGI for various income ranges: 3.8% for AGIs below $25k, 0.7% for AGIs $25k-50k)
Percentage of individuals using paid preparers for their 2012 taxes: 61.9%
Here:
62%
State:
66%
(% for various income ranges: 51.9% for AGIs below $25k, 61.1% for AGIs $25k-50k, 65.0% for AGIs $50k-75k, 71.4% for AGIs $75k-100k, 76.9% for AGIs $100k-200k, 100.0% for AGIs over 200k)
Averages for the 2004 tax year for zip code 12546, filed in 2005:
Average Adjusted Gross Income (AGI) in 2004: $50,264 (Individual Income Tax Returns)
Here:
$50,264
State:
$59,519
Salary/wage: $40,079 (reported on 78.1% of returns)
Here:
$40,079
State:
$50,673
(% of AGI for various income ranges: 96.0% for AGIs below $10k, 67.0% for AGIs $10k-25k, 76.6% for AGIs $25k-50k, 76.1% for AGIs $50k-75k, 71.4% for AGIs $75k-100k, 46.3% for AGIs over 100k)
Taxable interest for individuals: $2,008 (reported on 54.4% of returns)
This zip code:
$2,008
New York:
$2,377
(% of AGI for various income ranges: 9.1% for AGIs below $10k, 3.8% for AGIs $10k-25k, 1.7% for AGIs $25k-50k, 1.7% for AGIs $50k-75k, 1.5% for AGIs $75k-100k, 2.2% for AGIs over 100k)
Taxable dividends: $4,990 (reported on 27.3% of returns)
Here:
$4,990
State:
$5,394
(% of AGI for various income ranges: 8.7% for AGIs below $10k, 2.3% for AGIs $10k-25k, 1.7% for AGIs $25k-50k, 0.7% for AGIs $50k-75k, 1.8% for AGIs $75k-100k, 4.1% for AGIs over 100k)
Net capital gain/loss: +$23,362 (reported on 18.7% of returns)
Here:
+$23,362
State:
+$23,581
(% of AGI for various income ranges: -1.7% for AGIs below $10k, 0.6% for AGIs $10k-25k, -0.1% for AGIs $25k-50k, 0.3% for AGIs $50k-75k, 1.6% for AGIs $75k-100k, 19.6% for AGIs over 100k)
Profit/loss from business: +$11,872 (reported on 20.9% of returns)
Here:
+$11,872
State:
+$13,809
(% of AGI for various income ranges: 14.5% for AGIs below $10k, 11.3% for AGIs $10k-25k, 7.7% for AGIs $25k-50k, 3.4% for AGIs $50k-75k, 5.8% for AGIs $75k-100k, 2.7% for AGIs over 100k)
IRA payment deduction: $3,500 (reported on 3.2% of returns)
12546:
$3,500
New York:
$3,115
(% of AGI for various income ranges: 1.0% for AGIs $10k-25k, 0.3% for AGIs $50k-75k, 0.8% for AGIs $75k-100k)
Self-employed pension: $15,067 (reported on 1.1% of returns)
Here:
$15,067
New York:
$19,016
Total itemized deductions: $22,665 (22% of AGI, reported on 31.2% of returns)
Here:
$22,665
State:
$25,864
Here:
22.0% of AGI
State:
21.9% of AGI
(% of AGI for various income ranges: 13.5% for AGIs below $10k, 14.5% for AGIs $10k-25k, 10.3% for AGIs $25k-50k, 14.2% for AGIs $50k-75k, 13.8% for AGIs $75k-100k, 15.6% for AGIs over 100k)
Charity contributions deductions: $2,800 (3% of AGI, reported on 27.2% of returns)
Here:
$2,800
State:
$4,439
Here:
2.5% of AGI
State:
3.6% of AGI
(% of AGI for various income ranges: 1.0% for AGIs $10k-25k, 0.7% for AGIs $25k-50k, 1.2% for AGIs $50k-75k, 1.5% for AGIs $75k-100k, 2.1% for AGIs over 100k)
Total tax: $8,762 (reported on 78.1% of returns)
12546:
$8,762
State:
$11,730
(% of AGI for various income ranges: 4.3% for AGIs below $10k, 5.4% for AGIs $10k-25k, 7.6% for AGIs $25k-50k, 9.7% for AGIs $50k-75k, 11.7% for AGIs $75k-100k, 20.1% for AGIs over 100k)
Earned income credit: $1,479 (reported on 11.9% of returns)
Here:
$1,479
State:
$1,757
Percentage of individuals using paid preparers for their 2004 taxes: 62.5%
Here:
62%
State:
67%
(% for various income ranges: 52.4% for AGIs below $10k, 61.3% for AGIs $10k-25k, 61.3% for AGIs $25k-50k, 69.0% for AGIs $50k-75k, 67.0% for AGIs $75k-100k, 79.3% for AGIs over 100k)
Likely homosexual households (counted as self-reported same-sex unmarried-partner households)
Lesbian couples: 0.0% of all households
Gay men: 0.7% of all households
Household received Food Stamps/SNAP in the past 12 months: 80 Household did not receive Food Stamps/SNAP in the past 12 months: 1,113
Women who had a birth in the past 12 months: 37 (26 now married, 11 unmarried) Women who did not have a birth in the past 12 months: 463 (157 now married, 306 unmarried)
Housing units in zip code 12546 with a mortgage: 451 (71 second mortgage, 20 home equity loan, 52 both second mortgage and home equity loan) Houses without a mortgage: 20
Median monthly owner costs for units with a mortgage: $2,363 Median monthly owner costs for units without a mortgage: $553
Residents with income below the poverty level in 2022:
This zip code:
13.8%
Whole state:
14.3%
Residents with income below 50% of the poverty level in 2022:
This zip code:
4.9%
Whole state:
6.8%
Median number of rooms in houses and condos:
Here:
6.4
State:
6.3
Median number of rooms in apartments:
Here:
4.5
State:
3.8
Notable locations in this zip code not listed on our city pages
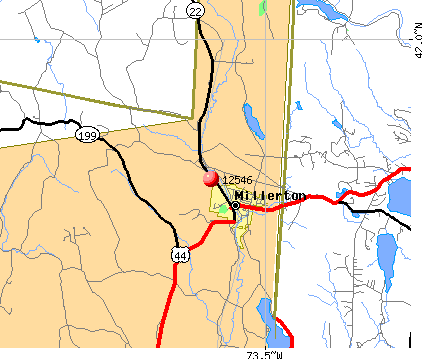
Notable locations in zip code 12546: Barton Corners (A), Undermountain Golf Course (B), Silamar Farm (C), Driftways Farm (D), North East - Millerton Library (E), Millerton Fire Department (F). Display/hide their locations on the map
Churches in zip code 12546 include: North East Baptist Church (A), Millerton Methodist Church (B), Faith Bible Chapel (C), First Church of Christ Scientist (D), Kingdom Hall of Jehovahs Witnesses (E). Display/hide their locations on the map
In group quarters: 44 (-1 institutionalized population)
Size of family households: 421 2-persons, 164 3-persons, 78 4-persons, 45 5-persons, 24 6-persons, 6 7-or-more-persons
Size of nonfamily households: 408 1-person, 63 2-persons
160 married couples with children.
209 single-parent households (37 men, 172 women).
80.6% of residents of 12546 zip code speak English at home.
12.4% of residents speak Spanish at home (42% very well, 19% well, 19% not well, 20% not at all).
6.6% of residents speak other Indo-European language at home (95% very well, 5% well).
0.6% of residents speak Asian or Pacific Island language at home (47% very well, 53% well).
Foreign born population: 353 (13.3%) (28.0% of them are naturalized citizens)
This zip code:
13.3%
Whole state:
22.7%
51%El Salvador
11%Czechoslovakia (includes Czech Republic and Slovakia)
9%Dominica
8%Colombia
4%Uruguay
4%Taiwan
3%Chile
9%German
9%American
9%Italian
7%English
7%Irish
4%Hungarian
4%Scottish
Year of entry for the foreign-born population
2202010 or later
422000 to 2009
291990 to 1999
107Before 1990
Facilities with environmental interests located in this zip code:
HIPOTRONICS INC (ROUTE 22 AND 199 in MILLERTON, NY)
AIR MINOR (AIRS/AFS) STATE MASTER (New York facility tracking) - AIR PROGRAM, CRITERIA AND HAZARDOUS AIR POLLUTANT INVENTORY (Inventory of air pollution sources) Small Quantity Generators, between 100 kg and 1000 kg of hazardous waste/month (Resource Conservation and Recovery Act (tracking hazardous waste)) - notification TRI REPORTER (Tracking of toxic chemicals releasing facilities) Business SIC classification: POWER, DISTRIBUTION, AND SPECIALTY TRANSFORMERS; INSTRUMENTS FOR MEASURING AND TESTING OF ELECTRICITY AND ELECTRICAL SIGNALS Business NAICS classification: POWER, DISTRIBUTION, AND SPECIALTY TRANSFORMER MANUFACTURING.
ARNOFF MOVING & STORAGE (5979 N ELM ST in MILLERTON, NY)
Large Quantity Generators, more that 1000 kg of hazardous waste/month (Resource Conservation and Recovery Act (tracking hazardous waste))
AGWAY INC (RTE 22 1/2 MI N RTE 44 in MILLERTON, NY)
HAZARDOUS WASTE BIENNIAL REPORTER (Resource Conservation and Recovery Act (tracking hazardous waste)) (Resource Conservation and Recovery Act (tracking hazardous waste))
GETTY PETROLEUM CORP (RTE 44 S 1.5 MI N OF RTE 27 in MILLERTON, NY)
Conditionally Exempt Small Quantity Generators, less than 100 kg/month of hazardous waste (Resource Conservation and Recovery Act (tracking hazardous waste)) - notification
Housing units lacking complete plumbing facilities: 4.7% Housing units lacking complete kitchen facilities: 2.3%
62.4%Fuel oil, kerosene, etc.
15.4%Electricity
11.5%Bottled, tank, or LP gas
4.8%Wood
3.7%Utility gas
1.4%No fuel used
0.9%Other fuel
Population in 1990: 3,131.
Place of birth for U.S.-born residents:
This state: 1,317
Northeast: 675
Midwest: 114
South: 74
West: 103
64% of the 12546 zip code residents lived in the same house 5 years ago. Out of people who lived in different houses, 52% lived in this county. Out of people who lived in different counties, 50% lived in New York.
91% of the 12546 zip code residents lived in the same house 1 year ago. Out of people who lived in different houses, 45% moved from this county. Out of people who lived in different houses, 43% moved from different county within same state. Out of people who lived in different houses, 10% moved from different state.
Private vs. public school enrollment:
Students in private schools in grades 1 to 8 (elementary and middle school): 43
Here:
24.0%
New York:
15.6%
Students in private schools in grades 9 to 12 (high school): 7
Here:
5.5%
New York:
15.0%
Students in private undergraduate colleges: 19
Here:
40.7%
New York:
39.2%
Occupation by median earnings in the past 12 months ($)
117,311Law enforcement workers including supervisors
105,134Business and financial operations occupations
102,925Management occupations
91,222Computer and mathematical occupations
89,923Architecture and engineering occupations
83,302Health diagnosing and treating practitioners and other technical occupations
Companies with federal contracts located in this zip code:
ASSOCIATED LIGHTNING ROD CO , (6020 ROUTE 22 in MILLERTON, NY; small business)
$34,400 with Army for Maintenance, Repair or Alteration of Real Property -- Other Airfield Structures. Signed on 2003-01-27. Completion date: 2003-04-30.
Top industries in this zip code by the number of employees in 2005:
Wholesale Trade: Plastics Materials and Basic Forms and Shapes Merchant Wholesalers (20-49 employees: 1 establishment)
Wholesale Trade: Petroleum and Petroleum Products Merchant Wholesalers (except Bulk Stations and Terminals) (20-49: 1)
Health Care and Social Assistance: Services for the Elderly and Persons with Disabilities (20-49: 1)
Administrative and Support and Waste Management and Remediation Services: Landscaping Services (10-19: 1, 1-4: 4)
Other Services (except Public Administration): General Automotive Repair (10-19: 1, 5-9: 1)
People in group quarters in 2010:
18 people in group homes intended for adults
5 people in emergency and transitional shelters (with sleeping facilities) for people experiencing homelessness
People in group quarters in 2000:
121 people in other noninstitutional group quarters
14 people in homes for the mentally retarded
Fatal accident statistics in 2011:
Fatal accident count: 2
Vehicles involved in fatal accidents: 2
Fatal accidents caused by drunken drivers: 0
Fatalities: 2
Persons involved in fatal accidents: 2
Pedestrians involved in fatal accidents: 0
Home Mortgage Disclosure Act Aggregated Statistics For Year 2009 (Based on 4 partial tracts)
A) FHA, FSA/RHS & VA Home Purchase Loans
B) Conventional Home Purchase Loans
C) Refinancings
D) Home Improvement Loans
F) Non-occupant Loans on < 5 Family Dwellings (A B C & D)
G) Loans On Manufactured Home Dwelling (A B C & D)
Number
Average Value
Number
Average Value
Number
Average Value
Number
Average Value
Number
Average Value
Number
Average Value
LOANS ORIGINATED
7
$181,936
24
$190,038
74
$201,136
22
$113,482
19
$305,571
2
$81,360
APPLICATIONS APPROVED, NOT ACCEPTED
0
$0
3
$1,447,317
9
$185,491
4
$81,820
0
$0
0
$0
APPLICATIONS DENIED
1
$144,410
6
$187,140
27
$272,813
14
$115,723
11
$157,569
0
$0
APPLICATIONS WITHDRAWN
0
$0
0
$0
19
$244,423
0
$0
4
$226,838
0
$0
FILES CLOSED FOR INCOMPLETENESS
0
$0
0
$0
4
$255,910
0
$0
0
$0
0
$0
Aggregated Statistics For Year 2008 (Based on 4 partial tracts)
A) FHA, FSA/RHS & VA Home Purchase Loans
B) Conventional Home Purchase Loans
C) Refinancings
D) Home Improvement Loans
F) Non-occupant Loans on < 5 Family Dwellings (A B C & D)
G) Loans On Manufactured Home Dwelling (A B C & D)
Number
Average Value
Number
Average Value
Number
Average Value
Number
Average Value
Number
Average Value
Number
Average Value
LOANS ORIGINATED
9
$246,544
38
$326,395
53
$175,633
26
$94,040
11
$477,068
1
$71,280
APPLICATIONS APPROVED, NOT ACCEPTED
2
$268,055
1
$150,480
12
$206,615
3
$182,840
1
$139,920
0
$0
APPLICATIONS DENIED
0
$0
3
$175,250
79
$249,209
20
$80,659
7
$238,633
2
$89,920
APPLICATIONS WITHDRAWN
0
$0
7
$302,431
19
$214,722
2
$129,315
0
$0
0
$0
FILES CLOSED FOR INCOMPLETENESS
0
$0
0
$0
3
$176,097
0
$0
0
$0
0
$0
Aggregated Statistics For Year 2007 (Based on 4 partial tracts)
A) FHA, FSA/RHS & VA Home Purchase Loans
B) Conventional Home Purchase Loans
C) Refinancings
D) Home Improvement Loans
E) Loans on Dwellings For 5+ Families
F) Non-occupant Loans on < 5 Family Dwellings (A B C & D)
G) Loans On Manufactured Home Dwelling (A B C & D)
Number
Average Value
Number
Average Value
Number
Average Value
Number
Average Value
Number
Average Value
Number
Average Value
Number
Average Value
LOANS ORIGINATED
3
$360,830
59
$212,333
102
$213,457
18
$64,338
2
$171,280
30
$227,048
3
$92,653
APPLICATIONS APPROVED, NOT ACCEPTED
0
$0
3
$154,070
18
$198,382
3
$52,350
0
$0
1
$143,880
2
$85,640
APPLICATIONS DENIED
0
$0
14
$143,344
95
$256,848
12
$108,269
0
$0
12
$345,777
4
$21,348
APPLICATIONS WITHDRAWN
0
$0
4
$272,605
36
$200,646
3
$20,483
0
$0
6
$241,552
0
$0
FILES CLOSED FOR INCOMPLETENESS
0
$0
4
$140,150
14
$238,993
0
$0
0
$0
0
$0
0
$0
Aggregated Statistics For Year 2006 (Based on 4 partial tracts)
A) FHA, FSA/RHS & VA Home Purchase Loans
B) Conventional Home Purchase Loans
C) Refinancings
D) Home Improvement Loans
F) Non-occupant Loans on < 5 Family Dwellings (A B C & D)
G) Loans On Manufactured Home Dwelling (A B C & D)
Number
Average Value
Number
Average Value
Number
Average Value
Number
Average Value
Number
Average Value
Number
Average Value
LOANS ORIGINATED
0
$0
85
$226,188
135
$181,437
43
$64,760
37
$217,220
2
$67,780
APPLICATIONS APPROVED, NOT ACCEPTED
2
$95,915
7
$248,416
25
$503,811
3
$39,997
7
$202,670
2
$95,915
APPLICATIONS DENIED
0
$0
16
$181,100
105
$218,849
19
$45,845
20
$157,850
4
$52,210
APPLICATIONS WITHDRAWN
0
$0
14
$181,129
64
$183,188
8
$78,032
2
$234,230
2
$88,930
FILES CLOSED FOR INCOMPLETENESS
0
$0
3
$273,807
22
$196,614
0
$0
2
$160,210
0
$0
Aggregated Statistics For Year 2005 (Based on 4 partial tracts)
B) Conventional Home Purchase Loans
C) Refinancings
D) Home Improvement Loans
F) Non-occupant Loans on < 5 Family Dwellings (A B C & D)
G) Loans On Manufactured Home Dwelling (A B C & D)
Number
Average Value
Number
Average Value
Number
Average Value
Number
Average Value
Number
Average Value
LOANS ORIGINATED
83
$219,401
152
$209,876
36
$64,718
39
$373,271
4
$33,408
APPLICATIONS APPROVED, NOT ACCEPTED
6
$226,565
22
$210,195
6
$38,952
2
$321,335
0
$0
APPLICATIONS DENIED
26
$157,763
91
$178,102
25
$76,736
18
$178,132
4
$110,038
APPLICATIONS WITHDRAWN
20
$138,576
108
$187,811
7
$134,060
15
$179,448
2
$75,840
FILES CLOSED FOR INCOMPLETENESS
4
$151,955
33
$178,665
2
$34,345
4
$167,135
0
$0
Aggregated Statistics For Year 2004 (Based on 4 partial tracts)
A) FHA, FSA/RHS & VA Home Purchase Loans
B) Conventional Home Purchase Loans
C) Refinancings
D) Home Improvement Loans
F) Non-occupant Loans on < 5 Family Dwellings (A B C & D)
G) Loans On Manufactured Home Dwelling (A B C & D)
Number
Average Value
Number
Average Value
Number
Average Value
Number
Average Value
Number
Average Value
Number
Average Value
LOANS ORIGINATED
2
$85,180
90
$210,990
120
$173,085
12
$42,469
35
$201,185
4
$25,922
APPLICATIONS APPROVED, NOT ACCEPTED
0
$0
13
$264,416
27
$176,843
2
$140,435
8
$133,439
0
$0
APPLICATIONS DENIED
0
$0
9
$169,790
81
$173,870
23
$72,258
16
$173,134
1
$101,110
APPLICATIONS WITHDRAWN
0
$0
7
$291,417
70
$162,147
11
$51,134
7
$207,379
2
$77,075
FILES CLOSED FOR INCOMPLETENESS
0
$0
3
$360,830
24
$161,598
0
$0
1
$87,910
0
$0
Aggregated Statistics For Year 2003 (Based on 4 partial tracts)
A) FHA, FSA/RHS & VA Home Purchase Loans
B) Conventional Home Purchase Loans
C) Refinancings
D) Home Improvement Loans
E) Loans on Dwellings For 5+ Families
F) Non-occupant Loans on < 5 Family Dwellings (A B C & D)
Number
Average Value
Number
Average Value
Number
Average Value
Number
Average Value
Number
Average Value
Number
Average Value
LOANS ORIGINATED
4
$174,865
56
$228,101
169
$160,486
16
$51,271
2
$113,045
33
$296,757
APPLICATIONS APPROVED, NOT ACCEPTED
0
$0
10
$215,918
39
$133,264
4
$20,590
0
$0
8
$179,105
APPLICATIONS DENIED
0
$0
18
$118,146
100
$136,126
10
$15,421
0
$0
14
$134,120
APPLICATIONS WITHDRAWN
0
$0
3
$183,777
93
$158,053
5
$95,554
0
$0
3
$138,737
FILES CLOSED FOR INCOMPLETENESS
0
$0
3
$695,967
16
$110,502
2
$217,400
0
$0
0
$0
Aggregated Statistics For Year 2002 (Based on 4 partial tracts)
A) FHA, FSA/RHS & VA Home Purchase Loans
B) Conventional Home Purchase Loans
C) Refinancings
D) Home Improvement Loans
F) Non-occupant Loans on < 5 Family Dwellings (A B C & D)
Number
Average Value
Number
Average Value
Number
Average Value
Number
Average Value
Number
Average Value
LOANS ORIGINATED
0
$0
47
$225,463
95
$163,957
5
$17,142
25
$191,547
APPLICATIONS APPROVED, NOT ACCEPTED
0
$0
4
$174,198
22
$232,184
2
$25,105
2
$63,790
APPLICATIONS DENIED
2
$139,595
25
$103,263
54
$156,406
10
$16,292
11
$154,743
APPLICATIONS WITHDRAWN
0
$0
9
$99,080
45
$140,152
3
$15,987
4
$166,485
FILES CLOSED FOR INCOMPLETENESS
0
$0
0
$0
14
$195,534
0
$0
0
$0
Aggregated Statistics For Year 2001 (Based on 4 partial tracts)
A) FHA, FSA/RHS & VA Home Purchase Loans
B) Conventional Home Purchase Loans
C) Refinancings
D) Home Improvement Loans
F) Non-occupant Loans on < 5 Family Dwellings (A B C & D)
Number
Average Value
Number
Average Value
Number
Average Value
Number
Average Value
Number
Average Value
LOANS ORIGINATED
4
$107,552
37
$134,562
65
$143,316
10
$33,985
19
$167,990
APPLICATIONS APPROVED, NOT ACCEPTED
0
$0
5
$142,726
17
$119,417
4
$27,672
4
$85,738
APPLICATIONS DENIED
3
$114,757
12
$138,974
31
$104,252
7
$25,419
7
$105,584
APPLICATIONS WITHDRAWN
2
$67,655
8
$158,731
48
$130,760
4
$40,855
2
$353,150
FILES CLOSED FOR INCOMPLETENESS
2
$70,225
0
$0
17
$169,500
2
$25,690
0
$0
Aggregated Statistics For Year 2000 (Based on 4 partial tracts)
A) FHA, FSA/RHS & VA Home Purchase Loans
B) Conventional Home Purchase Loans
C) Refinancings
D) Home Improvement Loans
F) Non-occupant Loans on < 5 Family Dwellings (A B C & D)
Number
Average Value
Number
Average Value
Number
Average Value
Number
Average Value
Number
Average Value
LOANS ORIGINATED
3
$95,443
49
$119,361
34
$92,864
9
$7,546
12
$129,601
APPLICATIONS APPROVED, NOT ACCEPTED
0
$0
9
$119,413
7
$134,766
9
$30,876
3
$194,687
APPLICATIONS DENIED
3
$139,880
17
$95,339
20
$83,220
9
$17,606
5
$82,214
APPLICATIONS WITHDRAWN
0
$0
8
$142,214
17
$81,362
0
$0
2
$71,080
FILES CLOSED FOR INCOMPLETENESS
0
$0
2
$71,080
40
$93,302
0
$0
2
$34,255
Aggregated Statistics For Year 1999 (Based on 2 partial tracts)
A) FHA, FSA/RHS & VA Home Purchase Loans
B) Conventional Home Purchase Loans
C) Refinancings
D) Home Improvement Loans
F) Non-occupant Loans on < 5 Family Dwellings (A B C & D)
Detailed PMIC statistics for the following Tracts:1000.00
, 1200.00
2002 - 2018 National Fire Incident Reporting System (NFIRS) incidents
Based on the data from the years 2002 - 2018 the average number of fires per year is 17. The highest number of fires - 46 took place in 2006, and the least - 1 in 2003. The data has a dropping trend.
When looking into fire subcategories, the most incidents belonged to: Structure Fires (38.0%), and Outside Fires (33.1%).
Fire incident types reported to NFIRS in Zip Code 12546


 Nearest zip codes: 06039, 12501, 12503, 06069, 06068, 12567.


 Based on the data from the years 2002 - 2018 the average number of fires per year is 17. The highest number of fires - 46 took place in 2006, and the least - 1 in 2003. The data has a dropping trend.
 When looking into fire subcategories, the most incidents belonged to: Structure Fires (38.0%), and Outside Fires (33.1%).