Estimated zip code population in 2022: 1,558 Zip code population in 2010: 2,258 Zip code population in 2000: 2,089
Houses and condos: 484 Renter-occupied apartments: 61
% of renters here:
13%
State:
46%
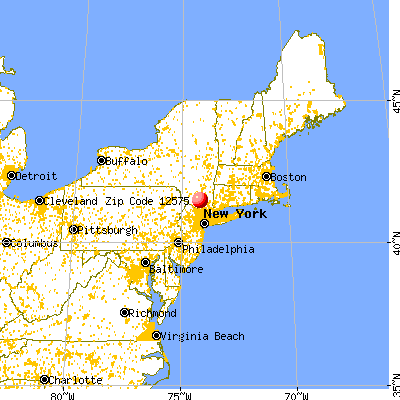
March 2022 cost of living index in zip code 12575: 128.4 (high, U.S. average is 100)
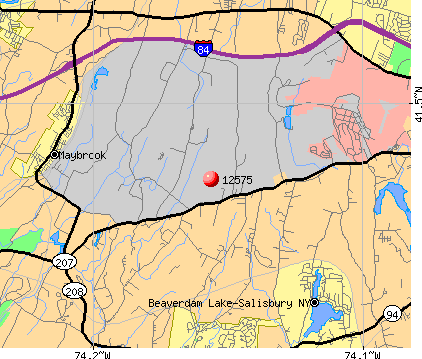
Land area: 9.9 sq. mi. Water area: 0.2 sq. mi.
Population density: 157 people per square mile
(very low).
OSM Map
General Map
Google Map
MSN Map
OSM Map
General Map
Google Map
MSN Map
OSM Map
General Map
Google Map
MSN Map
OSM Map
General Map
Google Map
MSN Map
Please wait while loading the map...
Real estate property taxes paid for housing units in 2022:
This zip code:
2.0% ($8,601)
New York:
1.5% ($6,180)
Median real estate property taxes paid for housing units with mortgages in 2022: $8,973 (2.1%) Median real estate property taxes paid for housing units with no mortgage in 2022: $7,795 (1.9%)
Business Search- 14 Million verified businesses
Males: 897
(57.6%)
Females: 661
(42.4%)
For population 25 years and over in 12575:
High school or higher: 88.7%
Bachelor's degree or higher: 39.6%
Graduate or professional degree: 12.7%
Unemployed: 1.6%
Mean travel time to work (commute): 37.3 minutes
For population 15 years and over in 12575:
Never married: 37.0%
Now married: 58.6%
Separated: 0.0%
Widowed: 1.8%
Divorced: 2.6%
Zip code 12575 compared to state average:
Median household income above state average.
Unemployed percentage significantly below state average.
Black race population percentage significantly below state average.
Foreign-born population percentage below state average.
Renting percentage significantly below state average.
Length of stay since moving in above state average.
Estimated median house/condo value in 2022: $423,125
12575:
$423,125
New York:
$400,400
According to our research of New York and other state lists, there were 2 registered sex offenders living in 12575 zip code as of May 28, 2024. The ratio of all residents to sex offenders in zip code 12575 is 956 to 1. The ratio of registered sex offenders to all residents in this zip code is near the state average.
Median resident age:
This zip code:
42.0 years
New York median age:
40.0 years
Average household size:
This zip code:
3.2 people
New York:
2.5 people
Averages for the 2020 tax year for zip code 12575, filed in 2021:
Average Adjusted Gross Income (AGI) in 2020: $91,773 (Individual Income Tax Returns)
Here:
$91,773
State:
$90,930
Salary/wage: $81,822 (reported on 82.8% of returns)
Here:
$81,822
State:
$72,104
(% of AGI for various income ranges: 1062.9% for AGIs below $25k, 3364.1% for AGIs $25k-50k, 6327.0% for AGIs $50k-75k, 8900.0% for AGIs $75k-100k, 17328.5% for AGIs $100k-200k, 48160.0% for AGIs over 200k)
Taxable interest for individuals: $870 (reported on 44.5% of returns)
This zip code:
$870
New York:
$3,075
(% of AGI for various income ranges: 21.9% for AGIs below $25k, 37.6% for AGIs $25k-50k, 24.0% for AGIs $50k-75k, 54.0% for AGIs $75k-100k, 86.0% for AGIs $100k-200k, 226.7% for AGIs over 200k)
Ordinary dividends: $2,797 (reported on 23.4% of returns)
Here:
$2,797
State:
$11,095
(% of AGI for various income ranges: 17.6% for AGIs below $25k, 64.7% for AGIs $25k-50k, 40.0% for AGIs $50k-75k, 41.0% for AGIs $75k-100k, 98.0% for AGIs $100k-200k, 691.7% for AGIs over 200k)
Net capital gain/loss in AGI: +$6,875 (reported on 21.9% of returns)
Here:
+$6,875
State:
+$44,925
(% of AGI for various income ranges: 27.1% for AGIs below $25k, 68.2% for AGIs $25k-50k, 46.0% for AGIs $50k-75k, 39.0% for AGIs $75k-100k, 250.0% for AGIs $100k-200k, 1945.0% for AGIs over 200k)
Profit/loss from business: +$11,700 (reported on 14.1% of returns)
Here:
+$11,700
State:
+$14,940
(% of AGI for various income ranges: 93.3% for AGIs below $25k, 114.7% for AGIs $25k-50k, 289.0% for AGIs $50k-75k, 286.5% for AGIs $100k-200k, 1421.7% for AGIs over 200k)
Taxable individual retirement arrangement distribution: $22,246 (reported on 10.2% of returns)
12575:
$22,246
New York:
$19,609
(% of AGI for various income ranges: 206.5% for AGIs $25k-50k, 436.0% for AGIs $50k-75k, 588.0% for AGIs $100k-200k, 1548.3% for AGIs over 200k)
Total itemized deductions: $26,176 (reported on 16.4% of returns)
Here:
$26,176
State:
$39,326
(% of AGI for various income ranges: 662.0% for AGIs $50k-75k, 1030.0% for AGIs $75k-100k, 1063.5% for AGIs $100k-200k, 2796.7% for AGIs over 200k)
Charity contributions: $4,994 (reported on 13.3% of returns)
Here:
$4,994
State:
$15,420
(% of AGI for various income ranges: 34.1% for AGIs $25k-50k, 59.0% for AGIs $75k-100k, 201.5% for AGIs $100k-200k, 548.3% for AGIs over 200k)
Taxes paid: $9,243 (reported on 16.4% of returns)
12575:
$9,243
State:
$9,183
(% of AGI for various income ranges: 288.0% for AGIs $50k-75k, 330.0% for AGIs $75k-100k, 385.0% for AGIs $100k-200k, 921.7% for AGIs over 200k)
Earned income credit: $1,450 (reported on 6.2% of returns)
Here:
$1,450
State:
$2,138
(% of AGI for various income ranges: 23.8% for AGIs below $25k, 38.8% for AGIs $25k-50k)
Percentage of individuals using paid preparers for their 2020 taxes: 96.1%
Here:
96%
State:
95%
(% for various income ranges: 93.5% for AGIs below $25k, 91.7% for AGIs $25k-50k, 100.0% for AGIs $50k-75k, 100.0% for AGIs $75k-100k, 96.9% for AGIs $100k-200k, 100.0% for AGIs over 200k)
Averages for the 2012 tax year for zip code 12575, filed in 2013:
Average Adjusted Gross Income (AGI) in 2012: $74,704 (Individual Income Tax Returns)
Here:
$74,704
State:
$77,088
Salary/wage: $68,453 (reported on 86.6% of returns)
Here:
$68,453
State:
$60,593
(% of AGI for various income ranges: 73.7% for AGIs below $25k, 70.5% for AGIs $25k-50k, 83.7% for AGIs $50k-75k, 77.1% for AGIs $75k-100k, 82.5% for AGIs $100k-200k, 77.3% for AGIs over 200k)
Taxable interest for individuals: $539 (reported on 48.2% of returns)
This zip code:
$539
New York:
$3,125
(% of AGI for various income ranges: 0.9% for AGIs below $25k, 0.6% for AGIs $25k-50k, 0.2% for AGIs $50k-75k, 0.2% for AGIs $75k-100k, 0.2% for AGIs $100k-200k, 0.6% for AGIs over 200k)
Ordinary dividends: $1,222 (reported on 24.1% of returns)
Here:
$1,222
State:
$10,299
(% of AGI for various income ranges: 1.6% for AGIs below $25k, 1.0% for AGIs $25k-50k, 0.2% for AGIs $50k-75k, 0.2% for AGIs $75k-100k, 0.3% for AGIs $100k-200k, 0.3% for AGIs over 200k)
Net capital gain/loss in AGI: +$1,656 (reported on 16.1% of returns)
Here:
+$1,656
State:
+$42,474
(% of AGI for various income ranges: 0.1% for AGIs $100k-200k, 1.5% for AGIs over 200k)
Profit/loss from business: +$8,267 (reported on 13.4% of returns)
Here:
+$8,267
State:
+$16,168
(% of AGI for various income ranges: 3.8% for AGIs below $25k, 3.1% for AGIs $25k-50k, 2.5% for AGIs $50k-75k, 1.9% for AGIs $100k-200k)
Taxable individual retirement arrangement distribution: $13,592 (reported on 10.7% of returns)
12575:
$13,592
New York:
$17,621
(% of AGI for various income ranges: 3.4% for AGIs below $25k, 3.4% for AGIs $25k-50k, 6.3% for AGIs $50k-75k, 2.1% for AGIs $100k-200k)
Total itemized deductions: $27,277 (23% of AGI, reported on 50.9% of returns)
Here:
$27,277
State:
$34,985
Here:
23.0% of AGI
State:
21.3% of AGI
(% of AGI for various income ranges: 14.9% for AGIs below $25k, 13.6% for AGIs $25k-50k, 19.0% for AGIs $50k-75k, 20.4% for AGIs $75k-100k, 20.9% for AGIs $100k-200k, 15.7% for AGIs over 200k)
Charity contributions: $2,408 (reported on 46.4% of returns)
Here:
$2,408
State:
$5,572
(% of AGI for various income ranges: 1.7% for AGIs $25k-50k, 1.3% for AGIs $50k-75k, 1.4% for AGIs $75k-100k, 1.8% for AGIs $100k-200k, 1.4% for AGIs over 200k)
Taxes paid: $14,026 (reported on 50.9% of returns)
12575:
$14,026
State:
$18,656
(% of AGI for various income ranges: 5.3% for AGIs below $25k, 5.4% for AGIs $25k-50k, 9.2% for AGIs $50k-75k, 9.8% for AGIs $75k-100k, 10.7% for AGIs $100k-200k, 9.8% for AGIs over 200k)
Earned income credit: $1,771 (reported on 6.2% of returns)
Here:
$1,771
State:
$2,230
(% of AGI for various income ranges: 2.1% for AGIs below $25k, 0.6% for AGIs $25k-50k)
Percentage of individuals using paid preparers for their 2012 taxes: 65.2%
Here:
65%
State:
66%
(% for various income ranges: 52.9% for AGIs below $25k, 68.4% for AGIs $25k-50k, 66.7% for AGIs $50k-75k, 69.2% for AGIs $75k-100k, 72.0% for AGIs $100k-200k, 83.3% for AGIs over 200k)
Averages for the 2004 tax year for zip code 12575, filed in 2005:
Average Adjusted Gross Income (AGI) in 2004: $64,685 (Individual Income Tax Returns)
Here:
$64,685
State:
$59,519
Salary/wage: $57,423 (reported on 88.9% of returns)
Here:
$57,423
State:
$50,673
(% of AGI for various income ranges: 122.1% for AGIs below $10k, 71.4% for AGIs $10k-25k, 84.0% for AGIs $25k-50k, 79.9% for AGIs $50k-75k, 85.6% for AGIs $75k-100k, 75.7% for AGIs over 100k)
Taxable interest for individuals: $734 (reported on 62.0% of returns)
This zip code:
$734
New York:
$2,377
(% of AGI for various income ranges: 6.5% for AGIs below $10k, 1.2% for AGIs $10k-25k, 1.2% for AGIs $25k-50k, 0.6% for AGIs $50k-75k, 0.9% for AGIs $75k-100k, 0.4% for AGIs over 100k)
Taxable dividends: $894 (reported on 31.8% of returns)
Here:
$894
State:
$5,394
(% of AGI for various income ranges: 2.0% for AGIs below $10k, 1.2% for AGIs $10k-25k, 0.5% for AGIs $25k-50k, 0.4% for AGIs $50k-75k, 0.2% for AGIs $75k-100k, 0.4% for AGIs over 100k)
Net capital gain/loss: +$2,183 (reported on 23.7% of returns)
Here:
+$2,183
State:
+$23,581
(% of AGI for various income ranges: -5.8% for AGIs below $10k, -0.7% for AGIs $10k-25k, 0.1% for AGIs $25k-50k, -0.1% for AGIs $50k-75k, -0.2% for AGIs $75k-100k, 1.7% for AGIs over 100k)
Profit/loss from business: +$6,274 (reported on 13.4% of returns)
Here:
+$6,274
State:
+$13,809
(% of AGI for various income ranges: 5.0% for AGIs $10k-25k, 0.3% for AGIs $25k-50k, 1.7% for AGIs $50k-75k, 3.5% for AGIs $75k-100k, 0.5% for AGIs over 100k)
IRA payment deduction: $2,950 (reported on 2.0% of returns)
12575:
$2,950
New York:
$3,115
Total itemized deductions: $23,813 (24% of AGI, reported on 53.5% of returns)
Here:
$23,813
State:
$25,864
Here:
23.8% of AGI
State:
21.9% of AGI
(% of AGI for various income ranges: 22.7% for AGIs $10k-25k, 17.7% for AGIs $25k-50k, 23.9% for AGIs $50k-75k, 23.6% for AGIs $75k-100k, 18.0% for AGIs over 100k)
Charity contributions deductions: $2,323 (2% of AGI, reported on 50.5% of returns)
Here:
$2,323
State:
$4,439
Here:
2.3% of AGI
State:
3.6% of AGI
(% of AGI for various income ranges: 1.7% for AGIs $10k-25k, 1.4% for AGIs $25k-50k, 2.1% for AGIs $50k-75k, 2.1% for AGIs $75k-100k, 1.8% for AGIs over 100k)
Total tax: $10,274 (reported on 78.8% of returns)
12575:
$10,274
State:
$11,730
(% of AGI for various income ranges: 2.4% for AGIs below $10k, 4.7% for AGIs $10k-25k, 6.9% for AGIs $25k-50k, 7.6% for AGIs $50k-75k, 8.8% for AGIs $75k-100k, 16.8% for AGIs over 100k)
Earned income credit: $1,411 (reported on 5.5% of returns)
Here:
$1,411
State:
$1,757
Percentage of individuals using paid preparers for their 2004 taxes: 69.6%
Here:
70%
State:
67%
(% for various income ranges: 58.9% for AGIs below $10k, 67.3% for AGIs $10k-25k, 66.7% for AGIs $25k-50k, 70.2% for AGIs $50k-75k, 76.1% for AGIs $75k-100k, 79.4% for AGIs over 100k)
Household received Food Stamps/SNAP in the past 12 months: 51 Household did not receive Food Stamps/SNAP in the past 12 months: 423
Women who had a birth in the past 12 months: 24 (24 now married, 0 unmarried) Women who did not have a birth in the past 12 months: 313 (173 now married, 138 unmarried)
Housing units in zip code 12575 with a mortgage: 274 (4 second mortgage, 4 both second mortgage and home equity loan) Houses without a mortgage: 6
Median monthly owner costs for units with a mortgage: $2,899 Median monthly owner costs for units without a mortgage: $1,378
Residents with income below the poverty level in 2022:
This zip code:
8.3%
Whole state:
14.3%
Residents with income below 50% of the poverty level in 2022:
This zip code:
7.7%
Whole state:
6.8%
Median number of rooms in houses and condos:
Here:
7.6
State:
6.3
Notable locations in this zip code not listed on our city pages
Churches in zip code 12575 include: Unitarian Universalist Congregation at Rock Tavern (A), Westminster Presbyterian Church (B). Display/hide their locations on the map
In group quarters: 7 (-1 institutionalized population)
Size of family households: 94 2-persons, 26 3-persons, 238 4-persons, 18 5-persons, 10 6-persons
Size of nonfamily households: 77 1-person
226 married couples with children.
50 single-parent households (50 women).
75.6% of residents of 12575 zip code speak English at home.
19.0% of residents speak Spanish at home (93% very well, 6% well, 1% not well).
3.9% of residents speak other Indo-European language at home (67% very well, 33% well).
Foreign born population: 201 (12.9%) (28.6% of them are naturalized citizens)
This zip code:
12.9%
Whole state:
22.7%
75%Honduras
17%Greece
13%Latvia
19%Italian
11%European
10%American
4%English
2%Dutch
1%Polish
1%West Indian
Year of entry for the foreign-born population
362010 or later
292000 to 2009
1381990 to 1999
48Before 1990
Facilities with environmental interests located in this zip code:
ADESA IMPACT (39 STONE CASTLE RD in ROCK TAVERN, NY)
Small Quantity Generators, between 100 kg and 1000 kg of hazardous waste/month (Resource Conservation and Recovery Act (tracking hazardous waste)) - notification Organizations: DANIEL WAGNER (CONTACT/OWNER)
, ROBERT P LYONS JR (CONTACT/OWNER)
Alternative names: AUTO PLACEMENT CENTER INC, PENSKE TRUCK LEASING CO LP
65.0%Fuel oil, kerosene, etc.
12.9%Wood
9.9%Utility gas
7.7%Bottled, tank, or LP gas
5.0%Electricity
Population in 1990: 2,202.
Place of birth for U.S.-born residents:
This state: 1,028
Northeast: 193
South: 71
69% of the 12575 zip code residents lived in the same house 5 years ago. Out of people who lived in different houses, 36% lived in this county. Out of people who lived in different counties, 50% lived in New York.
98% of the 12575 zip code residents lived in the same house 1 year ago. Out of people who lived in different houses, 104% moved from different state.
Private vs. public school enrollment:
Students in private schools in grades 1 to 8 (elementary and middle school): 20
Here:
34.4%
New York:
15.6%
Students in private schools in grades 9 to 12 (high school): 46
Here:
32.2%
New York:
15.0%
Students in private undergraduate colleges: 48
Here:
34.4%
New York:
39.2%
Occupation by median earnings in the past 12 months ($)
118,585Law enforcement workers including supervisors
90,336Health diagnosing and treating practitioners and other technical occupations
67,511Management occupations
65,290Education, training, and library occupations
45,320Transportation occupations
38,896Office and administrative support occupations
Companies with federal contracts located in this zip code:
FORMULA EQUIPMENT INC (165 STONE CASTLE RD in ROCK TAVERN, NY; small business) : $92,842 in 4 contractsfrom 2001 to 2006
$42,492 with Army for Lease or Rental of Equipment -- Tractors. Signed on 2006-04-10. Completion date: 2005-10-01.
$29,450 with Army for Earth Moving and Excavating Equipment. Signed on 2001-06-13. Completion date: 2001-08-01.
$20,900 with Army for Lease or Rental of Equipment -- Tractors. Signed on 2005-08-09. Completion date: 2005-10-01.
$0, same as above.Signed on 2006-04-10. Completion date: 2005-10-01.
J F MESSINA CHIMNEY BLDS,INC (291 BEATTIE R D in ROCK TAVERN, NY; small business)
$3,500 with Army for Maintenance, Repair or Alteration of Real Property -- Family Housing Facilities. Signed on 2003-09-22. Completion date: 2003-10-15.
Top industries in this zip code by the number of employees in 2005:
Real Estate and Rental and Leasing: Construction, Mining, and Forestry Machinery and Equipment Rental and Leasing (50-99 employees: 1 establishment, 1-4 employees: 1 establishment)
Construction: Plumbing, Heating, and Air-Conditioning Contractors (20-49: 1, 1-4: 3)
Administrative and Support and Waste Management and Remediation Services: Armored Car Services (20-49: 1)
Real Estate and Rental and Leasing: Truck, Utility Trailer, and RV (Recreational Vehicle) Rental and Leasing (20-49: 1)
People in group quarters in 2010:
6 people in group homes intended for adults
Fatal accident statistics in 2013:
Fatal accident count: 1
Vehicles involved in fatal accidents: 2
Fatal accidents caused by drunken drivers: 1
Fatalities: 1
Persons involved in fatal accidents: 2
Pedestrians involved in fatal accidents: 0
Fatal accident statistics in 2011:
Fatal accident count: 1
Vehicles involved in fatal accidents: 1
Fatal accidents caused by drunken drivers: 0
Fatalities: 1
Persons involved in fatal accidents: 1
Pedestrians involved in fatal accidents: 0
Home Mortgage Disclosure Act Aggregated Statistics For Year 2009 (Based on 4 partial tracts)
A) FHA, FSA/RHS & VA Home Purchase Loans
B) Conventional Home Purchase Loans
C) Refinancings
D) Home Improvement Loans
E) Loans on Dwellings For 5+ Families
F) Non-occupant Loans on < 5 Family Dwellings (A B C & D)
G) Loans On Manufactured Home Dwelling (A B C & D)
Number
Average Value
Number
Average Value
Number
Average Value
Number
Average Value
Number
Average Value
Number
Average Value
Number
Average Value
LOANS ORIGINATED
19
$273,269
43
$230,898
90
$226,823
4
$100,282
1
$3,651,060
1
$286,820
2
$48,840
APPLICATIONS APPROVED, NOT ACCEPTED
1
$128,170
3
$240,453
6
$332,198
1
$27,710
0
$0
0
$0
1
$41,570
APPLICATIONS DENIED
5
$178,050
9
$186,277
49
$275,948
6
$122,742
0
$0
1
$103,920
3
$73,900
APPLICATIONS WITHDRAWN
6
$282,200
7
$294,720
36
$270,587
1
$193,290
0
$0
0
$0
0
$0
FILES CLOSED FOR INCOMPLETENESS
0
$0
1
$114,310
6
$330,927
0
$0
0
$0
0
$0
0
$0
Aggregated Statistics For Year 2008 (Based on 4 partial tracts)
A) FHA, FSA/RHS & VA Home Purchase Loans
B) Conventional Home Purchase Loans
C) Refinancings
D) Home Improvement Loans
F) Non-occupant Loans on < 5 Family Dwellings (A B C & D)
G) Loans On Manufactured Home Dwelling (A B C & D)
Number
Average Value
Number
Average Value
Number
Average Value
Number
Average Value
Number
Average Value
Number
Average Value
LOANS ORIGINATED
6
$341,203
61
$284,649
47
$215,859
11
$81,625
4
$312,428
4
$59,060
APPLICATIONS APPROVED, NOT ACCEPTED
1
$171,810
7
$263,897
12
$288,614
4
$62,525
1
$198,140
2
$84,175
APPLICATIONS DENIED
3
$262,340
18
$219,309
60
$244,398
14
$100,456
2
$225,935
7
$47,903
APPLICATIONS WITHDRAWN
4
$296,692
17
$295,364
40
$242,805
6
$172,277
3
$241,900
1
$131,630
FILES CLOSED FOR INCOMPLETENESS
0
$0
1
$550,780
12
$238,329
1
$112,930
0
$0
0
$0
Aggregated Statistics For Year 2007 (Based on 4 partial tracts)
A) FHA, FSA/RHS & VA Home Purchase Loans
B) Conventional Home Purchase Loans
C) Refinancings
D) Home Improvement Loans
F) Non-occupant Loans on < 5 Family Dwellings (A B C & D)
G) Loans On Manufactured Home Dwelling (A B C & D)
Number
Average Value
Number
Average Value
Number
Average Value
Number
Average Value
Number
Average Value
Number
Average Value
LOANS ORIGINATED
1
$387,970
75
$266,122
83
$228,298
29
$70,539
3
$241,093
7
$35,234
APPLICATIONS APPROVED, NOT ACCEPTED
0
$0
16
$222,129
21
$277,846
6
$52,537
2
$439,930
3
$35,103
APPLICATIONS DENIED
3
$179,203
17
$236,041
92
$282,218
27
$79,569
3
$181,513
5
$42,954
APPLICATIONS WITHDRAWN
1
$260,490
10
$249,131
44
$237,142
8
$152,676
0
$0
1
$47,110
FILES CLOSED FOR INCOMPLETENESS
0
$0
3
$391,663
12
$311,182
1
$55,420
0
$0
1
$59,580
Aggregated Statistics For Year 2006 (Based on 4 partial tracts)
A) FHA, FSA/RHS & VA Home Purchase Loans
B) Conventional Home Purchase Loans
C) Refinancings
D) Home Improvement Loans
F) Non-occupant Loans on < 5 Family Dwellings (A B C & D)
G) Loans On Manufactured Home Dwelling (A B C & D)
Number
Average Value
Number
Average Value
Number
Average Value
Number
Average Value
Number
Average Value
Number
Average Value
LOANS ORIGINATED
1
$430,920
106
$245,175
109
$211,501
36
$96,379
6
$173,662
5
$79,534
APPLICATIONS APPROVED, NOT ACCEPTED
0
$0
13
$236,229
27
$194,429
10
$99,348
0
$0
0
$0
APPLICATIONS DENIED
0
$0
18
$183,893
87
$266,112
27
$93,784
2
$356,790
7
$56,513
APPLICATIONS WITHDRAWN
1
$257,720
14
$216,949
65
$231,433
8
$122,625
0
$0
1
$62,350
FILES CLOSED FOR INCOMPLETENESS
0
$0
6
$245,598
16
$309,798
1
$46,420
0
$0
1
$15,930
Aggregated Statistics For Year 2005 (Based on 4 partial tracts)
A) FHA, FSA/RHS & VA Home Purchase Loans
B) Conventional Home Purchase Loans
C) Refinancings
D) Home Improvement Loans
F) Non-occupant Loans on < 5 Family Dwellings (A B C & D)
G) Loans On Manufactured Home Dwelling (A B C & D)
Number
Average Value
Number
Average Value
Number
Average Value
Number
Average Value
Number
Average Value
Number
Average Value
LOANS ORIGINATED
2
$336,010
114
$246,911
133
$211,249
27
$71,442
6
$150,222
3
$81,980
APPLICATIONS APPROVED, NOT ACCEPTED
0
$0
23
$242,330
25
$221,343
6
$43,647
0
$0
7
$71,656
APPLICATIONS DENIED
1
$308,300
25
$186,126
82
$247,245
25
$94,655
2
$268,115
11
$71,763
APPLICATIONS WITHDRAWN
1
$191,910
18
$229,475
72
$244,058
8
$190,694
3
$225,390
1
$55,420
FILES CLOSED FOR INCOMPLETENESS
0
$0
3
$208,763
11
$300,297
3
$114,313
1
$59,580
1
$69,280
Aggregated Statistics For Year 2004 (Based on 4 partial tracts)
A) FHA, FSA/RHS & VA Home Purchase Loans
B) Conventional Home Purchase Loans
C) Refinancings
D) Home Improvement Loans
E) Loans on Dwellings For 5+ Families
F) Non-occupant Loans on < 5 Family Dwellings (A B C & D)
G) Loans On Manufactured Home Dwelling (A B C & D)
Number
Average Value
Number
Average Value
Number
Average Value
Number
Average Value
Number
Average Value
Number
Average Value
Number
Average Value
LOANS ORIGINATED
1
$126,780
133
$236,182
135
$204,845
23
$91,811
0
$0
3
$271,810
16
$65,740
APPLICATIONS APPROVED, NOT ACCEPTED
0
$0
32
$256,997
27
$186,384
10
$66,578
1
$187,750
0
$0
9
$45,262
APPLICATIONS DENIED
0
$0
26
$163,670
62
$227,627
19
$87,475
0
$0
1
$286,820
12
$46,533
APPLICATIONS WITHDRAWN
0
$0
12
$184,678
70
$216,994
9
$68,126
0
$0
0
$0
1
$65,120
FILES CLOSED FOR INCOMPLETENESS
1
$218,920
7
$249,704
15
$211,798
3
$25,403
0
$0
1
$103,920
0
$0
Aggregated Statistics For Year 2003 (Based on 4 partial tracts)
A) FHA, FSA/RHS & VA Home Purchase Loans
B) Conventional Home Purchase Loans
C) Refinancings
D) Home Improvement Loans
F) Non-occupant Loans on < 5 Family Dwellings (A B C & D)
Number
Average Value
Number
Average Value
Number
Average Value
Number
Average Value
Number
Average Value
LOANS ORIGINATED
1
$122,630
94
$213,409
234
$175,666
14
$37,708
4
$108,025
APPLICATIONS APPROVED, NOT ACCEPTED
0
$0
14
$223,329
40
$172,722
5
$28,422
0
$0
APPLICATIONS DENIED
1
$156,570
28
$102,876
83
$176,690
14
$32,088
1
$38,100
APPLICATIONS WITHDRAWN
1
$246,640
8
$219,358
63
$167,918
3
$44,570
1
$162,120
FILES CLOSED FOR INCOMPLETENESS
0
$0
3
$223,313
12
$172,282
0
$0
0
$0
Aggregated Statistics For Year 2002 (Based on 4 partial tracts)
A) FHA, FSA/RHS & VA Home Purchase Loans
B) Conventional Home Purchase Loans
C) Refinancings
D) Home Improvement Loans
F) Non-occupant Loans on < 5 Family Dwellings (A B C & D)
Number
Average Value
Number
Average Value
Number
Average Value
Number
Average Value
Number
Average Value
LOANS ORIGINATED
3
$130,243
80
$177,026
137
$142,450
14
$32,095
3
$132,787
APPLICATIONS APPROVED, NOT ACCEPTED
0
$0
10
$157,958
30
$138,398
10
$56,186
1
$83,140
APPLICATIONS DENIED
0
$0
26
$89,638
56
$140,311
18
$28,069
1
$96,990
APPLICATIONS WITHDRAWN
1
$135,100
7
$172,507
47
$151,242
8
$31,522
0
$0
FILES CLOSED FOR INCOMPLETENESS
0
$0
2
$172,160
14
$136,926
1
$27,710
0
$0
Aggregated Statistics For Year 2001 (Based on 4 partial tracts)
A) FHA, FSA/RHS & VA Home Purchase Loans
B) Conventional Home Purchase Loans
C) Refinancings
D) Home Improvement Loans
F) Non-occupant Loans on < 5 Family Dwellings (A B C & D)
Number
Average Value
Number
Average Value
Number
Average Value
Number
Average Value
Number
Average Value
LOANS ORIGINATED
4
$127,130
83
$162,585
98
$128,360
13
$20,258
4
$216,848
APPLICATIONS APPROVED, NOT ACCEPTED
0
$0
11
$125,460
18
$93,567
8
$31,695
0
$0
APPLICATIONS DENIED
1
$95,610
21
$82,508
55
$110,171
15
$21,701
1
$90,060
APPLICATIONS WITHDRAWN
1
$234,170
13
$154,619
39
$125,468
9
$24,676
1
$48,500
FILES CLOSED FOR INCOMPLETENESS
0
$0
0
$0
10
$146,389
0
$0
0
$0
Aggregated Statistics For Year 2000 (Based on 4 partial tracts)
A) FHA, FSA/RHS & VA Home Purchase Loans
B) Conventional Home Purchase Loans
C) Refinancings
D) Home Improvement Loans
E) Loans on Dwellings For 5+ Families
F) Non-occupant Loans on < 5 Family Dwellings (A B C & D)
Number
Average Value
Number
Average Value
Number
Average Value
Number
Average Value
Number
Average Value
Number
Average Value
LOANS ORIGINATED
4
$163,250
79
$138,334
33
$82,562
22
$21,081
1
$77,590
3
$69,743
APPLICATIONS APPROVED, NOT ACCEPTED
1
$160,320
8
$126,372
8
$65,962
6
$30,022
0
$0
0
$0
APPLICATIONS DENIED
1
$100,460
13
$61,652
38
$83,995
11
$48,712
0
$0
2
$53,440
APPLICATIONS WITHDRAWN
1
$215,460
6
$129,250
31
$74,454
1
$78,980
0
$0
0
$0
FILES CLOSED FOR INCOMPLETENESS
0
$0
1
$65,820
7
$139,803
1
$10,390
0
$0
0
$0
Aggregated Statistics For Year 1999 (Based on 2 partial tracts)
A) FHA, FSA/RHS & VA Home Purchase Loans
B) Conventional Home Purchase Loans
C) Refinancings
D) Home Improvement Loans
F) Non-occupant Loans on < 5 Family Dwellings (A B C & D)


 Nearest zip codes: 12543, 10992, 10914, 12577, 10916, 12586.


