Estimated zip code population in 2022: 1,070 Zip code population in 2010: 894 Zip code population in 2000: 735
Houses and condos: 1,024 Renter-occupied apartments: 37
% of renters here:
8%
State:
46%
March 2022 cost of living index in zip code 12824: 94.0 (less than average, U.S. average is 100)
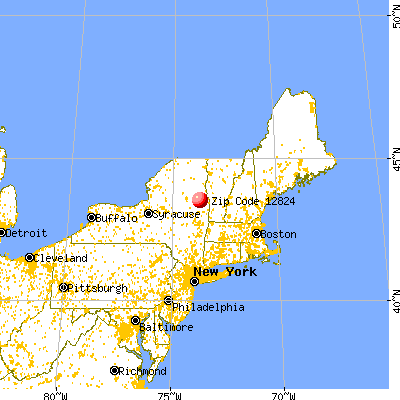
Land area: 15.2 sq. mi. Water area: 0.5 sq. mi.
Population density: 71 people per square mile
(very low).
OSM Map
General Map
Google Map
MSN Map
OSM Map
General Map
Google Map
MSN Map
OSM Map
General Map
Google Map
MSN Map
OSM Map
General Map
Google Map
MSN Map
Please wait while loading the map...
Real estate property taxes paid for housing units in 2022:
This zip code:
1.1% ($3,823)
New York:
1.5% ($6,180)
Median real estate property taxes paid for housing units with mortgages in 2022: $3,121 (0.9%) Median real estate property taxes paid for housing units with no mortgage in 2022: $4,348 (1.2%)
Business Search- 14 Million verified businesses
Males: 558
(52.1%)
Females: 512
(47.9%)
For population 25 years and over in 12824:
High school or higher: 93.6%
Bachelor's degree or higher: 43.3%
Graduate or professional degree: 22.0%
Unemployed: 3.5%
Mean travel time to work (commute): 32.7 minutes
For population 15 years and over in 12824:
Never married: 21.1%
Now married: 54.2%
Separated: 6.4%
Widowed: 5.6%
Divorced: 12.7%
Zip code 12824 compared to state average:
Black race population percentage significantly below state average.
Hispanic race population percentage significantly below state average.
Median age significantly above state average.
Foreign-born population percentage significantly below state average.
Renting percentage significantly below state average.
Length of stay since moving in above state average.
Estimated median house/condo value in 2022: $357,869
12824:
$357,869
New York:
$400,400
According to our research of New York and other state lists, there was 1 registered sex offender living in 12824 zip code as of May 28, 2024. The ratio of all residents to sex offenders in zip code 12824 is 1,181 to 1. The ratio of registered sex offenders to all residents in this zip code is lower than the state average.
Median resident age:
This zip code:
58.1 years
New York median age:
40.0 years
Average household size:
This zip code:
2.2 people
New York:
2.5 people
Averages for the 2020 tax year for zip code 12824, filed in 2021:
Average Adjusted Gross Income (AGI) in 2020: $99,544 (Individual Income Tax Returns)
Here:
$99,544
State:
$90,930
Salary/wage: $67,493 (reported on 70.7% of returns)
Here:
$67,493
State:
$72,104
(% of AGI for various income ranges: 1538.3% for AGIs below $25k, 2974.3% for AGIs $25k-50k, 5265.0% for AGIs $50k-75k, 9355.0% for AGIs $75k-100k, 13192.5% for AGIs $100k-200k)
Taxable interest for individuals: $1,468 (reported on 46.3% of returns)
This zip code:
$1,468
New York:
$3,075
(% of AGI for various income ranges: 6.7% for AGIs below $25k, 15.7% for AGIs $25k-50k, 150.0% for AGIs $50k-75k, 80.0% for AGIs $75k-100k, 235.0% for AGIs $100k-200k)
Ordinary dividends: $9,157 (reported on 34.1% of returns)
Here:
$9,157
State:
$11,095
(% of AGI for various income ranges: 210.0% for AGIs below $25k, 657.5% for AGIs $50k-75k, 1492.5% for AGIs $100k-200k)
Net capital gain/loss in AGI: +$10,433 (reported on 29.3% of returns)
Here:
+$10,433
State:
+$44,925
(% of AGI for various income ranges: 76.7% for AGIs below $25k, 392.5% for AGIs $50k-75k, 2622.5% for AGIs $100k-200k)
Profit/loss from business: +$14,014 (reported on 17.1% of returns)
Here:
+$14,014
State:
+$14,940
(% of AGI for various income ranges: 514.3% for AGIs $25k-50k, 1552.5% for AGIs $100k-200k)
Taxable individual retirement arrangement distribution: $24,680 (reported on 12.2% of returns)
12824:
$24,680
New York:
$19,609
(% of AGI for various income ranges: 264.3% for AGIs $25k-50k, 2622.5% for AGIs $100k-200k)
Total itemized deductions: $33,800 (reported on 9.8% of returns)
Here:
$33,800
State:
$39,326
(% of AGI for various income ranges: 3380.0% for AGIs $100k-200k)
Charity contributions: $5,525 (reported on 9.8% of returns)
Here:
$5,525
State:
$15,420
(% of AGI for various income ranges: 552.5% for AGIs $100k-200k)
Taxes paid: $9,150 (reported on 9.8% of returns)
12824:
$9,150
State:
$9,183
(% of AGI for various income ranges: 915.0% for AGIs $100k-200k)
Earned income credit: $1,800 (reported on 7.3% of returns)
Here:
$1,800
State:
$2,138
(% of AGI for various income ranges: 90.0% for AGIs below $25k)
Percentage of individuals using paid preparers for their 2020 taxes: 97.6%
Here:
98%
State:
95%
(% for various income ranges: 90.9% for AGIs below $25k, 100.0% for AGIs $25k-50k, 100.0% for AGIs $50k-75k, 100.0% for AGIs $75k-100k, 100.0% for AGIs $100k-200k, 100.0% for AGIs over 200k)
Averages for the 2012 tax year for zip code 12824, filed in 2013:
Average Adjusted Gross Income (AGI) in 2012: $69,335 (Individual Income Tax Returns)
Here:
$69,335
State:
$77,088
Salary/wage: $54,207 (reported on 75.0% of returns)
Here:
$54,207
State:
$60,593
(% of AGI for various income ranges: 70.8% for AGIs below $25k, 55.8% for AGIs $25k-50k, 62.0% for AGIs $50k-75k, 74.6% for AGIs $75k-100k, 53.6% for AGIs $100k-200k)
Taxable interest for individuals: $881 (reported on 40.0% of returns)
This zip code:
$881
New York:
$3,125
(% of AGI for various income ranges: 1.4% for AGIs below $25k, 0.3% for AGIs $25k-50k, 0.6% for AGIs $50k-75k, 0.2% for AGIs $75k-100k, 0.5% for AGIs $100k-200k)
Ordinary dividends: $7,669 (reported on 32.5% of returns)
Here:
$7,669
State:
$10,299
(% of AGI for various income ranges: 3.2% for AGIs below $25k, 2.6% for AGIs $25k-50k, 4.7% for AGIs $50k-75k, 4.3% for AGIs $100k-200k)
Net capital gain/loss in AGI: +$6,133 (reported on 22.5% of returns)
Here:
+$6,133
State:
+$42,474
(% of AGI for various income ranges: 0.3% for AGIs $50k-75k, 3.5% for AGIs $100k-200k)
Profit/loss from business: +$8,571 (reported on 17.5% of returns)
Here:
+$8,571
State:
+$16,168
Taxable individual retirement arrangement distribution: $10,620 (reported on 12.5% of returns)
12824:
$10,620
New York:
$17,621
Total itemized deductions: $29,464 (21% of AGI, reported on 35.0% of returns)
Here:
$29,464
State:
$34,985
Here:
21.4% of AGI
State:
21.3% of AGI
(% of AGI for various income ranges: 21.7% for AGIs $25k-50k, 13.6% for AGIs $50k-75k, 13.6% for AGIs $75k-100k, 16.1% for AGIs $100k-200k)
Charity contributions: $2,875 (reported on 30.0% of returns)
Here:
$2,875
State:
$5,572
(% of AGI for various income ranges: 1.4% for AGIs $25k-50k, 2.0% for AGIs $50k-75k, 1.4% for AGIs $100k-200k)
Taxes paid: $15,121 (reported on 35.0% of returns)
12824:
$15,121
State:
$18,656
(% of AGI for various income ranges: 7.6% for AGIs $25k-50k, 5.9% for AGIs $50k-75k, 5.9% for AGIs $75k-100k, 9.3% for AGIs $100k-200k)
Earned income credit: $1,960 (reported on 12.5% of returns)
Here:
$1,960
State:
$2,230
(% of AGI for various income ranges: 5.1% for AGIs below $25k)
Percentage of individuals using paid preparers for their 2012 taxes: 62.5%
Here:
62%
State:
66%
(% for various income ranges: 56.2% for AGIs below $25k, 57.1% for AGIs $25k-50k, 66.7% for AGIs $50k-75k, 75.0% for AGIs $75k-100k, 71.4% for AGIs $100k-200k)
Averages for the 2004 tax year for zip code 12824, filed in 2005:
Average Adjusted Gross Income (AGI) in 2004: $73,541 (Individual Income Tax Returns)
Here:
$73,541
State:
$59,519
Salary/wage: $47,421 (reported on 79.3% of returns)
Here:
$47,421
State:
$50,673
(% of AGI for various income ranges: 72.7% for AGIs $10k-25k, 61.6% for AGIs $25k-50k, 65.4% for AGIs $50k-75k, 57.7% for AGIs $75k-100k, 41.3% for AGIs over 100k)
Taxable interest for individuals: $4,048 (reported on 59.1% of returns)
This zip code:
$4,048
New York:
$2,377
(% of AGI for various income ranges: 3.9% for AGIs $10k-25k, 0.8% for AGIs $25k-50k, 1.0% for AGIs $50k-75k, 2.5% for AGIs $75k-100k, 4.1% for AGIs over 100k)
Taxable dividends: $4,571 (reported on 38.4% of returns)
Here:
$4,571
State:
$5,394
(% of AGI for various income ranges: 2.6% for AGIs $10k-25k, 2.1% for AGIs $25k-50k, 1.4% for AGIs $50k-75k, 1.4% for AGIs $75k-100k, 2.7% for AGIs over 100k)
Net capital gain/loss: +$64,383 (reported on 31.3% of returns)
Here:
+$64,383
State:
+$23,581
(% of AGI for various income ranges: -1.2% for AGIs $10k-25k, -0.3% for AGIs $25k-50k, 1.0% for AGIs $50k-75k, 4.6% for AGIs $75k-100k, 42.5% for AGIs over 100k)
Profit/loss from business: +$13,418 (reported on 18.6% of returns)
Here:
+$13,418
State:
+$13,809
(% of AGI for various income ranges: 6.3% for AGIs $25k-50k, 4.0% for AGIs $50k-75k, 3.8% for AGIs over 100k)
Total itemized deductions: $25,828 (17% of AGI, reported on 36.9% of returns)
Here:
$25,828
State:
$25,864
Here:
16.7% of AGI
State:
21.9% of AGI
(% of AGI for various income ranges: 11.9% for AGIs $25k-50k, 12.0% for AGIs $50k-75k, 14.5% for AGIs $75k-100k, 13.3% for AGIs over 100k)
Charity contributions deductions: $3,873 (2% of AGI, reported on 31.5% of returns)
Here:
$3,873
State:
$4,439
Here:
2.4% of AGI
State:
3.6% of AGI
(% of AGI for various income ranges: 0.8% for AGIs $25k-50k, 1.0% for AGIs $50k-75k, 2.0% for AGIs $75k-100k, 1.9% for AGIs over 100k)
Total tax: $13,139 (reported on 79.3% of returns)
12824:
$13,139
State:
$11,730
(% of AGI for various income ranges: 4.1% for AGIs $10k-25k, 7.3% for AGIs $25k-50k, 9.9% for AGIs $50k-75k, 10.8% for AGIs $75k-100k, 17.3% for AGIs over 100k)
Earned income credit: $1,638 (reported on 11.1% of returns)
Here:
$1,638
State:
$1,757
Percentage of individuals using paid preparers for their 2004 taxes: 61.4%
Here:
61%
State:
67%
(% for various income ranges: 56.1% for AGIs below $10k, 52.7% for AGIs $10k-25k, 55.3% for AGIs $25k-50k, 64.3% for AGIs $50k-75k, 80.0% for AGIs $75k-100k, 76.9% for AGIs over 100k)
Household received Food Stamps/SNAP in the past 12 months: 17 Household did not receive Food Stamps/SNAP in the past 12 months: 468
Women who had a birth in the past 12 months: 22 (22 now married, 0 unmarried) Women who did not have a birth in the past 12 months: 92 (39 now married, 53 unmarried)
Housing units in zip code 12824 with a mortgage: 225 (54 second mortgage, 54 both second mortgage and home equity loan) Houses without a mortgage: 26
Median monthly owner costs for units with a mortgage: $2,218 Median monthly owner costs for units without a mortgage: $791
Residents with income below the poverty level in 2022:
This zip code:
2.4%
Whole state:
14.3%
Residents with income below 50% of the poverty level in 2022:
This zip code:
0.4%
Whole state:
6.8%
Median number of rooms in houses and condos:
Here:
6.7
State:
6.3
Median number of rooms in apartments:
Here:
4.8
State:
3.8
Notable locations in this zip code not listed on our city pages
Size of family households: 180 2-persons, 95 3-persons, 22 4-persons, 7 5-persons, 15 6-persons
Size of nonfamily households: 110 1-person, 45 2-persons, 15 3-persons
88 married couples with children.
41 single-parent households (5 men, 36 women).
96.5% of residents of 12824 zip code speak English at home.
2.5% of residents speak Spanish at home (44% very well, 56% not well).
2.1% of residents speak other Indo-European language at home (33% very well, 67% well).
Foreign born population: 63 (5.9%) (100.0% of them are naturalized citizens)
This zip code:
5.9%
Whole state:
22.7%
40%Sweden
32%England
24%Dominica
18%North Macedonia (Macedonia)
8%Chile
18%Italian
13%Irish
13%Polish
10%English
8%European
6%Scottish
6%German
Year of entry for the foreign-born population
02010 or later
02000 to 2009
41990 to 1999
54Before 1990
Facilities with environmental interests located in this zip code:
BECKLEY BOAT RENTALS (LAKESHORE DR #107 in DIAMOND POINT, NY)
(Resource Conservation and Recovery Act (tracking hazardous waste))
CHELKA LODGE (LAKESHORE DR NEAR COOLIDGE in DIAMOND POINT, NY)
(Resource Conservation and Recovery Act (tracking hazardous waste))
Housing units lacking complete plumbing facilities: 6.8% Housing units lacking complete kitchen facilities: 2.5%
47.5%Bottled, tank, or LP gas
30.2%Fuel oil, kerosene, etc.
10.2%Electricity
8.5%Wood
4.0%Utility gas
Population in 1990: 770.
Place of birth for U.S.-born residents:
This state: 819
Northeast: 73
Midwest: 25
South: 31
West: 58
66% of the 12824 zip code residents lived in the same house 5 years ago. Out of people who lived in different houses, 61% lived in this county. Out of people who lived in different counties, 50% lived in New York.
99% of the 12824 zip code residents lived in the same house 1 year ago. Out of people who lived in different houses, 80% moved from this county.
Private vs. public school enrollment:
Students in private schools in grades 1 to 8 (elementary and middle school):
Here:
0.0%
New York:
15.6%
Students in private schools in grades 9 to 12 (high school): 34
Here:
47.5%
New York:
15.0%
Students in private undergraduate colleges: 4
Here:
23.1%
New York:
39.2%
Occupation by median earnings in the past 12 months ($)
150,910Health diagnosing and treating practitioners and other technical occupations
115,180Management occupations
64,068Education, training, and library occupations
57,844Installation, maintenance, and repair occupations
50,806Health technologists and technicians
35,262Office and administrative support occupations
Top industries in this zip code by the number of employees in 2005:
Accommodation and Food Services: Hotels (except Casino Hotels) and Motels (5-9 employees: 1 establishment, 1-4 employees: 11 establishments)
Arts, Entertainment, and Recreation: Fitness and Recreational Sports Centers (5-9: 1)
Accommodation and Food Services: Full-Service Restaurants (1-4: 3)
Accommodation and Food Services: All Other Traveler Accommodation (1-4: 3)
Accommodation and Food Services: Recreational and Vacation Camps (except Campgrounds) (1-4: 2)
Real Estate and Rental and Leasing: Lessors of Nonresidential Buildings (except Miniwarehouses) (1-4: 1)
Other Services (except Public Administration): General Automotive Repair (1-4: 1)
Construction: Electrical Contractors (1-4: 1)
Home Mortgage Disclosure Act Aggregated Statistics For Year 2009 (Based on 2 partial tracts)
B) Conventional Home Purchase Loans
C) Refinancings
D) Home Improvement Loans
F) Non-occupant Loans on < 5 Family Dwellings (A B C & D)
Number
Average Value
Number
Average Value
Number
Average Value
Number
Average Value
LOANS ORIGINATED
10
$432,034
26
$228,762
4
$95,488
18
$381,550
APPLICATIONS APPROVED, NOT ACCEPTED
0
$0
5
$335,878
1
$58,630
3
$384,040
APPLICATIONS DENIED
1
$345,090
15
$297,320
4
$60,308
9
$298,651
APPLICATIONS WITHDRAWN
2
$606,215
8
$382,835
1
$126,480
4
$450,315
FILES CLOSED FOR INCOMPLETENESS
0
$0
0
$0
0
$0
0
$0
Aggregated Statistics For Year 2008 (Based on 2 partial tracts)
B) Conventional Home Purchase Loans
C) Refinancings
D) Home Improvement Loans
F) Non-occupant Loans on < 5 Family Dwellings (A B C & D)
Number
Average Value
Number
Average Value
Number
Average Value
Number
Average Value
LOANS ORIGINATED
9
$320,149
18
$203,979
5
$62,066
10
$331,564
APPLICATIONS APPROVED, NOT ACCEPTED
4
$285,202
4
$274,105
0
$0
3
$282,410
APPLICATIONS DENIED
3
$395,767
13
$268,934
6
$38,808
5
$390,908
APPLICATIONS WITHDRAWN
2
$394,720
6
$152,443
0
$0
2
$317,240
FILES CLOSED FOR INCOMPLETENESS
1
$177,570
2
$340,485
0
$0
1
$175,480
Aggregated Statistics For Year 2007 (Based on 2 partial tracts)
B) Conventional Home Purchase Loans
C) Refinancings
D) Home Improvement Loans
F) Non-occupant Loans on < 5 Family Dwellings (A B C & D)
Number
Average Value
Number
Average Value
Number
Average Value
Number
Average Value
LOANS ORIGINATED
16
$411,942
28
$286,938
3
$83,760
20
$440,348
APPLICATIONS APPROVED, NOT ACCEPTED
3
$226,710
8
$389,850
1
$22,200
5
$518,390
APPLICATIONS DENIED
4
$423,512
20
$315,796
2
$210,655
8
$382,050
APPLICATIONS WITHDRAWN
3
$332,947
6
$211,493
1
$46,070
3
$307,957
FILES CLOSED FOR INCOMPLETENESS
1
$263,430
2
$324,990
1
$43,970
1
$213,590
Aggregated Statistics For Year 2006 (Based on 2 partial tracts)
A) FHA, FSA/RHS & VA Home Purchase Loans
B) Conventional Home Purchase Loans
C) Refinancings
D) Home Improvement Loans
F) Non-occupant Loans on < 5 Family Dwellings (A B C & D)
Number
Average Value
Number
Average Value
Number
Average Value
Number
Average Value
Number
Average Value
LOANS ORIGINATED
1
$138,200
24
$356,434
26
$279,001
7
$99,973
25
$319,678
APPLICATIONS APPROVED, NOT ACCEPTED
0
$0
2
$207,725
6
$422,290
2
$121,245
2
$487,275
APPLICATIONS DENIED
0
$0
4
$285,518
13
$191,263
5
$47,994
5
$289,308
APPLICATIONS WITHDRAWN
0
$0
2
$318,080
7
$236,263
0
$0
2
$336,295
FILES CLOSED FOR INCOMPLETENESS
0
$0
1
$209,400
2
$321,430
0
$0
1
$230,340
Aggregated Statistics For Year 2005 (Based on 2 partial tracts)
B) Conventional Home Purchase Loans
C) Refinancings
D) Home Improvement Loans
F) Non-occupant Loans on < 5 Family Dwellings (A B C & D)
Number
Average Value
Number
Average Value
Number
Average Value
Number
Average Value
LOANS ORIGINATED
15
$417,683
26
$240,472
7
$94,170
18
$414,123
APPLICATIONS APPROVED, NOT ACCEPTED
2
$181,970
5
$199,182
1
$138,200
1
$213,590
APPLICATIONS DENIED
3
$392,277
13
$222,769
6
$88,367
5
$367,790
APPLICATIONS WITHDRAWN
2
$157,680
14
$195,490
2
$132,970
2
$210,445
FILES CLOSED FOR INCOMPLETENESS
0
$0
5
$172,714
0
$0
0
$0
Aggregated Statistics For Year 2004 (Based on 2 partial tracts)
B) Conventional Home Purchase Loans
C) Refinancings
D) Home Improvement Loans
F) Non-occupant Loans on < 5 Family Dwellings (A B C & D)
Number
Average Value
Number
Average Value
Number
Average Value
Number
Average Value
LOANS ORIGINATED
21
$299,920
35
$215,155
5
$83,342
22
$305,381
APPLICATIONS APPROVED, NOT ACCEPTED
3
$173,663
7
$207,964
2
$104,700
3
$395,907
APPLICATIONS DENIED
2
$281,645
12
$222,278
3
$41,740
5
$361,760
APPLICATIONS WITHDRAWN
4
$145,322
10
$151,438
2
$125,220
3
$231,037
FILES CLOSED FOR INCOMPLETENESS
0
$0
4
$206,888
0
$0
1
$373,570
Aggregated Statistics For Year 2003 (Based on 2 partial tracts)
A) FHA, FSA/RHS & VA Home Purchase Loans
B) Conventional Home Purchase Loans
C) Refinancings
D) Home Improvement Loans
F) Non-occupant Loans on < 5 Family Dwellings (A B C & D)
Number
Average Value
Number
Average Value
Number
Average Value
Number
Average Value
Number
Average Value
LOANS ORIGINATED
1
$98,420
28
$284,889
60
$183,378
2
$109,305
34
$281,446
APPLICATIONS APPROVED, NOT ACCEPTED
0
$0
2
$116,425
7
$266,836
0
$0
3
$228,663
APPLICATIONS DENIED
0
$0
3
$221,963
17
$196,245
3
$37,830
5
$313,262
APPLICATIONS WITHDRAWN
0
$0
2
$139,460
9
$177,478
0
$0
3
$216,940
FILES CLOSED FOR INCOMPLETENESS
0
$0
1
$62,400
3
$161,377
0
$0
1
$249,190
Aggregated Statistics For Year 2002 (Based on 2 partial tracts)
B) Conventional Home Purchase Loans
C) Refinancings
D) Home Improvement Loans
F) Non-occupant Loans on < 5 Family Dwellings (A B C & D)
Number
Average Value
Number
Average Value
Number
Average Value
Number
Average Value
LOANS ORIGINATED
23
$208,945
41
$208,808
3
$73,850
25
$273,359
APPLICATIONS APPROVED, NOT ACCEPTED
2
$140,090
8
$204,008
1
$92,140
1
$211,490
APPLICATIONS DENIED
3
$120,057
13
$154,892
2
$14,240
2
$149,300
APPLICATIONS WITHDRAWN
2
$89,835
8
$106,428
1
$24,710
2
$109,935
FILES CLOSED FOR INCOMPLETENESS
0
$0
4
$119,358
0
$0
0
$0
Aggregated Statistics For Year 2001 (Based on 2 partial tracts)
A) FHA, FSA/RHS & VA Home Purchase Loans
B) Conventional Home Purchase Loans
C) Refinancings
D) Home Improvement Loans
F) Non-occupant Loans on < 5 Family Dwellings (A B C & D)
Number
Average Value
Number
Average Value
Number
Average Value
Number
Average Value
Number
Average Value
LOANS ORIGINATED
2
$86,275
18
$213,565
25
$169,312
2
$35,180
16
$223,378
APPLICATIONS APPROVED, NOT ACCEPTED
0
$0
3
$196,277
3
$297,627
0
$0
1
$598,470
APPLICATIONS DENIED
0
$0
4
$219,450
15
$196,250
1
$15,910
7
$284,604
APPLICATIONS WITHDRAWN
0
$0
1
$259,240
8
$172,494
0
$0
2
$350,325
FILES CLOSED FOR INCOMPLETENESS
0
$0
0
$0
3
$184,410
0
$0
0
$0
Aggregated Statistics For Year 2000 (Based on 2 partial tracts)
A) FHA, FSA/RHS & VA Home Purchase Loans
B) Conventional Home Purchase Loans
C) Refinancings
D) Home Improvement Loans
F) Non-occupant Loans on < 5 Family Dwellings (A B C & D)
Number
Average Value
Number
Average Value
Number
Average Value
Number
Average Value
Number
Average Value
LOANS ORIGINATED
1
$112,240
18
$241,182
10
$141,094
2
$42,925
11
$249,985
APPLICATIONS APPROVED, NOT ACCEPTED
0
$0
2
$106,795
3
$133,597
1
$10,470
1
$130,250
APPLICATIONS DENIED
0
$0
3
$148,953
9
$123,034
1
$46,910
3
$118,240
APPLICATIONS WITHDRAWN
0
$0
1
$156,210
4
$116,530
1
$22,620
0
$0
FILES CLOSED FOR INCOMPLETENESS
0
$0
0
$0
3
$81,107
0
$0
0
$0
Aggregated Statistics For Year 1999 (Based on 1 partial tract)
B) Conventional Home Purchase Loans
C) Refinancings
D) Home Improvement Loans
F) Non-occupant Loans on < 5 Family Dwellings (A B C & D)


 Nearest zip codes: 12885, 12845, 12844, 12814, 12817, 12815.


