Estimated zip code population in 2022: 358 Zip code population in 2010: 748 Zip code population in 2000: 1,150
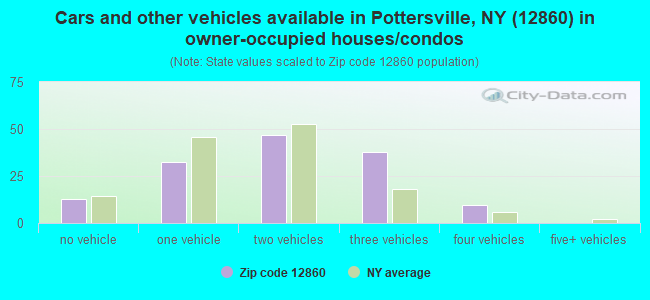
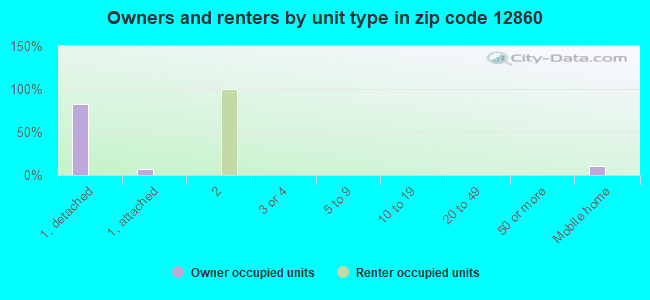
Houses and condos: 295 Renter-occupied apartments: 12
% of renters here:
8%
State:
46%
March 2022 cost of living index in zip code 12860: 94.5 (less than average, U.S. average is 100)
Land area: 16.1 sq. mi. Water area: 0.2 sq. mi.
Population density: 22 people per square mile
(very low).
OSM Map
General Map
Google Map
MSN Map
OSM Map
General Map
Google Map
MSN Map
OSM Map
General Map
Google Map
MSN Map
OSM Map
General Map
Google Map
MSN Map
Please wait while loading the map...
Real estate property taxes paid for housing units in 2022:
This zip code:
0.8% ($1,790)
New York:
1.5% ($6,180)
Median real estate property taxes paid for housing units with mortgages in 2022: $1,606 (0.8%) Median real estate property taxes paid for housing units with no mortgage in 2022: $4,320 (1.5%)
Business Search- 14 Million verified businesses
Males: 203
(56.9%)
Females: 154
(43.1%)
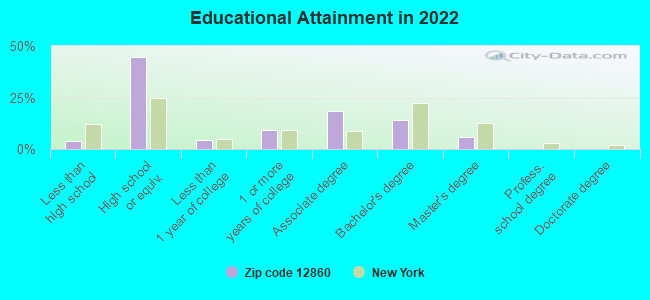
For population 25 years and over in 12860:
High school or higher: 95.1%
Bachelor's degree or higher: 19.7%
Graduate or professional degree: 5.7%
Unemployed: 9.1%
Mean travel time to work (commute): 34.2 minutes
For population 15 years and over in 12860:
Never married: 41.2%
Now married: 42.8%
Separated: 3.8%
Widowed: 5.2%
Divorced: 7.0%
Zip code 12860 compared to state average:
Median house value below state average.
Unemployed percentage above state average.
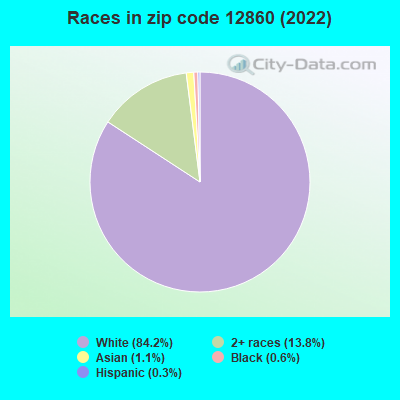
Black race population percentage significantly below state average.
Hispanic race population percentage significantly below state average.
Median age significantly above state average.
Foreign-born population percentage significantly below state average.
Renting percentage significantly below state average.
Length of stay since moving in significantly below state average.
House age below state average.
Number of college students significantly below state average.
Percentage of population with a bachelor's degree or higher below state average.
Averages for the 2020 tax year for zip code 12860, filed in 2021:
Average Adjusted Gross Income (AGI) in 2020: $46,514 (Individual Income Tax Returns)
Here:
$46,514
State:
$90,930
Salary/wage: $36,347 (reported on 81.1% of returns)
Here:
$36,347
State:
$72,104
(% of AGI for various income ranges: 1146.7% for AGIs below $25k, 3065.0% for AGIs $25k-50k, 5567.5% for AGIs $50k-75k, 9315.0% for AGIs $75k-100k, 13585.0% for AGIs $100k-200k)
Taxable interest for individuals: $900 (reported on 27.0% of returns)
This zip code:
$900
New York:
$3,075
(% of AGI for various income ranges: 7.0% for AGIs $25k-50k, 15.0% for AGIs $50k-75k, 385.0% for AGIs $100k-200k)
Ordinary dividends: $1,560 (reported on 13.5% of returns)
Here:
$1,560
State:
$11,095
(% of AGI for various income ranges: 195.0% for AGIs $50k-75k)
Net capital gain/loss in AGI: +$8,250 (reported on 10.8% of returns)
Here:
+$8,250
State:
+$44,925
(% of AGI for various income ranges: 825.0% for AGIs $50k-75k)
Profit/loss from business: +$5,320 (reported on 13.5% of returns)
Here:
+$5,320
State:
+$14,940
(% of AGI for various income ranges: 137.8% for AGIs below $25k, 142.0% for AGIs $25k-50k)
Taxable individual retirement arrangement distribution: $11,600 (reported on 5.4% of returns)
12860:
$11,600
New York:
$19,609
(% of AGI for various income ranges: 257.8% for AGIs below $25k)
Earned income credit: $2,467 (reported on 16.2% of returns)
Here:
$2,467
State:
$2,138
(% of AGI for various income ranges: 107.8% for AGIs below $25k, 51.0% for AGIs $25k-50k)
Percentage of individuals using paid preparers for their 2020 taxes: 94.6%
Here:
95%
State:
95%
(% for various income ranges: 100.0% for AGIs below $25k, 91.7% for AGIs $25k-50k, 83.3% for AGIs $50k-75k, 100.0% for AGIs $75k-100k, 100.0% for AGIs $100k-200k)
Averages for the 2012 tax year for zip code 12860, filed in 2013:
Average Adjusted Gross Income (AGI) in 2012: $36,373 (Individual Income Tax Returns)
Here:
$36,373
State:
$77,088
Salary/wage: $29,897 (reported on 78.4% of returns)
Here:
$29,897
State:
$60,593
(% of AGI for various income ranges: 70.5% for AGIs below $25k, 78.6% for AGIs $25k-50k, 70.0% for AGIs $50k-75k, 48.6% for AGIs $75k-100k)
Taxable interest for individuals: $582 (reported on 29.7% of returns)
This zip code:
$582
New York:
$3,125
(% of AGI for various income ranges: 0.7% for AGIs below $25k, 0.3% for AGIs $25k-50k, 0.6% for AGIs $50k-75k, 0.4% for AGIs $75k-100k)
Ordinary dividends: $2,850 (reported on 16.2% of returns)
Here:
$2,850
State:
$10,299
(% of AGI for various income ranges: 1.6% for AGIs below $25k, 0.7% for AGIs $25k-50k, 2.2% for AGIs $75k-100k)
Net capital gain/loss in AGI: +$1,825 (reported on 10.8% of returns)
Here:
+$1,825
State:
+$42,474
Profit/loss from business: +$7,100 (reported on 16.2% of returns)
Here:
+$7,100
State:
+$16,168
Taxable individual retirement arrangement distribution: $7,350 (reported on 5.4% of returns)
12860:
$7,350
New York:
$17,621
Total itemized deductions: $16,883 (22% of AGI, reported on 16.2% of returns)
Here:
$16,883
State:
$34,985
Here:
22.2% of AGI
State:
21.3% of AGI
Charity contributions: $2,900 (reported on 10.8% of returns)
Here:
$2,900
State:
$5,572
Taxes paid: $6,367 (reported on 16.2% of returns)
12860:
$6,367
State:
$18,656
Earned income credit: $2,157 (reported on 18.9% of returns)
Here:
$2,157
State:
$2,230
(% of AGI for various income ranges: 5.0% for AGIs below $25k, 1.2% for AGIs $25k-50k)
Percentage of individuals using paid preparers for their 2012 taxes: 43.2%
Here:
43%
State:
66%
(% for various income ranges: 41.2% for AGIs below $25k, 54.5% for AGIs $25k-50k, 60.0% for AGIs $75k-100k)
Averages for the 2004 tax year for zip code 12860, filed in 2005:
Average Adjusted Gross Income (AGI) in 2004: $26,995 (Individual Income Tax Returns)
Here:
$26,995
State:
$59,519
Salary/wage: $23,041 (reported on 83.4% of returns)
Here:
$23,041
State:
$50,673
(% of AGI for various income ranges: 98.5% for AGIs below $10k, 72.1% for AGIs $10k-25k, 85.6% for AGIs $25k-50k, 64.6% for AGIs $50k-75k, 48.8% for AGIs $75k-100k)
Taxable interest for individuals: $898 (reported on 40.8% of returns)
This zip code:
$898
New York:
$2,377
(% of AGI for various income ranges: 4.0% for AGIs below $10k, 3.4% for AGIs $10k-25k, 0.4% for AGIs $25k-50k, 0.9% for AGIs $50k-75k, 0.8% for AGIs $75k-100k)
Taxable dividends: $1,264 (reported on 25.9% of returns)
Here:
$1,264
State:
$5,394
(% of AGI for various income ranges: 1.5% for AGIs below $10k, 1.3% for AGIs $10k-25k, 0.5% for AGIs $25k-50k, 2.7% for AGIs $50k-75k, 0.8% for AGIs $75k-100k)
Net capital gain/loss: +$6,161 (reported on 15.2% of returns)
Here:
+$6,161
State:
+$23,581
(% of AGI for various income ranges: 1.3% for AGIs $10k-25k, 0.1% for AGIs $25k-50k, 0.1% for AGIs $50k-75k, 14.8% for AGIs $75k-100k)
Profit/loss from business: +$6,359 (reported on 15.6% of returns)
Here:
+$6,359
State:
+$13,809
(% of AGI for various income ranges: 11.3% for AGIs below $10k, 6.1% for AGIs $10k-25k, 3.9% for AGIs $25k-50k, 3.3% for AGIs $50k-75k)
Total itemized deductions: $14,929 (26% of AGI, reported on 13.7% of returns)
Here:
$14,929
State:
$25,864
Here:
25.7% of AGI
State:
21.9% of AGI
(% of AGI for various income ranges: 5.2% for AGIs $10k-25k, 6.7% for AGIs $25k-50k, 9.9% for AGIs $50k-75k, 10.5% for AGIs $75k-100k)
Charity contributions deductions: $1,917 (3% of AGI, reported on 11.7% of returns)
Here:
$1,917
State:
$4,439
Here:
3.4% of AGI
State:
3.6% of AGI
(% of AGI for various income ranges: 3.3% for AGIs below $10k, 0.7% for AGIs $25k-50k, 0.9% for AGIs $50k-75k, 1.4% for AGIs $75k-100k)
Total tax: $2,830 (reported on 69.2% of returns)
12860:
$2,830
State:
$11,730
(% of AGI for various income ranges: 2.5% for AGIs below $10k, 4.1% for AGIs $10k-25k, 6.0% for AGIs $25k-50k, 9.0% for AGIs $50k-75k, 11.6% for AGIs $75k-100k)
Earned income credit: $1,612 (reported on 19.6% of returns)
Here:
$1,612
State:
$1,757
Percentage of individuals using paid preparers for their 2004 taxes: 49.9%
Here:
50%
State:
67%
(% for various income ranges: 48.1% for AGIs below $10k, 46.4% for AGIs $10k-25k, 51.9% for AGIs $25k-50k, 48.6% for AGIs $50k-75k, 72.7% for AGIs $75k-100k)
Household received Food Stamps/SNAP in the past 12 months: 22 Household did not receive Food Stamps/SNAP in the past 12 months: 130
Women who did not have a birth in the past 12 months: 46 (26 now married, 19 unmarried)
Housing units in zip code 12860 with a mortgage: 88 Median monthly owner costs for units with a mortgage: $1,330 Median monthly owner costs for units without a mortgage: $819
Residents with income below the poverty level in 2022:
This zip code:
16.5%
Whole state:
14.3%
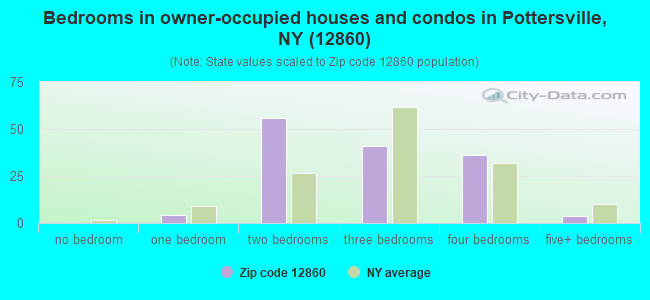
Median number of rooms in houses and condos:
Here:
5.2
State:
6.3
Notable locations in this zip code not listed on our city pages
Streams, rivers, and creeks: Trout Brook (A), Fuller Brook (B), Alder Brook (C), Ford Brook (D), Marshall Brook (E). Display/hide their locations on the map
In group quarters: 17 (-1 institutionalized population)
Size of family households: 64 2-persons, 10 3-persons, 14 5-persons, 4 6-persons
Size of nonfamily households: 29 1-person, 30 2-persons
34 married couples with children.
27 single-parent households (27 women).
97.5% of residents of 12860 zip code speak English at home.
0.6% of residents speak Spanish at home (100% very well).
1.9% of residents speak other Indo-European language at home (100% very well).
Foreign born population: 0 (0.0%)
:
0.0%
Whole state:
22.7%
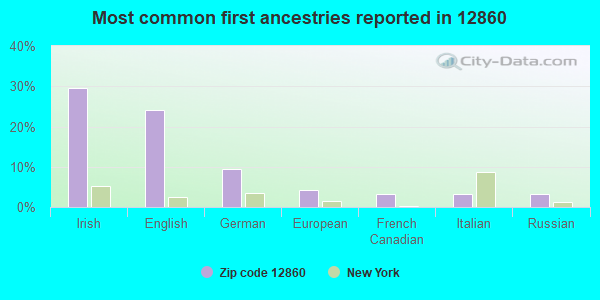
29%Irish
24%English
9%German
4%European
3%French Canadian
3%Italian
3%Russian
49.1%Fuel oil, kerosene, etc.
37.0%Bottled, tank, or LP gas
8.1%Other fuel
6.7%Wood
Population in 1990: 252. Population change in the 1990s: +898 (+356.3%).
Place of birth for U.S.-born residents:
This state: 316
Northeast: 26
Midwest: 7
South: 6
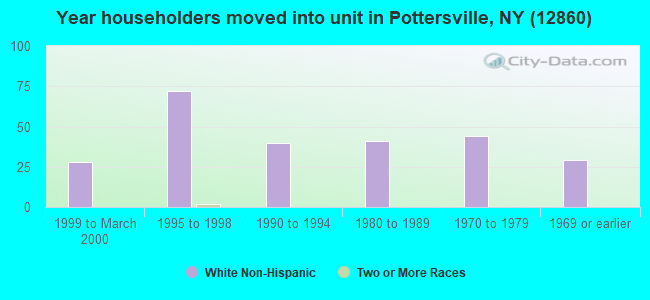
49% of the 12860 zip code residents lived in the same house 5 years ago. Out of people who lived in different houses, 26% lived in this county. Out of people who lived in different counties, 50% lived in New York.
93% of the 12860 zip code residents lived in the same house 1 year ago. Out of people who lived in different houses, 74% moved from this county. Out of people who lived in different houses, 21% moved from different county within same state.
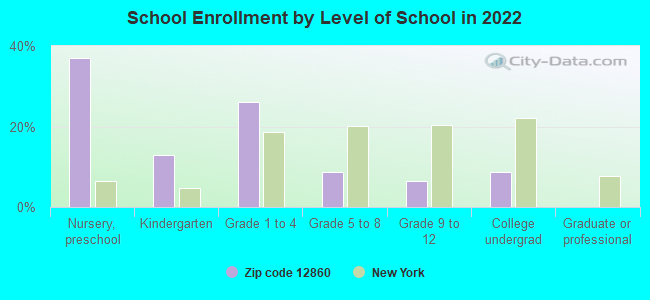
Private vs. public school enrollment:
Students in private schools in grades 1 to 8 (elementary and middle school):
Here:
0.0%
New York:
15.6%
Students in private schools in grades 9 to 12 (high school):
Here:
0.0%
New York:
15.0%
Students in private undergraduate colleges: 4
Here:
100.0%
New York:
39.2%
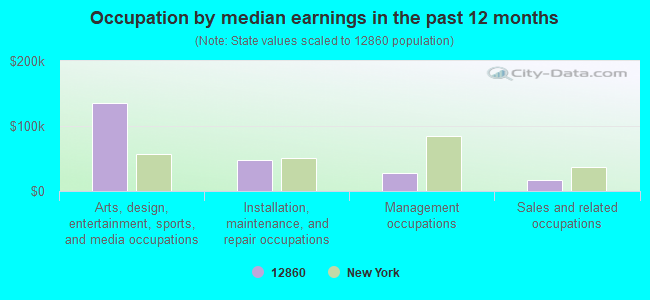
Occupation by median earnings in the past 12 months ($)
135,348Arts, design, entertainment, sports, and media occupations
48,400Installation, maintenance, and repair occupations
28,087Management occupations
16,986Sales and related occupations
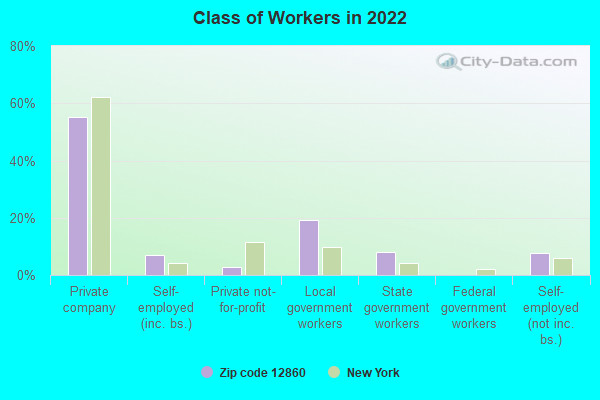
Top industries in this zip code by the number of employees in 2005:
Other Services (except Public Administration): Religious Organizations (500-999 employees: 1 establishment, 5-9 employees: 1 establishment, 1-4 employees: 1 establishment)
Accommodation and Food Services: Full-Service Restaurants (10-19: 1, 1-4: 1)
Wholesale Trade: Motor Vehicle Supplies and New Parts Merchant Wholesalers (5-9: 1)
Other Services (except Public Administration): General Automotive Repair (5-9: 1)
Administrative and Support and Waste Management and Remediation Services: Other Services to Buildings and Dwellings (1-4: 1)
Other Services (except Public Administration): Other Similar Organizations (except Business, Professional, Labor, and Political Organizations) (1-4: 1)
Administrative and Support and Waste Management and Remediation Services: Septic Tank and Related Services (1-4: 1)
Arts, Entertainment, and Recreation: Nature Parks and Other Similar Institutions (1-4: 1)
People in group quarters in 2010:
20 people in college/university student housing
People in group quarters in 2000:
501 people in college dormitories (includes college quarters off campus)
Fatal accident statistics in 2014:
Fatal accident count: 1
Vehicles involved in fatal accidents: 2
Fatal accidents caused by drunken drivers: 0
Fatalities: 1
Persons involved in fatal accidents: 4
Pedestrians involved in fatal accidents: 0
Fatal accident statistics in 2012:
Fatal accident count: 1
Vehicles involved in fatal accidents: 2
Fatal accidents caused by drunken drivers: 0
Fatalities: 1
Persons involved in fatal accidents: 2
Pedestrians involved in fatal accidents: 0
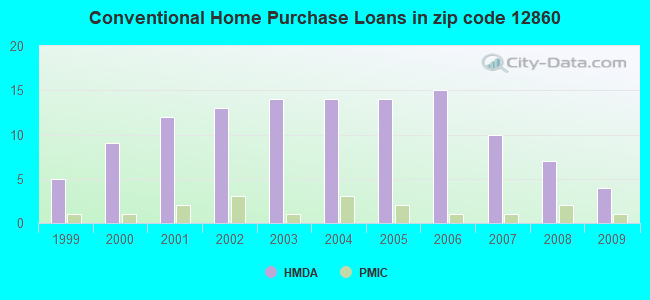
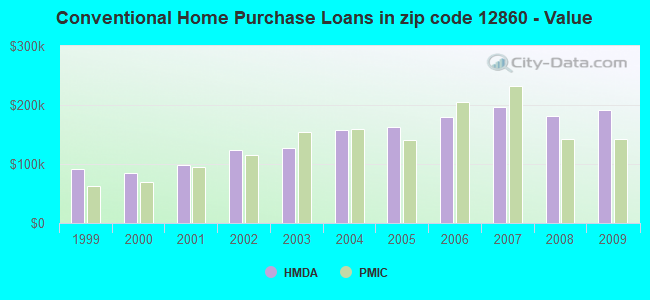
Home Mortgage Disclosure Act Aggregated Statistics For Year 2009 (Based on 2 partial tracts)
A) FHA, FSA/RHS & VA Home Purchase Loans
B) Conventional Home Purchase Loans
C) Refinancings
D) Home Improvement Loans
F) Non-occupant Loans on < 5 Family Dwellings (A B C & D)
G) Loans On Manufactured Home Dwelling (A B C & D)
Number
Average Value
Number
Average Value
Number
Average Value
Number
Average Value
Number
Average Value
Number
Average Value
LOANS ORIGINATED
1
$232,500
4
$190,912
12
$183,474
3
$50,830
7
$215,510
0
$0
APPLICATIONS APPROVED, NOT ACCEPTED
0
$0
0
$0
3
$170,320
0
$0
1
$244,900
0
$0
APPLICATIONS DENIED
0
$0
1
$453,320
8
$197,721
4
$26,570
3
$200,803
1
$18,730
APPLICATIONS WITHDRAWN
0
$0
0
$0
4
$174,678
0
$0
1
$263,870
0
$0
FILES CLOSED FOR INCOMPLETENESS
0
$0
0
$0
1
$283,080
0
$0
0
$0
0
$0
Aggregated Statistics For Year 2008 (Based on 2 partial tracts)
A) FHA, FSA/RHS & VA Home Purchase Loans
B) Conventional Home Purchase Loans
C) Refinancings
D) Home Improvement Loans
F) Non-occupant Loans on < 5 Family Dwellings (A B C & D)
G) Loans On Manufactured Home Dwelling (A B C & D)
Number
Average Value
Number
Average Value
Number
Average Value
Number
Average Value
Number
Average Value
Number
Average Value
LOANS ORIGINATED
1
$154,430
7
$181,357
9
$131,301
3
$65,747
5
$203,266
1
$45,720
APPLICATIONS APPROVED, NOT ACCEPTED
0
$0
2
$176,200
2
$229,700
0
$0
1
$479,830
1
$48,400
APPLICATIONS DENIED
0
$0
3
$155,890
9
$132,192
5
$59,146
3
$168,213
1
$30,640
APPLICATIONS WITHDRAWN
0
$0
1
$133,270
3
$142,190
1
$97,770
1
$88,040
0
$0
FILES CLOSED FOR INCOMPLETENESS
0
$0
0
$0
1
$289,650
0
$0
1
$245,390
0
$0
Aggregated Statistics For Year 2007 (Based on 2 partial tracts)
A) FHA, FSA/RHS & VA Home Purchase Loans
B) Conventional Home Purchase Loans
C) Refinancings
D) Home Improvement Loans
F) Non-occupant Loans on < 5 Family Dwellings (A B C & D)
G) Loans On Manufactured Home Dwelling (A B C & D)
Number
Average Value
Number
Average Value
Number
Average Value
Number
Average Value
Number
Average Value
Number
Average Value
LOANS ORIGINATED
1
$148,840
10
$195,898
15
$146,795
4
$85,790
8
$212,344
1
$48,400
APPLICATIONS APPROVED, NOT ACCEPTED
0
$0
2
$142,760
3
$110,900
1
$58,850
2
$183,375
0
$0
APPLICATIONS DENIED
0
$0
3
$85,443
14
$132,336
7
$28,767
3
$138,787
1
$68,340
APPLICATIONS WITHDRAWN
0
$0
1
$125,250
6
$155,527
1
$111,870
1
$272,870
0
$0
FILES CLOSED FOR INCOMPLETENESS
0
$0
0
$0
2
$130,110
0
$0
0
$0
0
$0
Aggregated Statistics For Year 2006 (Based on 2 partial tracts)
B) Conventional Home Purchase Loans
C) Refinancings
D) Home Improvement Loans
F) Non-occupant Loans on < 5 Family Dwellings (A B C & D)
G) Loans On Manufactured Home Dwelling (A B C & D)
Number
Average Value
Number
Average Value
Number
Average Value
Number
Average Value
Number
Average Value
LOANS ORIGINATED
15
$179,190
14
$134,681
6
$58,207
9
$247,712
1
$67,610
APPLICATIONS APPROVED, NOT ACCEPTED
1
$274,570
2
$149,570
0
$0
1
$99,960
0
$0
APPLICATIONS DENIED
2
$100,075
8
$110,321
3
$23,267
2
$62,865
1
$101,900
APPLICATIONS WITHDRAWN
2
$81,715
7
$113,261
1
$27,240
1
$125,250
0
$0
FILES CLOSED FOR INCOMPLETENESS
1
$415,140
1
$137,160
0
$0
0
$0
0
$0
Aggregated Statistics For Year 2005 (Based on 2 partial tracts)
A) FHA, FSA/RHS & VA Home Purchase Loans
B) Conventional Home Purchase Loans
C) Refinancings
D) Home Improvement Loans
F) Non-occupant Loans on < 5 Family Dwellings (A B C & D)
G) Loans On Manufactured Home Dwelling (A B C & D)
Number
Average Value
Number
Average Value
Number
Average Value
Number
Average Value
Number
Average Value
Number
Average Value
LOANS ORIGINATED
1
$48,640
14
$163,274
13
$129,532
5
$81,228
9
$175,699
1
$83,420
APPLICATIONS APPROVED, NOT ACCEPTED
0
$0
1
$117,470
4
$115,460
0
$0
1
$105,790
0
$0
APPLICATIONS DENIED
0
$0
5
$87,066
11
$99,292
3
$55,127
1
$239,550
1
$58,120
APPLICATIONS WITHDRAWN
0
$0
1
$179,240
9
$122,546
1
$100,930
0
$0
0
$0
FILES CLOSED FOR INCOMPLETENESS
0
$0
0
$0
2
$172,430
0
$0
0
$0
0
$0
Aggregated Statistics For Year 2004 (Based on 2 partial tracts)
A) FHA, FSA/RHS & VA Home Purchase Loans
B) Conventional Home Purchase Loans
C) Refinancings
D) Home Improvement Loans
F) Non-occupant Loans on < 5 Family Dwellings (A B C & D)
G) Loans On Manufactured Home Dwelling (A B C & D)
Number
Average Value
Number
Average Value
Number
Average Value
Number
Average Value
Number
Average Value
Number
Average Value
LOANS ORIGINATED
1
$119,410
14
$156,969
19
$103,514
5
$36,480
13
$165,170
1
$138,870
APPLICATIONS APPROVED, NOT ACCEPTED
0
$0
3
$154,757
3
$134,893
0
$0
2
$181,550
0
$0
APPLICATIONS DENIED
0
$0
2
$77,700
9
$86,039
3
$48,153
3
$73,123
1
$88,520
APPLICATIONS WITHDRAWN
0
$0
1
$203,800
5
$90,324
0
$0
1
$158,570
0
$0
FILES CLOSED FOR INCOMPLETENESS
0
$0
0
$0
1
$146,160
0
$0
0
$0
0
$0
Aggregated Statistics For Year 2003 (Based on 2 partial tracts)
A) FHA, FSA/RHS & VA Home Purchase Loans
B) Conventional Home Purchase Loans
C) Refinancings
D) Home Improvement Loans
F) Non-occupant Loans on < 5 Family Dwellings (A B C & D)
Number
Average Value
Number
Average Value
Number
Average Value
Number
Average Value
Number
Average Value
LOANS ORIGINATED
1
$87,800
14
$127,037
31
$101,312
4
$32,285
15
$136,662
APPLICATIONS APPROVED, NOT ACCEPTED
0
$0
1
$163,920
6
$116,007
0
$0
2
$187,265
APPLICATIONS DENIED
0
$0
2
$125,005
11
$70,550
3
$20,023
2
$120,505
APPLICATIONS WITHDRAWN
0
$0
1
$58,120
6
$89,255
0
$0
0
$0
FILES CLOSED FOR INCOMPLETENESS
0
$0
0
$0
1
$43,050
0
$0
0
$0
Aggregated Statistics For Year 2002 (Based on 2 partial tracts)
B) Conventional Home Purchase Loans
C) Refinancings
D) Home Improvement Loans
F) Non-occupant Loans on < 5 Family Dwellings (A B C & D)
Number
Average Value
Number
Average Value
Number
Average Value
Number
Average Value
LOANS ORIGINATED
13
$123,695
15
$81,245
3
$17,997
13
$116,362
APPLICATIONS APPROVED, NOT ACCEPTED
1
$42,320
5
$99,226
0
$0
2
$106,155
APPLICATIONS DENIED
3
$66,473
11
$74,972
2
$17,995
2
$106,400
APPLICATIONS WITHDRAWN
1
$95,820
6
$87,633
1
$31,620
1
$115,520
FILES CLOSED FOR INCOMPLETENESS
0
$0
1
$105,060
0
$0
0
$0
Aggregated Statistics For Year 2001 (Based on 2 partial tracts)
B) Conventional Home Purchase Loans
C) Refinancings
D) Home Improvement Loans
F) Non-occupant Loans on < 5 Family Dwellings (A B C & D)
Number
Average Value
Number
Average Value
Number
Average Value
Number
Average Value
LOANS ORIGINATED
12
$97,523
9
$76,500
4
$9,668
7
$96,794
APPLICATIONS APPROVED, NOT ACCEPTED
1
$54,230
3
$84,470
1
$6,080
1
$72,230
APPLICATIONS DENIED
3
$54,557
7
$58,403
2
$23,710
1
$46,210
APPLICATIONS WITHDRAWN
0
$0
8
$75,210
0
$0
0
$0
FILES CLOSED FOR INCOMPLETENESS
0
$0
1
$69,560
0
$0
0
$0
Aggregated Statistics For Year 2000 (Based on 2 partial tracts)
A) FHA, FSA/RHS & VA Home Purchase Loans
B) Conventional Home Purchase Loans
C) Refinancings
D) Home Improvement Loans
F) Non-occupant Loans on < 5 Family Dwellings (A B C & D)
Number
Average Value
Number
Average Value
Number
Average Value
Number
Average Value
Number
Average Value
LOANS ORIGINATED
1
$60,070
9
$84,958
5
$87,796
3
$30,320
6
$98,212
APPLICATIONS APPROVED, NOT ACCEPTED
0
$0
1
$65,180
2
$67,975
2
$19,455
0
$0
APPLICATIONS DENIED
0
$0
4
$46,270
7
$51,280
2
$24,805
1
$30,160
APPLICATIONS WITHDRAWN
0
$0
0
$0
4
$52,652
0
$0
0
$0
FILES CLOSED FOR INCOMPLETENESS
0
$0
0
$0
1
$44,990
0
$0
0
$0
Aggregated Statistics For Year 1999 (Based on 1 partial tract)
A) FHA, FSA/RHS & VA Home Purchase Loans
B) Conventional Home Purchase Loans
C) Refinancings
D) Home Improvement Loans
F) Non-occupant Loans on < 5 Family Dwellings (A B C & D)
Detailed PMIC statistics for the following Tracts:0750.00
2002 - 2018 National Fire Incident Reporting System (NFIRS) incidents
Based on the data from the years 2002 - 2018 the average number of fires per year is 9. The highest number of reported fire incidents - 24 took place in 2002, and the least - 4 in 2011. The data has a dropping trend.
When looking into fire subcategories, the most reports belonged to: Structure Fires (51.4%), and Outside Fires (30.1%).
Fire incident types reported to NFIRS in Zip Code 12860

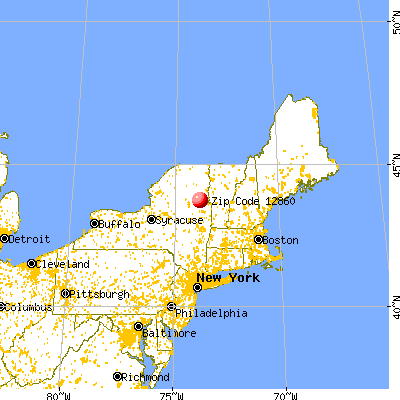


 Nearest zip codes: 12857, 12862, 12870, 12817, 12886, 12808.
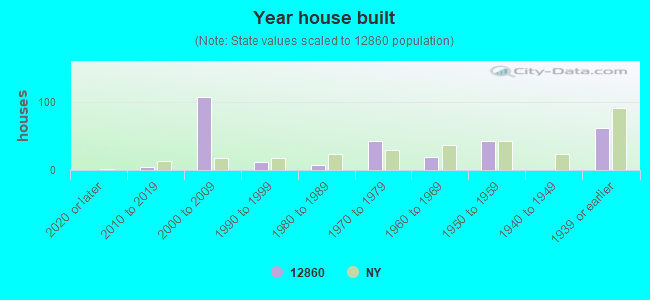


 Based on the data from the years 2002 - 2018 the average number of fires per year is 9. The highest number of reported fire incidents - 24 took place in 2002, and the least - 4 in 2011. The data has a dropping trend.
 When looking into fire subcategories, the most reports belonged to: Structure Fires (51.4%), and Outside Fires (30.1%).