Estimated zip code population in 2022: 3,393 Zip code population in 2010: 3,663 Zip code population in 2000: 3,152
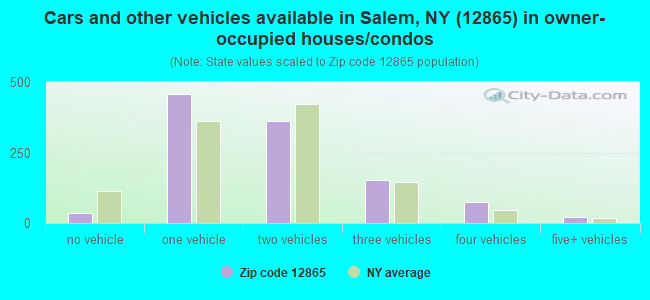
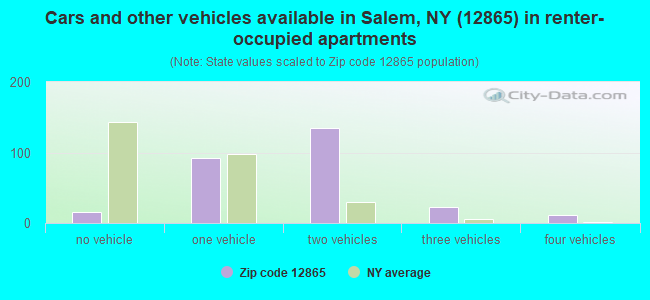
Houses and condos: 1,773 Renter-occupied apartments: 281
% of renters here:
20%
State:
46%
March 2022 cost of living index in zip code 12865: 94.9 (less than average, U.S. average is 100)
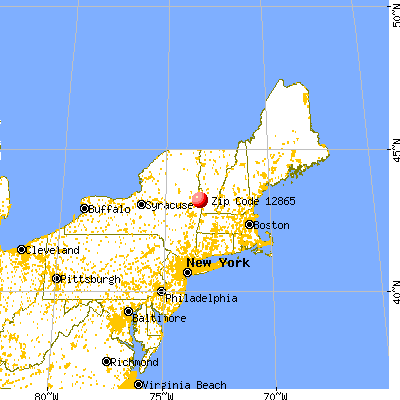
Land area: 72.3 sq. mi. Water area: 0.3 sq. mi.
Population density: 47 people per square mile
(very low).
OSM Map
General Map
Google Map
MSN Map
OSM Map
General Map
Google Map
MSN Map
OSM Map
General Map
Google Map
MSN Map
OSM Map
General Map
Google Map
MSN Map
Please wait while loading the map...
Real estate property taxes paid for housing units in 2022:
This zip code:
2.1% ($3,442)
New York:
1.5% ($6,180)
Median real estate property taxes paid for housing units with mortgages in 2022: $3,769 (2.0%) Median real estate property taxes paid for housing units with no mortgage in 2022: $2,731 (1.9%)
Business Search- 14 Million verified businesses
Males: 1,707
(50.3%)
Females: 1,685
(49.7%)
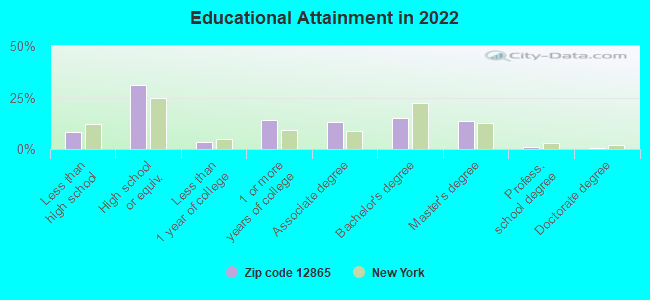
For population 25 years and over in 12865:
High school or higher: 90.5%
Bachelor's degree or higher: 29.6%
Graduate or professional degree: 15.0%
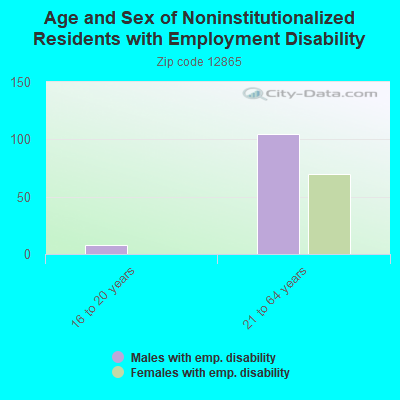
Unemployed: 8.4%
Mean travel time to work (commute): 31.1 minutes
For population 15 years and over in 12865:
Never married: 33.1%
Now married: 51.0%
Separated: 1.8%
Widowed: 5.4%
Divorced: 8.7%
Zip code 12865 compared to state average:
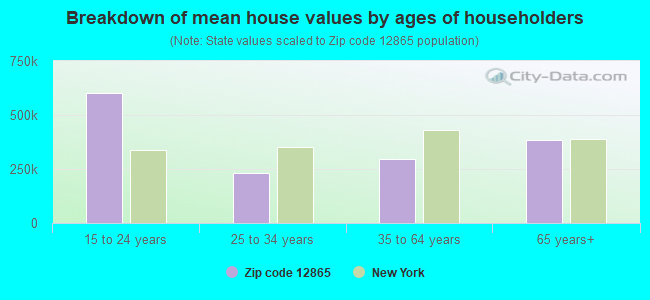
Median house value significantly below state average.
Black race population percentage significantly below state average.
Hispanic race population percentage significantly below state average.
Median age above state average.
Foreign-born population percentage significantly below state average.
Renting percentage significantly below state average.
Length of stay since moving in below state average.
Averages for the 2020 tax year for zip code 12865, filed in 2021:
Average Adjusted Gross Income (AGI) in 2020: $58,729 (Individual Income Tax Returns)
Here:
$58,729
State:
$90,930
Salary/wage: $47,607 (reported on 76.6% of returns)
Here:
$47,607
State:
$72,104
(% of AGI for various income ranges: 994.0% for AGIs below $25k, 3526.9% for AGIs $25k-50k, 5841.8% for AGIs $50k-75k, 8935.0% for AGIs $75k-100k, 14495.5% for AGIs $100k-200k)
Taxable interest for individuals: $825 (reported on 34.1% of returns)
This zip code:
$825
New York:
$3,075
(% of AGI for various income ranges: 11.7% for AGIs below $25k, 16.1% for AGIs $25k-50k, 33.2% for AGIs $50k-75k, 72.5% for AGIs $75k-100k, 67.3% for AGIs $100k-200k)
Ordinary dividends: $8,364 (reported on 19.8% of returns)
Here:
$8,364
State:
$11,095
(% of AGI for various income ranges: 42.6% for AGIs below $25k, 52.5% for AGIs $25k-50k, 226.4% for AGIs $50k-75k, 140.0% for AGIs $75k-100k, 644.5% for AGIs $100k-200k)
Net capital gain/loss in AGI: +$16,393 (reported on 16.2% of returns)
Here:
+$16,393
State:
+$44,925
(% of AGI for various income ranges: 21.1% for AGIs below $25k, 50.0% for AGIs $25k-50k, 109.1% for AGIs $50k-75k, 149.2% for AGIs $75k-100k, 689.1% for AGIs $100k-200k)
Profit/loss from business: +$11,300 (reported on 15.0% of returns)
Here:
+$11,300
State:
+$14,940
(% of AGI for various income ranges: 94.0% for AGIs below $25k, 166.9% for AGIs $25k-50k, 90.5% for AGIs $50k-75k, 1553.6% for AGIs $100k-200k)
Taxable individual retirement arrangement distribution: $15,010 (reported on 12.6% of returns)
12865:
$15,010
New York:
$19,609
(% of AGI for various income ranges: 91.1% for AGIs below $25k, 100.0% for AGIs $25k-50k, 288.2% for AGIs $50k-75k, 421.7% for AGIs $75k-100k, 1211.8% for AGIs $100k-200k)
Total itemized deductions: $28,000 (reported on 3.6% of returns)
Here:
$28,000
State:
$39,326
(% of AGI for various income ranges: 209.7% for AGIs $25k-50k, 840.9% for AGIs $100k-200k)
Charity contributions: $7,475 (reported on 2.4% of returns)
Here:
$7,475
State:
$15,420
(% of AGI for various income ranges: 12.3% for AGIs below $25k, 232.7% for AGIs $100k-200k)
Taxes paid: $8,367 (reported on 3.6% of returns)
12865:
$8,367
State:
$9,183
(% of AGI for various income ranges: 63.9% for AGIs $25k-50k, 247.3% for AGIs $100k-200k)
Earned income credit: $1,862 (reported on 14.4% of returns)
Here:
$1,862
State:
$2,138
(% of AGI for various income ranges: 75.1% for AGIs below $25k, 51.1% for AGIs $25k-50k)
Percentage of individuals using paid preparers for their 2020 taxes: 95.8%
Here:
96%
State:
95%
(% for various income ranges: 94.0% for AGIs below $25k, 95.7% for AGIs $25k-50k, 96.7% for AGIs $50k-75k, 100.0% for AGIs $75k-100k, 94.7% for AGIs $100k-200k, 100.0% for AGIs over 200k)
Averages for the 2012 tax year for zip code 12865, filed in 2013:
Average Adjusted Gross Income (AGI) in 2012: $48,699 (Individual Income Tax Returns)
Here:
$48,699
State:
$77,088
Salary/wage: $41,219 (reported on 78.7% of returns)
Here:
$41,219
State:
$60,593
(% of AGI for various income ranges: 69.3% for AGIs below $25k, 76.5% for AGIs $25k-50k, 67.8% for AGIs $50k-75k, 75.2% for AGIs $75k-100k, 99.4% for AGIs $100k-200k)
Taxable interest for individuals: $1,013 (reported on 36.6% of returns)
This zip code:
$1,013
New York:
$3,125
(% of AGI for various income ranges: 0.9% for AGIs below $25k, 0.8% for AGIs $25k-50k, 0.7% for AGIs $50k-75k, 0.7% for AGIs $75k-100k, 0.3% for AGIs $100k-200k, 1.3% for AGIs over 200k)
Ordinary dividends: $5,961 (reported on 23.2% of returns)
Here:
$5,961
State:
$10,299
(% of AGI for various income ranges: 1.9% for AGIs below $25k, 1.2% for AGIs $25k-50k, 2.4% for AGIs $50k-75k, 1.3% for AGIs $75k-100k, 8.5% for AGIs $100k-200k)
Net capital gain/loss in AGI: +$11,168 (reported on 13.4% of returns)
Here:
+$11,168
State:
+$42,474
(% of AGI for various income ranges: 0.1% for AGIs $25k-50k, 0.4% for AGIs $50k-75k, 1.8% for AGIs $75k-100k, 13.3% for AGIs $100k-200k)
Profit/loss from business: +$8,369 (reported on 17.7% of returns)
Here:
+$8,369
State:
+$16,168
(% of AGI for various income ranges: 8.7% for AGIs below $25k, 2.5% for AGIs $25k-50k, 3.0% for AGIs $50k-75k, 1.9% for AGIs $75k-100k, 3.7% for AGIs $100k-200k)
Taxable individual retirement arrangement distribution: $12,386 (reported on 12.8% of returns)
12865:
$12,386
New York:
$17,621
(% of AGI for various income ranges: 5.3% for AGIs below $25k, 2.9% for AGIs $25k-50k, 2.4% for AGIs $50k-75k, 3.7% for AGIs $75k-100k, 5.5% for AGIs $100k-200k)
Total itemized deductions: $18,604 (20% of AGI, reported on 28.0% of returns)
Here:
$18,604
State:
$34,985
Here:
19.9% of AGI
State:
21.3% of AGI
(% of AGI for various income ranges: 9.4% for AGIs below $25k, 7.4% for AGIs $25k-50k, 10.2% for AGIs $50k-75k, 14.2% for AGIs $75k-100k, 13.2% for AGIs $100k-200k, 9.7% for AGIs over 200k)
Charity contributions: $2,879 (reported on 20.1% of returns)
Here:
$2,879
State:
$5,572
(% of AGI for various income ranges: 0.7% for AGIs below $25k, 0.7% for AGIs $25k-50k, 0.8% for AGIs $50k-75k, 1.5% for AGIs $75k-100k, 2.9% for AGIs $100k-200k)
Taxes paid: $9,496 (reported on 27.4% of returns)
12865:
$9,496
State:
$18,656
(% of AGI for various income ranges: 2.8% for AGIs below $25k, 3.0% for AGIs $25k-50k, 4.7% for AGIs $50k-75k, 6.7% for AGIs $75k-100k, 7.1% for AGIs $100k-200k, 7.3% for AGIs over 200k)
Earned income credit: $2,093 (reported on 17.1% of returns)
Here:
$2,093
State:
$2,230
(% of AGI for various income ranges: 5.1% for AGIs below $25k, 1.0% for AGIs $25k-50k)
Percentage of individuals using paid preparers for their 2012 taxes: 55.5%
Here:
55%
State:
66%
(% for various income ranges: 47.8% for AGIs below $25k, 54.8% for AGIs $25k-50k, 65.4% for AGIs $50k-75k, 64.3% for AGIs $75k-100k, 61.5% for AGIs $100k-200k, 100.0% for AGIs over 200k)
Averages for the 2004 tax year for zip code 12865, filed in 2005:
Average Adjusted Gross Income (AGI) in 2004: $36,692 (Individual Income Tax Returns)
Here:
$36,692
State:
$59,519
Salary/wage: $33,489 (reported on 80.6% of returns)
Here:
$33,489
State:
$50,673
(% of AGI for various income ranges: 120.9% for AGIs below $10k, 70.7% for AGIs $10k-25k, 79.2% for AGIs $25k-50k, 76.4% for AGIs $50k-75k, 75.7% for AGIs $75k-100k, 58.8% for AGIs over 100k)
Taxable interest for individuals: $1,257 (reported on 50.4% of returns)
This zip code:
$1,257
New York:
$2,377
(% of AGI for various income ranges: 6.8% for AGIs below $10k, 1.9% for AGIs $10k-25k, 1.2% for AGIs $25k-50k, 0.8% for AGIs $50k-75k, 1.2% for AGIs $75k-100k, 3.2% for AGIs over 100k)
Taxable dividends: $3,002 (reported on 26.0% of returns)
Here:
$3,002
State:
$5,394
(% of AGI for various income ranges: 3.7% for AGIs below $10k, 2.0% for AGIs $10k-25k, 1.6% for AGIs $25k-50k, 1.6% for AGIs $50k-75k, 2.0% for AGIs $75k-100k, 3.5% for AGIs over 100k)
Net capital gain/loss: +$7,506 (reported on 19.1% of returns)
Here:
+$7,506
State:
+$23,581
(% of AGI for various income ranges: -3.7% for AGIs below $10k, -0.2% for AGIs $10k-25k, 1.8% for AGIs $25k-50k, 0.6% for AGIs $50k-75k, 4.4% for AGIs $75k-100k, 13.5% for AGIs over 100k)
Profit/loss from business: +$8,884 (reported on 18.2% of returns)
Here:
+$8,884
State:
+$13,809
(% of AGI for various income ranges: 15.7% for AGIs below $10k, 4.9% for AGIs $10k-25k, 4.8% for AGIs $25k-50k, 2.5% for AGIs $50k-75k, 1.7% for AGIs $75k-100k, 6.8% for AGIs over 100k)
IRA payment deduction: $2,711 (reported on 2.7% of returns)
12865:
$2,711
New York:
$3,115
Total itemized deductions: $15,468 (24% of AGI, reported on 28.0% of returns)
Here:
$15,468
State:
$25,864
Here:
23.6% of AGI
State:
21.9% of AGI
(% of AGI for various income ranges: 25.3% for AGIs below $10k, 8.8% for AGIs $10k-25k, 8.5% for AGIs $25k-50k, 11.5% for AGIs $50k-75k, 15.0% for AGIs $75k-100k, 15.0% for AGIs over 100k)
Charity contributions deductions: $1,966 (3% of AGI, reported on 23.3% of returns)
Here:
$1,966
State:
$4,439
Here:
2.8% of AGI
State:
3.6% of AGI
(% of AGI for various income ranges: 0.9% for AGIs below $10k, 0.7% for AGIs $10k-25k, 0.7% for AGIs $25k-50k, 1.1% for AGIs $50k-75k, 1.5% for AGIs $75k-100k, 2.4% for AGIs over 100k)
Total tax: $4,490 (reported on 76.3% of returns)
12865:
$4,490
State:
$11,730
(% of AGI for various income ranges: 3.6% for AGIs below $10k, 4.8% for AGIs $10k-25k, 7.0% for AGIs $25k-50k, 8.6% for AGIs $50k-75k, 9.9% for AGIs $75k-100k, 16.2% for AGIs over 100k)
Earned income credit: $1,578 (reported on 15.6% of returns)
Here:
$1,578
State:
$1,757
Percentage of individuals using paid preparers for their 2004 taxes: 60.4%
Here:
60%
State:
67%
(% for various income ranges: 50.1% for AGIs below $10k, 59.7% for AGIs $10k-25k, 58.8% for AGIs $25k-50k, 67.5% for AGIs $50k-75k, 71.3% for AGIs $75k-100k, 81.0% for AGIs over 100k)
Likely homosexual households (counted as self-reported same-sex unmarried-partner households)
Lesbian couples: 0.2% of all households
Gay men: 0.8% of all households
Household received Food Stamps/SNAP in the past 12 months: 170 Household did not receive Food Stamps/SNAP in the past 12 months: 1,217
Women who had a birth in the past 12 months: 48 (43 now married, 5 unmarried) Women who did not have a birth in the past 12 months: 745 (264 now married, 482 unmarried)
Housing units in zip code 12865 with a mortgage: 483 (23 second mortgage, 24 both second mortgage and home equity loan) Houses without a mortgage: 54
Median monthly owner costs for units with a mortgage: $1,431 Median monthly owner costs for units without a mortgage: $573
Residents with income below the poverty level in 2022:
This zip code:
16.7%
Whole state:
14.3%
Residents with income below 50% of the poverty level in 2022:
This zip code:
9.0%
Whole state:
6.8%
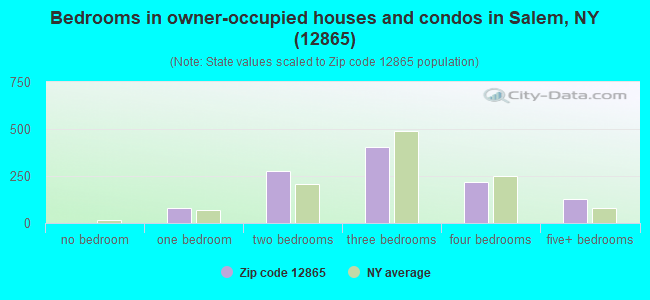
Median number of rooms in houses and condos:
Here:
6.2
State:
6.3
Median number of rooms in apartments:
Here:
5.3
State:
3.8
Notable locations in this zip code not listed on our city pages
Notable locations in zip code 12865: MacClan Farms (A), Mapleland Farm (B), Chambers Valley Farms (C), Battenkill Railroad Station (D), Chamberlin Mills (E), Washington County Jail (F), Bancroft Public Library (G). Display/hide their locations on the map
Churches in zip code 12865 include: West Hebron Presbyterian Church (A), First Presbyterian Church (B), Salem Methodist Church (C), Holy Cross Catholic Church (D), Hebron Church (E). Display/hide their locations on the map
Cemeteries: Evergreen Cemetery (1), Parish Cemetery (2), East Hebron Cemetery (3), Revolutionary War Cemetery (4), Cleveland Cemetery (5), Holy Cross Cemetery (6). Display/hide their locations on the map
Streams, rivers, and creeks: Buttermilk Falls Brook (A), Beaver Brook (B), Dry Creek (C), Flaxmill Brook (D), Blind Buck Stream (E), Black Creek (F), Dead Creek (G), Livingston Brook (H), Juniper Swamp Brook (I). Display/hide their locations on the map
In group quarters: 36 (-1 institutionalized population)
Size of family households: 396 2-persons, 195 3-persons, 135 4-persons, 87 5-persons, 21 6-persons, 6 7-or-more-persons
Size of nonfamily households: 440 1-person, 112 2-persons, 1 3-persons
394 married couples with children.
139 single-parent households (12 men, 127 women).
92.3% of residents of 12865 zip code speak English at home.
2.2% of residents speak Spanish at home (83% very well, 10% well, 7% not well).
3.0% of residents speak other Indo-European language at home (89% very well, 11% well).
2.7% of residents speak other language at home (100% very well).
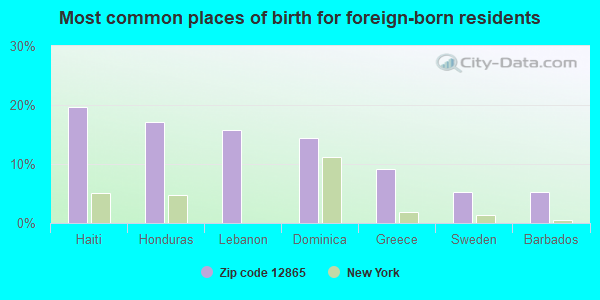
Foreign born population: 76 (2.2%) (63.5% of them are naturalized citizens)
This zip code:
2.2%
Whole state:
22.7%
20%Haiti
17%Honduras
16%Lebanon
14%Dominica
9%Greece
5%Sweden
5%Barbados
37%American
21%Irish
7%English
5%German
4%Scotch-Irish
2%Scottish
2%Lebanese
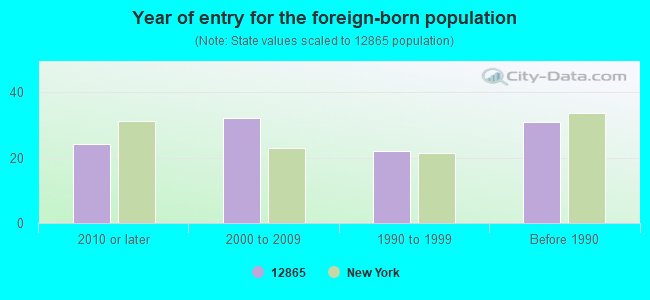
Year of entry for the foreign-born population
242010 or later
322000 to 2009
221990 to 1999
31Before 1990
Facilities with environmental interests located in this zip code:
AGWAY INCORPORATED SALEM FEED MILL (4183 RTE. 29 in SALEM, NY)
(Resource Conservation and Recovery Act (tracking hazardous waste)) TRI REPORTER (Tracking of toxic chemicals releasing facilities) Business SIC classification: PREPARED FEEDS AND FEED INGREDIENTS FOR ANIMALS AND FOWLS, EXCEPT DOGS AND CATS Alternative names: AGWAY FEED, AGWAY FEED MILL SALEM
HEBRON VALLEY PRODUCTS CORP CHARCOAL PLT (TIPLADY RD BOX 3181A in SALEM, NY)
(Resource Conservation and Recovery Act (tracking hazardous waste)) Organizations: CHARLES SWIFT (CONTACT/OPERATOR)
AGWAY INC. (RAILROAD YARD in SALEM, NY)
(Resource Conservation and Recovery Act (tracking hazardous waste))
Housing units lacking complete plumbing facilities: 3.4% Housing units lacking complete kitchen facilities: 2.6%
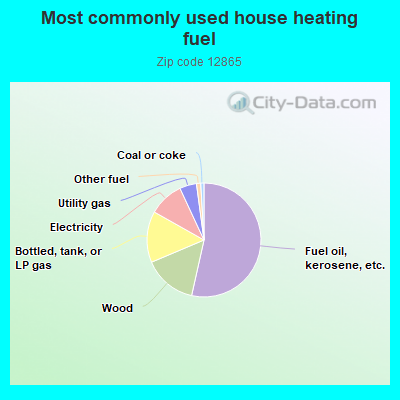
53.4%Fuel oil, kerosene, etc.
15.1%Wood
14.5%Bottled, tank, or LP gas
9.9%Electricity
4.8%Utility gas
1.2%Other fuel
0.9%Coal or coke
Population in 1990: 1,965. Population change in the 1990s: +1,187 (+60.4%).
Place of birth for U.S.-born residents:
This state: 2,426
Northeast: 552
Midwest: 51
South: 201
West: 40
70% of the 12865 zip code residents lived in the same house 5 years ago. Out of people who lived in different houses, 64% lived in this county. Out of people who lived in different counties, 50% lived in New York.
91% of the 12865 zip code residents lived in the same house 1 year ago. Out of people who lived in different houses, 60% moved from this county. Out of people who lived in different houses, 30% moved from different county within same state. Out of people who lived in different houses, 3% moved from different state. Out of people who lived in different houses, 5% moved from abroad.
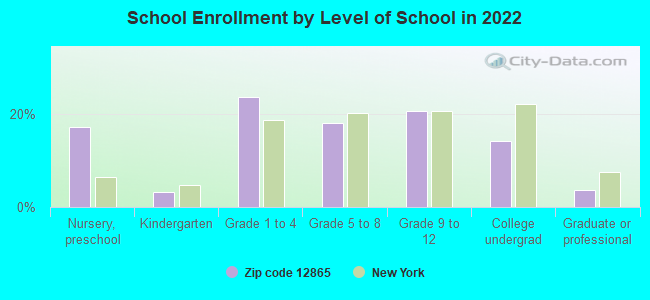
Private vs. public school enrollment:
Students in private schools in grades 1 to 8 (elementary and middle school): 29
Here:
13.1%
New York:
15.6%
Students in private schools in grades 9 to 12 (high school): 8
Here:
7.4%
New York:
15.0%
Students in private undergraduate colleges: 18
Here:
24.2%
New York:
39.2%
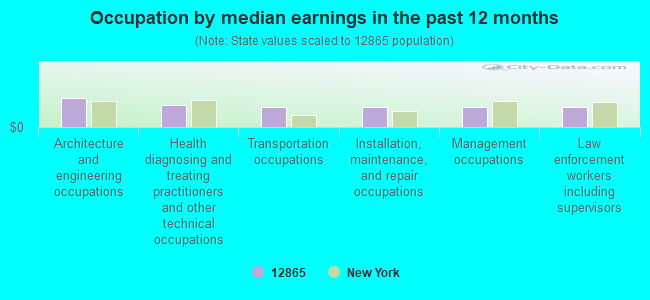
Occupation by median earnings in the past 12 months ($)
101,617Architecture and engineering occupations
74,650Health diagnosing and treating practitioners and other technical occupations
70,626Transportation occupations
70,476Installation, maintenance, and repair occupations
70,188Management occupations
68,362Law enforcement workers including supervisors
Top industries in this zip code by the number of employees in 2005:
Wholesale Trade: Farm and Garden Machinery and Equipment Merchant Wholesalers (20-49 employees: 1 establishment)
Professional, Scientific, and Technical Services: Veterinary Services (10-19: 1)
Administrative and Support and Waste Management and Remediation Services: Convention and Trade Show Organizers (10-19: 1)
Accommodation and Food Services: Limited-Service Restaurants (5-9: 1, 1-4: 2)
Finance and Insurance: Commercial Banking (5-9: 1, 1-4: 2)
Other Services (except Public Administration): General Automotive Repair (5-9: 1, 1-4: 1)
Professional, Scientific, and Technical Services: Offices of Lawyers (5-9: 1)
Accommodation and Food Services: Drinking Places (Alcoholic Beverages) (5-9: 1)
People in group quarters in 2010:
7 people in workers' group living quarters and job corps centers
3 people in group homes intended for adults
People in group quarters in 2000:
46 people in local jails and other confinement facilities (including police lockups)
10 people in homes for the mentally retarded
4 people in religious group quarters
Fatal accident statistics in 2014:
Fatal accident count: 1
Vehicles involved in fatal accidents: 1
Fatal accidents caused by drunken drivers: 0
Fatalities: 1
Persons involved in fatal accidents: 1
Pedestrians involved in fatal accidents: 0
Home Mortgage Disclosure Act Aggregated Statistics For Year 2009 (Based on 4 partial tracts)
A) FHA, FSA/RHS & VA Home Purchase Loans
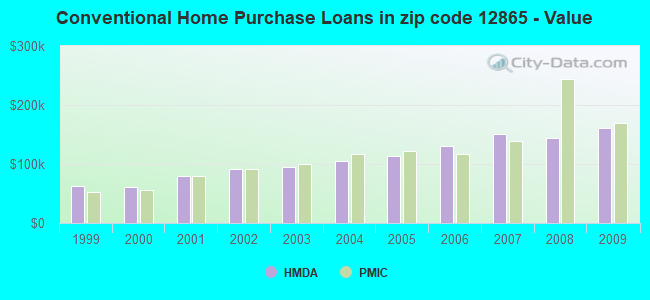
B) Conventional Home Purchase Loans
C) Refinancings
D) Home Improvement Loans
F) Non-occupant Loans on < 5 Family Dwellings (A B C & D)
G) Loans On Manufactured Home Dwelling (A B C & D)
Number
Average Value
Number
Average Value
Number
Average Value
Number
Average Value
Number
Average Value
Number
Average Value
LOANS ORIGINATED
13
$106,894
7
$160,363
63
$129,399
14
$42,439
3
$99,023
5
$88,598
APPLICATIONS APPROVED, NOT ACCEPTED
0
$0
0
$0
5
$197,292
0
$0
0
$0
0
$0
APPLICATIONS DENIED
4
$101,680
8
$96,545
41
$138,302
7
$19,519
1
$226,140
7
$104,787
APPLICATIONS WITHDRAWN
1
$73,660
1
$14,730
14
$154,721
4
$25,378
3
$71,830
1
$73,660
FILES CLOSED FOR INCOMPLETENESS
1
$56,720
0
$0
3
$177,597
1
$37,020
0
$0
0
$0
Aggregated Statistics For Year 2008 (Based on 4 partial tracts)
A) FHA, FSA/RHS & VA Home Purchase Loans
B) Conventional Home Purchase Loans
C) Refinancings
D) Home Improvement Loans
F) Non-occupant Loans on < 5 Family Dwellings (A B C & D)
G) Loans On Manufactured Home Dwelling (A B C & D)
Number
Average Value
Number
Average Value
Number
Average Value
Number
Average Value
Number
Average Value
Number
Average Value
LOANS ORIGINATED
8
$112,280
8
$144,711
42
$109,446
16
$39,440
6
$128,893
3
$116,513
APPLICATIONS APPROVED, NOT ACCEPTED
1
$88,370
7
$106,970
14
$157,764
0
$0
0
$0
5
$62,098
APPLICATIONS DENIED
1
$119,420
3
$120,463
65
$129,122
24
$55,490
9
$149,568
5
$94,426
APPLICATIONS WITHDRAWN
1
$133,320
1
$307,160
19
$129,061
0
$0
0
$0
0
$0
FILES CLOSED FOR INCOMPLETENESS
0
$0
0
$0
4
$91,305
0
$0
0
$0
0
$0
Aggregated Statistics For Year 2007 (Based on 4 partial tracts)
A) FHA, FSA/RHS & VA Home Purchase Loans
B) Conventional Home Purchase Loans
C) Refinancings
D) Home Improvement Loans
F) Non-occupant Loans on < 5 Family Dwellings (A B C & D)
G) Loans On Manufactured Home Dwelling (A B C & D)
Number
Average Value
Number
Average Value
Number
Average Value
Number
Average Value
Number
Average Value
Number
Average Value
LOANS ORIGINATED
6
$93,122
42
$150,823
58
$116,978
25
$18,814
6
$203,730
8
$61,146
APPLICATIONS APPROVED, NOT ACCEPTED
0
$0
14
$120,678
13
$133,425
6
$40,090
2
$65,315
1
$130,170
APPLICATIONS DENIED
0
$0
11
$102,976
64
$97,172
37
$44,164
7
$63,487
10
$48,686
APPLICATIONS WITHDRAWN
2
$259,140
4
$161,958
29
$107,001
8
$47,676
1
$133,750
2
$57,085
FILES CLOSED FOR INCOMPLETENESS
0
$0
2
$99,075
6
$129,637
1
$197,040
0
$0
0
$0
Aggregated Statistics For Year 2006 (Based on 4 partial tracts)
A) FHA, FSA/RHS & VA Home Purchase Loans
B) Conventional Home Purchase Loans
C) Refinancings
D) Home Improvement Loans
F) Non-occupant Loans on < 5 Family Dwellings (A B C & D)
G) Loans On Manufactured Home Dwelling (A B C & D)
Number
Average Value
Number
Average Value
Number
Average Value
Number
Average Value
Number
Average Value
Number
Average Value
LOANS ORIGINATED
5
$102,896
36
$131,307
59
$118,649
48
$37,273
14
$150,098
7
$74,654
APPLICATIONS APPROVED, NOT ACCEPTED
0
$0
9
$99,884
16
$94,844
4
$51,565
2
$351,360
2
$46,135
APPLICATIONS DENIED
1
$103,900
17
$92,245
55
$95,898
42
$46,382
4
$29,855
8
$52,562
APPLICATIONS WITHDRAWN
0
$0
8
$119,548
47
$90,808
18
$58,184
1
$315,260
2
$57,920
FILES CLOSED FOR INCOMPLETENESS
0
$0
3
$157,470
16
$118,232
3
$91,680
2
$107,480
1
$103,860
Aggregated Statistics For Year 2005 (Based on 4 partial tracts)
A) FHA, FSA/RHS & VA Home Purchase Loans
B) Conventional Home Purchase Loans
C) Refinancings
D) Home Improvement Loans
F) Non-occupant Loans on < 5 Family Dwellings (A B C & D)
G) Loans On Manufactured Home Dwelling (A B C & D)
Number
Average Value
Number
Average Value
Number
Average Value
Number
Average Value
Number
Average Value
Number
Average Value
LOANS ORIGINATED
6
$124,652
47
$113,706
53
$89,972
41
$31,941
13
$129,902
8
$47,011
APPLICATIONS APPROVED, NOT ACCEPTED
0
$0
9
$72,402
12
$86,745
4
$17,938
2
$124,195
2
$87,095
APPLICATIONS DENIED
0
$0
17
$100,448
64
$82,555
26
$46,109
1
$50,830
6
$56,510
APPLICATIONS WITHDRAWN
0
$0
6
$86,068
47
$101,234
8
$169,318
2
$47,770
2
$79,045
FILES CLOSED FOR INCOMPLETENESS
0
$0
4
$93,148
7
$91,534
1
$123,010
0
$0
1
$33,880
Aggregated Statistics For Year 2004 (Based on 4 partial tracts)
A) FHA, FSA/RHS & VA Home Purchase Loans
B) Conventional Home Purchase Loans
C) Refinancings
D) Home Improvement Loans
F) Non-occupant Loans on < 5 Family Dwellings (A B C & D)
G) Loans On Manufactured Home Dwelling (A B C & D)
Number
Average Value
Number
Average Value
Number
Average Value
Number
Average Value
Number
Average Value
Number
Average Value
LOANS ORIGINATED
9
$93,026
50
$105,193
67
$92,921
25
$27,146
12
$82,986
6
$60,012
APPLICATIONS APPROVED, NOT ACCEPTED
0
$0
14
$90,435
17
$94,015
3
$38,513
2
$132,870
1
$33,440
APPLICATIONS DENIED
2
$92,550
22
$83,479
56
$84,745
17
$29,502
3
$97,827
11
$49,168
APPLICATIONS WITHDRAWN
2
$63,805
7
$104,269
37
$104,576
3
$26,043
0
$0
1
$36,830
FILES CLOSED FOR INCOMPLETENESS
0
$0
3
$77,700
4
$102,442
2
$43,285
0
$0
0
$0
Aggregated Statistics For Year 2003 (Based on 4 partial tracts)
A) FHA, FSA/RHS & VA Home Purchase Loans
B) Conventional Home Purchase Loans
C) Refinancings
D) Home Improvement Loans
F) Non-occupant Loans on < 5 Family Dwellings (A B C & D)
Number
Average Value
Number
Average Value
Number
Average Value
Number
Average Value
Number
Average Value
LOANS ORIGINATED
4
$80,345
40
$95,399
124
$79,230
17
$17,177
14
$85,073
APPLICATIONS APPROVED, NOT ACCEPTED
0
$0
10
$80,312
25
$85,760
0
$0
0
$0
APPLICATIONS DENIED
1
$94,280
11
$59,689
69
$80,118
15
$7,517
0
$0
APPLICATIONS WITHDRAWN
0
$0
4
$164,455
40
$97,193
2
$65,680
1
$300,940
FILES CLOSED FOR INCOMPLETENESS
0
$0
2
$92,010
7
$129,079
0
$0
0
$0
Aggregated Statistics For Year 2002 (Based on 4 partial tracts)
A) FHA, FSA/RHS & VA Home Purchase Loans
B) Conventional Home Purchase Loans
C) Refinancings
D) Home Improvement Loans
F) Non-occupant Loans on < 5 Family Dwellings (A B C & D)
Number
Average Value
Number
Average Value
Number
Average Value
Number
Average Value
Number
Average Value
LOANS ORIGINATED
8
$86,271
43
$90,799
50
$78,656
16
$18,203
11
$102,622
APPLICATIONS APPROVED, NOT ACCEPTED
0
$0
5
$77,330
17
$58,311
2
$8,510
1
$29,460
APPLICATIONS DENIED
1
$48,960
9
$66,847
41
$69,908
16
$14,104
2
$52,360
APPLICATIONS WITHDRAWN
1
$64,490
7
$100,751
29
$77,489
2
$35,230
2
$45,975
FILES CLOSED FOR INCOMPLETENESS
0
$0
1
$89,560
9
$103,782
0
$0
0
$0
Aggregated Statistics For Year 2001 (Based on 4 partial tracts)
A) FHA, FSA/RHS & VA Home Purchase Loans
B) Conventional Home Purchase Loans
C) Refinancings
D) Home Improvement Loans
F) Non-occupant Loans on < 5 Family Dwellings (A B C & D)
Number
Average Value
Number
Average Value
Number
Average Value
Number
Average Value
Number
Average Value
LOANS ORIGINATED
7
$87,456
39
$80,149
65
$67,358
21
$9,144
12
$65,474
APPLICATIONS APPROVED, NOT ACCEPTED
0
$0
3
$73,200
12
$62,859
2
$17,505
1
$38,300
APPLICATIONS DENIED
0
$0
23
$65,910
44
$51,628
11
$12,359
1
$11,940
APPLICATIONS WITHDRAWN
1
$41,250
2
$127,180
32
$76,780
6
$17,085
0
$0
FILES CLOSED FOR INCOMPLETENESS
1
$152,860
0
$0
4
$73,452
0
$0
0
$0
Aggregated Statistics For Year 2000 (Based on 4 partial tracts)
A) FHA, FSA/RHS & VA Home Purchase Loans
B) Conventional Home Purchase Loans
C) Refinancings
D) Home Improvement Loans
F) Non-occupant Loans on < 5 Family Dwellings (A B C & D)
Number
Average Value
Number
Average Value
Number
Average Value
Number
Average Value
Number
Average Value
LOANS ORIGINATED
12
$70,766
32
$61,331
39
$53,925
29
$14,057
7
$59,509
APPLICATIONS APPROVED, NOT ACCEPTED
0
$0
7
$46,744
9
$67,694
4
$36,422
0
$0
APPLICATIONS DENIED
0
$0
11
$56,933
55
$55,274
10
$15,316
1
$155,250
APPLICATIONS WITHDRAWN
0
$0
4
$114,275
22
$45,988
1
$1,190
1
$127,780
FILES CLOSED FOR INCOMPLETENESS
1
$69,260
2
$87,775
1
$70,460
0
$0
0
$0
Aggregated Statistics For Year 1999 (Based on 2 partial tracts)
A) FHA, FSA/RHS & VA Home Purchase Loans
B) Conventional Home Purchase Loans
C) Refinancings
D) Home Improvement Loans
F) Non-occupant Loans on < 5 Family Dwellings (A B C & D)
Detailed PMIC statistics for the following Tracts:0860.00
, 0900.00
2002 - 2018 National Fire Incident Reporting System (NFIRS) incidents
Based on the data from the years 2002 - 2018 the average number of fires per year is 16. The highest number of reported fire incidents - 32 took place in 2010, and the least - 0 in 2003. The data has a dropping trend.
When looking into fire subcategories, the most reports belonged to: Structure Fires (55.5%), and Outside Fires (31.6%).
Fire incident types reported to NFIRS in Zip Code 12865


 Nearest zip codes: 12823, 12873, 12809, 12838, 12832, 05776.


 Based on the data from the years 2002 - 2018 the average number of fires per year is 16. The highest number of reported fire incidents - 32 took place in 2010, and the least - 0 in 2003. The data has a dropping trend.
 When looking into fire subcategories, the most reports belonged to: Structure Fires (55.5%), and Outside Fires (31.6%).