Estimated zip code population in 2022: 754 Zip code population in 2010: 719 Zip code population in 2000: 714
Houses and condos: 528 Renter-occupied apartments: 30
% of renters here:
11%
State:
46%
March 2022 cost of living index in zip code 12878: 94.4 (less than average, U.S. average is 100)
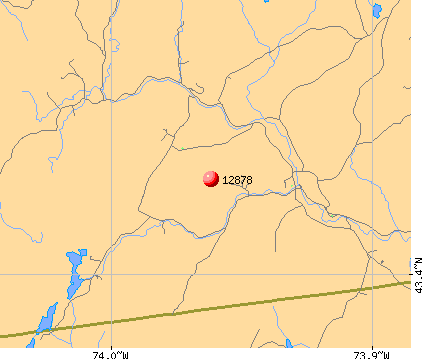
Land area: 85.6 sq. mi. Water area: 1.0 sq. mi.
Population density: 9 people per square mile
(very low).
OSM Map
General Map
Google Map
MSN Map
OSM Map
General Map
Google Map
MSN Map
OSM Map
General Map
Google Map
MSN Map
OSM Map
General Map
Google Map
MSN Map
Please wait while loading the map...
Real estate property taxes paid for housing units in 2022:
This zip code:
1.0% ($1,748)
New York:
1.5% ($6,180)
Median real estate property taxes paid for housing units with mortgages in 2022: $2,406 (1.1%) Median real estate property taxes paid for housing units with no mortgage in 2022: $1,367 (1.1%)
Business Search- 14 Million verified businesses
Males: 342
(45.4%)
Females: 412
(54.6%)
For population 25 years and over in 12878:
High school or higher: 88.9%
Bachelor's degree or higher: 10.6%
Graduate or professional degree: 4.9%
Unemployed: 4.8%
Mean travel time to work (commute): 39.0 minutes
For population 15 years and over in 12878:
Never married: 26.3%
Now married: 48.7%
Separated: 0.3%
Widowed: 4.8%
Divorced: 20.0%
Zip code 12878 compared to state average:
Median house value significantly below state average.
Black race population percentage significantly below state average.
Hispanic race population percentage significantly below state average.
Median age above state average.
Foreign-born population percentage significantly below state average.
Renting percentage significantly below state average.
Length of stay since moving in significantly above state average.
Percentage of population with a bachelor's degree or higher significantly below state average.
Averages for the 2020 tax year for zip code 12878, filed in 2021:
Average Adjusted Gross Income (AGI) in 2020: $46,717 (Individual Income Tax Returns)
Here:
$46,717
State:
$90,930
Salary/wage: $39,728 (reported on 71.4% of returns)
Here:
$39,728
State:
$72,104
(% of AGI for various income ranges: 945.6% for AGIs below $25k, 3045.7% for AGIs $25k-50k, 4732.5% for AGIs $50k-75k, 7363.3% for AGIs $75k-100k, 14235.0% for AGIs $100k-200k)
Taxable interest for individuals: $418 (reported on 31.4% of returns)
This zip code:
$418
New York:
$3,075
(% of AGI for various income ranges: 14.4% for AGIs below $25k, 30.0% for AGIs $25k-50k, 40.0% for AGIs $75k-100k)
Ordinary dividends: $1,980 (reported on 14.3% of returns)
Here:
$1,980
State:
$11,095
(% of AGI for various income ranges: 27.8% for AGIs below $25k, 246.7% for AGIs $75k-100k)
Net capital gain/loss in AGI: +$1,267 (reported on 8.6% of returns)
Here:
+$1,267
State:
+$44,925
(% of AGI for various income ranges: 42.2% for AGIs below $25k)
Profit/loss from business: +$3,350 (reported on 11.4% of returns)
Here:
+$3,350
State:
+$14,940
(% of AGI for various income ranges: 191.4% for AGIs $25k-50k)
Taxable individual retirement arrangement distribution: $7,733 (reported on 8.6% of returns)
12878:
$7,733
New York:
$19,609
(% of AGI for various income ranges: 331.4% for AGIs $25k-50k)
Earned income credit: $1,517 (reported on 17.1% of returns)
Here:
$1,517
State:
$2,138
(% of AGI for various income ranges: 101.1% for AGIs below $25k)
Percentage of individuals using paid preparers for their 2020 taxes: 94.3%
Here:
94%
State:
95%
(% for various income ranges: 92.3% for AGIs below $25k, 100.0% for AGIs $25k-50k, 100.0% for AGIs $50k-75k, 100.0% for AGIs $75k-100k, 75.0% for AGIs $100k-200k)
Averages for the 2012 tax year for zip code 12878, filed in 2013:
Average Adjusted Gross Income (AGI) in 2012: $36,130 (Individual Income Tax Returns)
Here:
$36,130
State:
$77,088
Salary/wage: $31,412 (reported on 80.0% of returns)
Here:
$31,412
State:
$60,593
(% of AGI for various income ranges: 63.0% for AGIs below $25k, 64.4% for AGIs $25k-50k, 81.9% for AGIs $50k-75k, 66.5% for AGIs $75k-100k)
Taxable interest for individuals: $300 (reported on 36.7% of returns)
This zip code:
$300
New York:
$3,125
(% of AGI for various income ranges: 1.5% for AGIs below $25k, 0.2% for AGIs $25k-50k)
Ordinary dividends: $883 (reported on 20.0% of returns)
Here:
$883
State:
$10,299
Profit/loss from business: +$3,800 (reported on 16.7% of returns)
Here:
+$3,800
State:
+$16,168
Taxable individual retirement arrangement distribution: $4,200 (reported on 10.0% of returns)
12878:
$4,200
New York:
$17,621
Total itemized deductions: $15,257 (24% of AGI, reported on 23.3% of returns)
Here:
$15,257
State:
$34,985
Here:
24.4% of AGI
State:
21.3% of AGI
Charity contributions: $2,020 (reported on 16.7% of returns)
Here:
$2,020
State:
$5,572
Taxes paid: $6,214 (reported on 23.3% of returns)
12878:
$6,214
State:
$18,656
Earned income credit: $1,533 (reported on 20.0% of returns)
Here:
$1,533
State:
$2,230
(% of AGI for various income ranges: 5.3% for AGIs below $25k)
Percentage of individuals using paid preparers for their 2012 taxes: 56.7%
Here:
57%
State:
66%
(% for various income ranges: 50.0% for AGIs below $25k, 71.4% for AGIs $25k-50k, 60.0% for AGIs $50k-75k, 50.0% for AGIs $75k-100k)
Averages for the 2004 tax year for zip code 12878, filed in 2005:
Average Adjusted Gross Income (AGI) in 2004: $29,126 (Individual Income Tax Returns)
Here:
$29,126
State:
$59,519
Salary/wage: $26,954 (reported on 84.8% of returns)
Here:
$26,954
State:
$50,673
(% of AGI for various income ranges: 83.2% for AGIs below $10k, 69.2% for AGIs $10k-25k, 76.9% for AGIs $25k-50k, 78.3% for AGIs $50k-75k, 93.2% for AGIs $75k-100k)
Taxable interest for individuals: $585 (reported on 43.7% of returns)
This zip code:
$585
New York:
$2,377
(% of AGI for various income ranges: 2.2% for AGIs below $10k, 2.8% for AGIs $10k-25k, 0.5% for AGIs $25k-50k, 0.2% for AGIs $50k-75k, 0.0% for AGIs $75k-100k)
Taxable dividends: $1,319 (reported on 22.3% of returns)
Here:
$1,319
State:
$5,394
(% of AGI for various income ranges: 1.9% for AGIs below $10k, 3.0% for AGIs $10k-25k, 0.9% for AGIs $25k-50k, 0.2% for AGIs $50k-75k)
Profit/loss from business: +$4,442 (reported on 13.9% of returns)
Here:
+$4,442
State:
+$13,809
Total itemized deductions: $12,898 (26% of AGI, reported on 19.1% of returns)
Here:
$12,898
State:
$25,864
Here:
26.0% of AGI
State:
21.9% of AGI
(% of AGI for various income ranges: 6.7% for AGIs $10k-25k, 7.3% for AGIs $25k-50k, 10.1% for AGIs $50k-75k, 12.4% for AGIs $75k-100k)
Charity contributions deductions: $1,898 (4% of AGI, reported on 15.9% of returns)
Here:
$1,898
State:
$4,439
Here:
3.9% of AGI
State:
3.6% of AGI
Total tax: $3,022 (reported on 72.2% of returns)
12878:
$3,022
State:
$11,730
(% of AGI for various income ranges: 1.9% for AGIs below $10k, 4.0% for AGIs $10k-25k, 7.3% for AGIs $25k-50k, 9.5% for AGIs $50k-75k, 10.2% for AGIs $75k-100k)
Earned income credit: $1,705 (reported on 19.7% of returns)
Here:
$1,705
State:
$1,757
Percentage of individuals using paid preparers for their 2004 taxes: 64.4%
Here:
64%
State:
67%
(% for various income ranges: 54.9% for AGIs below $10k, 66.0% for AGIs $10k-25k, 69.1% for AGIs $25k-50k, 66.7% for AGIs $50k-75k, 66.7% for AGIs $75k-100k)
Household received Food Stamps/SNAP in the past 12 months: 52 Household did not receive Food Stamps/SNAP in the past 12 months: 225
Women who had a birth in the past 12 months: 3 (3 now married, 0 unmarried) Women who did not have a birth in the past 12 months: 145 (46 now married, 99 unmarried)
Housing units in zip code 12878 with a mortgage: 94 (8 second mortgage, 6 both second mortgage and home equity loan) Median monthly owner costs for units with a mortgage: $1,475 Median monthly owner costs for units without a mortgage: $418
Residents with income below the poverty level in 2022:
This zip code:
6.5%
Whole state:
14.3%
Residents with income below 50% of the poverty level in 2022:
This zip code:
4.0%
Whole state:
6.8%
Median number of rooms in houses and condos:
Here:
6.3
State:
6.3
Median number of rooms in apartments:
Here:
3.3
State:
3.8
Notable locations in this zip code not listed on our city pages
Notable locations in zip code 12878: Stony Creek Station (A), Stony Creek Family Campground (B), One Thousand Acres Ranch Resort (C), Stony Creek Free Library (D), Stony Creek Fire House (E). Display/hide their locations on the map
Lakes, reservoirs, and swamps: Little Pond (A), Middle Flow (B), New Lake (C), Saint John Lake (D), Wilcox Lake (E), Harrisburg Lake (F), Lens Lake (G), Masher Vly (H). Display/hide their locations on the map
Streams, rivers, and creeks: Smears Creek (A), Wills Creek (B), Fodder Brook (C), Fly Creek (D), Stony Creek (E), South Brook (F), Roaring Branch (G), Dayton Creek (H), Vanauken Brook (I). Display/hide their locations on the map
Size of family households: 88 2-persons, 26 3-persons, 50 4-persons, 19 5-persons, 2 6-persons
Size of nonfamily households: 75 1-person, 12 2-persons
70 married couples with children.
15 single-parent households (15 women).
99.3% of residents of 12878 zip code speak English at home.
0.7% of residents speak other Indo-European language at home (100% very well).
Foreign born population: 8 (1.2%) (34.5% of them are naturalized citizens)
This zip code:
1.2%
Whole state:
22.7%
25%Denmark
25%Greece
30%German
14%Irish
13%American
9%English
9%Italian
3%Scottish
2%French Canadian
Year of entry for the foreign-born population
02010 or later
02000 to 2009
21990 to 1999
10Before 1990
Housing units lacking complete plumbing facilities: 14.2% Housing units lacking complete kitchen facilities: 13.8%
53.0%Fuel oil, kerosene, etc.
23.0%Wood
16.7%Bottled, tank, or LP gas
4.4%Other fuel
2.2%Electricity
1.1%Utility gas
Population in 1990: 625. Population change in the 1990s: +89 (+14.2%).
Place of birth for U.S.-born residents:
This state: 608
Northeast: 108
Midwest: 6
South: 15
73% of the 12878 zip code residents lived in the same house 5 years ago. Out of people who lived in different houses, 47% lived in this county. Out of people who lived in different counties, 50% lived in New York.
93% of the 12878 zip code residents lived in the same house 1 year ago. Out of people who lived in different houses, 76% moved from this county. Out of people who lived in different houses, 18% moved from different county within same state.
Private vs. public school enrollment:
Students in private schools in grades 1 to 8 (elementary and middle school): 4
Here:
4.5%
New York:
15.6%
Students in private schools in grades 9 to 12 (high school): 15
Here:
48.9%
New York:
15.0%
Students in private undergraduate colleges: 4
Here:
14.7%
New York:
39.2%
Occupation by median earnings in the past 12 months ($)
78,360Production occupations
73,951Business and financial operations occupations
55,483Installation, maintenance, and repair occupations
52,290Construction and extraction occupations
45,034Management occupations
34,526Healthcare support occupations
Top industries in this zip code by the number of employees in 2005:
Accommodation and Food Services: Recreational and Vacation Camps (except Campgrounds) (20-49 employees: 1 establishment)
Other Services (except Public Administration): Coin-Operated Laundries and Drycleaners (5-9: 1)
Construction: Electrical Contractors (1-4: 1)
Administrative and Support and Waste Management and Remediation Services: Tour Operators (1-4: 1)
Accommodation and Food Services: Full-Service Restaurants (1-4: 1)
Construction: Residential Remodelers (1-4: 1)
Arts, Entertainment, and Recreation: Golf Courses and Country Clubs (1-4: 1)
Accommodation and Food Services: Drinking Places (Alcoholic Beverages) (1-4: 1)
Information: Libraries and Archives (1-4: 1)
People in group quarters in 2000:
11 people in homes for the mentally retarded
Home Mortgage Disclosure Act Aggregated Statistics For Year 2009 (Based on 2 partial tracts)
A) FHA, FSA/RHS & VA Home Purchase Loans
B) Conventional Home Purchase Loans
C) Refinancings
D) Home Improvement Loans
F) Non-occupant Loans on < 5 Family Dwellings (A B C & D)
G) Loans On Manufactured Home Dwelling (A B C & D)
Number
Average Value
Number
Average Value
Number
Average Value
Number
Average Value
Number
Average Value
Number
Average Value
LOANS ORIGINATED
2
$142,770
7
$155,409
18
$134,917
7
$65,133
5
$173,946
5
$83,322
APPLICATIONS APPROVED, NOT ACCEPTED
0
$0
1
$159,150
5
$159,342
0
$0
1
$220,940
1
$159,150
APPLICATIONS DENIED
0
$0
4
$80,280
17
$171,931
5
$14,604
0
$0
3
$45,563
APPLICATIONS WITHDRAWN
1
$110,470
0
$0
7
$186,571
1
$9,360
0
$0
0
$0
FILES CLOSED FOR INCOMPLETENESS
0
$0
1
$88,940
1
$129,200
0
$0
0
$0
1
$88,940
Aggregated Statistics For Year 2008 (Based on 2 partial tracts)
A) FHA, FSA/RHS & VA Home Purchase Loans
B) Conventional Home Purchase Loans
C) Refinancings
D) Home Improvement Loans
F) Non-occupant Loans on < 5 Family Dwellings (A B C & D)
G) Loans On Manufactured Home Dwelling (A B C & D)
Number
Average Value
Number
Average Value
Number
Average Value
Number
Average Value
Number
Average Value
Number
Average Value
LOANS ORIGINATED
4
$99,705
11
$149,366
24
$120,575
10
$48,402
8
$157,632
1
$86,130
APPLICATIONS APPROVED, NOT ACCEPTED
1
$50,550
1
$36,510
3
$111,097
0
$0
0
$0
1
$36,510
APPLICATIONS DENIED
0
$0
7
$168,383
22
$113,450
22
$21,958
5
$122,830
3
$38,697
APPLICATIONS WITHDRAWN
1
$81,450
2
$207,370
8
$128,025
1
$95,490
0
$0
0
$0
FILES CLOSED FOR INCOMPLETENESS
0
$0
1
$91,750
1
$74,900
1
$60,850
1
$91,750
0
$0
Aggregated Statistics For Year 2007 (Based on 2 partial tracts)
A) FHA, FSA/RHS & VA Home Purchase Loans
B) Conventional Home Purchase Loans
C) Refinancings
D) Home Improvement Loans
F) Non-occupant Loans on < 5 Family Dwellings (A B C & D)
G) Loans On Manufactured Home Dwelling (A B C & D)
Number
Average Value
Number
Average Value
Number
Average Value
Number
Average Value
Number
Average Value
Number
Average Value
LOANS ORIGINATED
3
$92,373
12
$129,273
25
$157,843
9
$37,656
7
$146,449
6
$34,952
APPLICATIONS APPROVED, NOT ACCEPTED
0
$0
4
$81,215
5
$111,596
2
$21,065
1
$32,770
1
$48,680
APPLICATIONS DENIED
1
$83,320
5
$146,234
39
$115,657
20
$49,900
2
$76,770
6
$39,788
APPLICATIONS WITHDRAWN
2
$82,855
1
$47,750
15
$128,821
3
$50,553
1
$99,240
1
$61,790
FILES CLOSED FOR INCOMPLETENESS
1
$83,320
0
$0
3
$148,230
2
$60,855
0
$0
0
$0
Aggregated Statistics For Year 2006 (Based on 2 partial tracts)
A) FHA, FSA/RHS & VA Home Purchase Loans
B) Conventional Home Purchase Loans
C) Refinancings
D) Home Improvement Loans
F) Non-occupant Loans on < 5 Family Dwellings (A B C & D)
G) Loans On Manufactured Home Dwelling (A B C & D)
Number
Average Value
Number
Average Value
Number
Average Value
Number
Average Value
Number
Average Value
Number
Average Value
LOANS ORIGINATED
2
$121,240
16
$145,813
25
$135,524
17
$38,549
8
$234,168
6
$58,512
APPLICATIONS APPROVED, NOT ACCEPTED
1
$130,130
5
$86,692
8
$100,056
3
$60,540
6
$85,818
1
$107,660
APPLICATIONS DENIED
1
$188,180
11
$113,621
40
$99,448
22
$26,597
7
$82,119
12
$60,385
APPLICATIONS WITHDRAWN
1
$53,360
4
$71,385
22
$120,685
6
$38,540
6
$66,002
0
$0
FILES CLOSED FOR INCOMPLETENESS
0
$0
3
$48,993
3
$98,927
2
$87,535
0
$0
0
$0
Aggregated Statistics For Year 2005 (Based on 2 partial tracts)
A) FHA, FSA/RHS & VA Home Purchase Loans
B) Conventional Home Purchase Loans
C) Refinancings
D) Home Improvement Loans
F) Non-occupant Loans on < 5 Family Dwellings (A B C & D)
G) Loans On Manufactured Home Dwelling (A B C & D)
Number
Average Value
Number
Average Value
Number
Average Value
Number
Average Value
Number
Average Value
Number
Average Value
LOANS ORIGINATED
1
$88,940
11
$114,812
29
$84,129
9
$29,022
5
$127,324
7
$45,606
APPLICATIONS APPROVED, NOT ACCEPTED
0
$0
5
$80,138
5
$71,338
4
$27,385
2
$86,600
2
$63,195
APPLICATIONS DENIED
1
$119,830
11
$75,066
33
$99,010
13
$62,942
1
$46,810
13
$49,115
APPLICATIONS WITHDRAWN
2
$117,495
5
$69,654
26
$129,484
2
$79,575
4
$67,172
2
$46,810
FILES CLOSED FOR INCOMPLETENESS
0
$0
2
$86,600
7
$98,434
0
$0
2
$66,000
0
$0
Aggregated Statistics For Year 2004 (Based on 2 partial tracts)
A) FHA, FSA/RHS & VA Home Purchase Loans
B) Conventional Home Purchase Loans
C) Refinancings
D) Home Improvement Loans
F) Non-occupant Loans on < 5 Family Dwellings (A B C & D)
G) Loans On Manufactured Home Dwelling (A B C & D)
Number
Average Value
Number
Average Value
Number
Average Value
Number
Average Value
Number
Average Value
Number
Average Value
LOANS ORIGINATED
2
$122,175
12
$136,919
38
$94,655
13
$22,901
7
$128,393
3
$55,860
APPLICATIONS APPROVED, NOT ACCEPTED
0
$0
2
$64,130
7
$83,857
1
$93,620
0
$0
0
$0
APPLICATIONS DENIED
0
$0
12
$113,904
46
$78,722
11
$42,725
6
$88,783
7
$70,216
APPLICATIONS WITHDRAWN
0
$0
3
$152,600
27
$102,358
2
$60,855
3
$103,293
0
$0
FILES CLOSED FOR INCOMPLETENESS
0
$0
1
$88,940
5
$132,192
1
$74,900
0
$0
0
$0
Aggregated Statistics For Year 2003 (Based on 2 partial tracts)
B) Conventional Home Purchase Loans
C) Refinancings
D) Home Improvement Loans
F) Non-occupant Loans on < 5 Family Dwellings (A B C & D)
Number
Average Value
Number
Average Value
Number
Average Value
Number
Average Value
LOANS ORIGINATED
17
$108,214
48
$75,891
6
$6,085
7
$130,533
APPLICATIONS APPROVED, NOT ACCEPTED
2
$43,535
16
$81,332
0
$0
0
$0
APPLICATIONS DENIED
8
$98,184
32
$89,202
11
$21,873
4
$132,708
APPLICATIONS WITHDRAWN
1
$46,810
13
$101,685
1
$42,130
1
$46,810
FILES CLOSED FOR INCOMPLETENESS
0
$0
2
$130,600
2
$60,855
0
$0
Aggregated Statistics For Year 1999 (Based on 1 partial tract)
A) FHA, FSA/RHS & VA Home Purchase Loans
B) Conventional Home Purchase Loans
C) Refinancings
D) Home Improvement Loans
F) Non-occupant Loans on < 5 Family Dwellings (A B C & D)

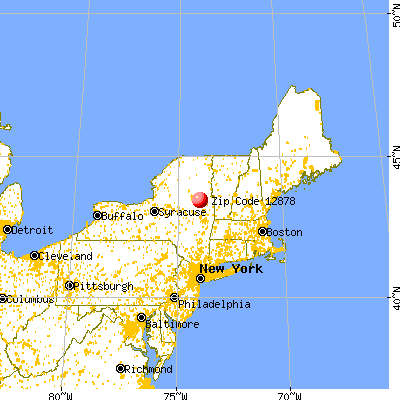


 Nearest zip codes: 12835, 12810, 12843, 12811, 12822, 12853.


