Estimated zip code population in 2022: 2,390 Zip code population in 2010: 2,842 Zip code population in 2000: 2,537
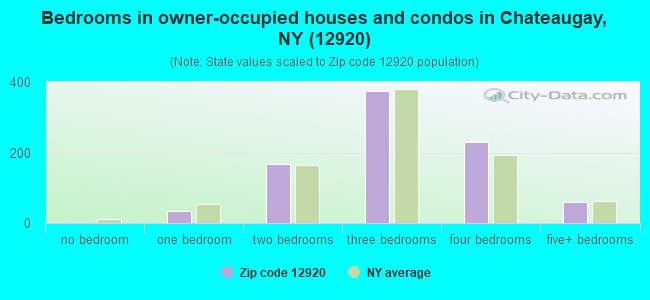
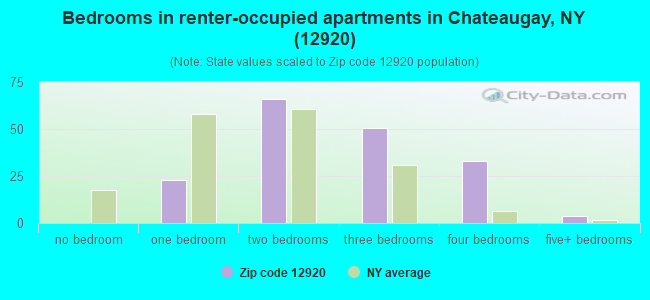
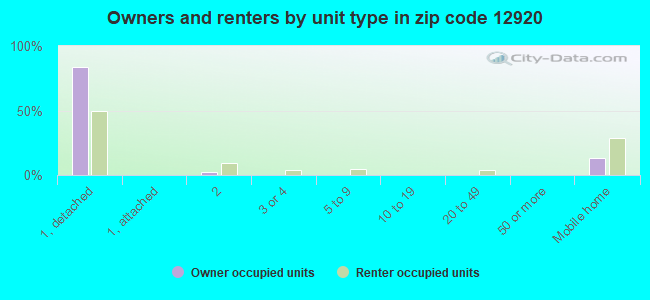
Houses and condos: 1,536 Renter-occupied apartments: 178
% of renters here:
17%
State:
46%
March 2022 cost of living index in zip code 12920: 94.0 (less than average, U.S. average is 100)
Land area: 92.8 sq. mi. Water area: 1.3 sq. mi.
Population density: 26 people per square mile
(very low).
OSM Map
General Map
Google Map
MSN Map
OSM Map
General Map
Google Map
MSN Map
OSM Map
General Map
Google Map
MSN Map
OSM Map
General Map
Google Map
MSN Map
Please wait while loading the map...
Real estate property taxes paid for housing units in 2022:
This zip code:
1.5% ($1,984)
New York:
1.5% ($6,180)
Median real estate property taxes paid for housing units with mortgages in 2022: $2,164 (1.4%) Median real estate property taxes paid for housing units with no mortgage in 2022: $1,759 (1.5%)
Business Search- 14 Million verified businesses
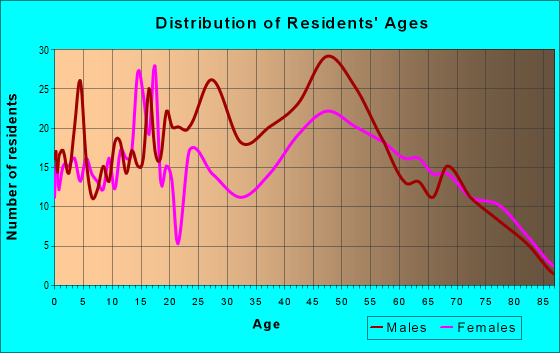
Males: 1,220
(51.1%)
Females: 1,169
(48.9%)
For population 25 years and over in 12920:
High school or higher: 89.5%
Bachelor's degree or higher: 21.8%
Graduate or professional degree: 8.1%
Unemployed: 3.7%
Mean travel time to work (commute): 25.1 minutes
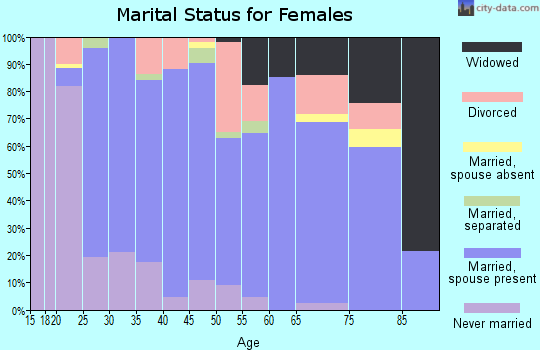
For population 15 years and over in 12920:
Never married: 27.5%
Now married: 54.0%
Separated: 3.9%
Widowed: 6.2%
Divorced: 8.5%
Zip code 12920 compared to state average:
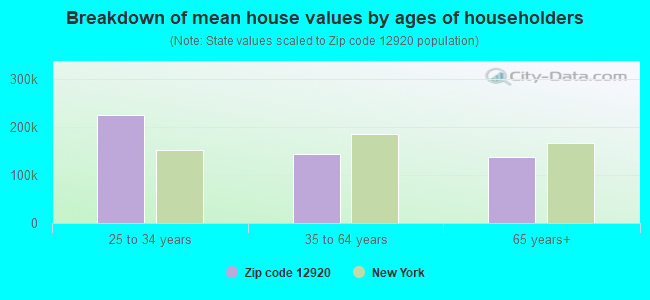
Median house value significantly below state average.
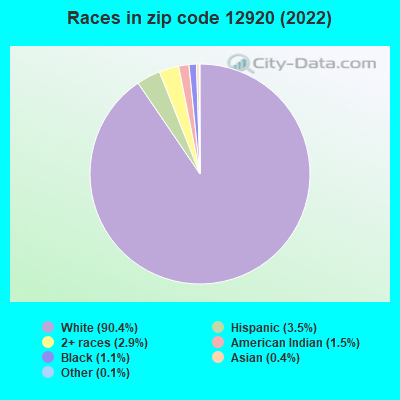
Black race population percentage significantly below state average.
Hispanic race population percentage significantly below state average.
Median age above state average.
Foreign-born population percentage significantly below state average.
Renting percentage significantly below state average.
Length of stay since moving in significantly above state average.
Number of college students significantly below state average.
Percentage of population with a bachelor's degree or higher below state average.
Averages for the 2020 tax year for zip code 12920, filed in 2021:
Average Adjusted Gross Income (AGI) in 2020: $55,614 (Individual Income Tax Returns)
Here:
$55,614
State:
$90,930
Salary/wage: $49,916 (reported on 78.4% of returns)
Here:
$49,916
State:
$72,104
(% of AGI for various income ranges: 1229.1% for AGIs below $25k, 3295.8% for AGIs $25k-50k, 5615.0% for AGIs $50k-75k, 7640.0% for AGIs $75k-100k, 17953.0% for AGIs $100k-200k)
Taxable interest for individuals: $705 (reported on 33.3% of returns)
This zip code:
$705
New York:
$3,075
(% of AGI for various income ranges: 15.2% for AGIs below $25k, 16.2% for AGIs $25k-50k, 47.1% for AGIs $50k-75k, 43.3% for AGIs $75k-100k, 82.0% for AGIs $100k-200k)
Ordinary dividends: $2,075 (reported on 14.4% of returns)
Here:
$2,075
State:
$11,095
(% of AGI for various income ranges: 31.3% for AGIs below $25k, 32.1% for AGIs $25k-50k, 47.9% for AGIs $50k-75k, 22.2% for AGIs $75k-100k, 96.0% for AGIs $100k-200k)
Net capital gain/loss in AGI: +$3,807 (reported on 12.6% of returns)
Here:
+$3,807
State:
+$44,925
(% of AGI for various income ranges: 3.5% for AGIs below $25k, 28.3% for AGIs $25k-50k, 75.0% for AGIs $50k-75k, 352.0% for AGIs $100k-200k)
Profit/loss from business: +$3,823 (reported on 11.7% of returns)
Here:
+$3,823
State:
+$14,940
(% of AGI for various income ranges: 98.3% for AGIs below $25k, 20.4% for AGIs $25k-50k, 10.0% for AGIs $50k-75k, 22.2% for AGIs $75k-100k, 188.0% for AGIs $100k-200k)
Taxable individual retirement arrangement distribution: $9,022 (reported on 8.1% of returns)
12920:
$9,022
New York:
$19,609
(% of AGI for various income ranges: 45.7% for AGIs below $25k, 150.0% for AGIs $25k-50k, 385.6% for AGIs $75k-100k)
Earned income credit: $2,069 (reported on 14.4% of returns)
Here:
$2,069
State:
$2,138
(% of AGI for various income ranges: 80.4% for AGIs below $25k, 60.8% for AGIs $25k-50k)
Percentage of individuals using paid preparers for their 2020 taxes: 96.4%
Here:
96%
State:
95%
(% for various income ranges: 96.9% for AGIs below $25k, 96.7% for AGIs $25k-50k, 94.7% for AGIs $50k-75k, 92.3% for AGIs $75k-100k, 100.0% for AGIs $100k-200k)
Averages for the 2012 tax year for zip code 12920, filed in 2013:
Average Adjusted Gross Income (AGI) in 2012: $46,618 (Individual Income Tax Returns)
Here:
$46,618
State:
$77,088
Salary/wage: $43,705 (reported on 82.5% of returns)
Here:
$43,705
State:
$60,593
(% of AGI for various income ranges: 67.3% for AGIs below $25k, 74.7% for AGIs $25k-50k, 79.3% for AGIs $50k-75k, 80.2% for AGIs $75k-100k, 79.2% for AGIs $100k-200k)
Taxable interest for individuals: $791 (reported on 34.0% of returns)
This zip code:
$791
New York:
$3,125
(% of AGI for various income ranges: 1.0% for AGIs below $25k, 0.6% for AGIs $25k-50k, 0.4% for AGIs $50k-75k, 1.1% for AGIs $75k-100k, 0.2% for AGIs $100k-200k)
Ordinary dividends: $1,693 (reported on 14.6% of returns)
Here:
$1,693
State:
$10,299
(% of AGI for various income ranges: 0.7% for AGIs below $25k, 0.9% for AGIs $25k-50k, 0.6% for AGIs $50k-75k, 0.5% for AGIs $75k-100k, 0.2% for AGIs $100k-200k)
Net capital gain/loss in AGI: +$4,700 (reported on 10.7% of returns)
Here:
+$4,700
State:
+$42,474
(% of AGI for various income ranges: 0.2% for AGIs below $25k, 1.3% for AGIs $25k-50k, 3.7% for AGIs $75k-100k)
Profit/loss from business: +$3,120 (reported on 14.6% of returns)
Here:
+$3,120
State:
+$16,168
(% of AGI for various income ranges: 6.4% for AGIs below $25k, 0.4% for AGIs $25k-50k, 1.1% for AGIs $50k-75k, 0.2% for AGIs $100k-200k)
Taxable individual retirement arrangement distribution: $8,257 (reported on 6.8% of returns)
12920:
$8,257
New York:
$17,621
(% of AGI for various income ranges: 3.1% for AGIs below $25k, 2.1% for AGIs $25k-50k, 2.4% for AGIs $50k-75k)
Total itemized deductions: $16,737 (20% of AGI, reported on 18.4% of returns)
Here:
$16,737
State:
$34,985
Here:
20.2% of AGI
State:
21.3% of AGI
(% of AGI for various income ranges: 6.2% for AGIs $25k-50k, 5.4% for AGIs $50k-75k, 7.8% for AGIs $75k-100k, 9.0% for AGIs $100k-200k)
Charity contributions: $1,779 (reported on 13.6% of returns)
Here:
$1,779
State:
$5,572
(% of AGI for various income ranges: 0.6% for AGIs $25k-50k, 0.5% for AGIs $50k-75k, 0.4% for AGIs $75k-100k, 0.7% for AGIs $100k-200k)
Taxes paid: $7,068 (reported on 18.4% of returns)
12920:
$7,068
State:
$18,656
(% of AGI for various income ranges: 1.5% for AGIs $25k-50k, 2.4% for AGIs $50k-75k, 3.0% for AGIs $75k-100k, 4.7% for AGIs $100k-200k)
Earned income credit: $1,910 (reported on 19.4% of returns)
Here:
$1,910
State:
$2,230
(% of AGI for various income ranges: 6.1% for AGIs below $25k, 1.0% for AGIs $25k-50k)
Percentage of individuals using paid preparers for their 2012 taxes: 71.8%
Here:
72%
State:
66%
(% for various income ranges: 63.2% for AGIs below $25k, 74.1% for AGIs $25k-50k, 73.3% for AGIs $50k-75k, 75.0% for AGIs $75k-100k, 90.9% for AGIs $100k-200k)
Averages for the 2004 tax year for zip code 12920, filed in 2005:
Average Adjusted Gross Income (AGI) in 2004: $35,539 (Individual Income Tax Returns)
Here:
$35,539
State:
$59,519
Salary/wage: $35,264 (reported on 81.9% of returns)
Here:
$35,264
State:
$50,673
(% of AGI for various income ranges: 146.2% for AGIs below $10k, 71.8% for AGIs $10k-25k, 85.7% for AGIs $25k-50k, 82.6% for AGIs $50k-75k, 80.4% for AGIs $75k-100k, 69.9% for AGIs over 100k)
Taxable interest for individuals: $1,008 (reported on 47.4% of returns)
This zip code:
$1,008
New York:
$2,377
(% of AGI for various income ranges: 5.5% for AGIs below $10k, 3.1% for AGIs $10k-25k, 1.9% for AGIs $25k-50k, 0.6% for AGIs $50k-75k, 0.6% for AGIs $75k-100k, 0.7% for AGIs over 100k)
Taxable dividends: $1,000 (reported on 19.5% of returns)
Here:
$1,000
State:
$5,394
(% of AGI for various income ranges: 2.8% for AGIs below $10k, 1.3% for AGIs $10k-25k, 0.4% for AGIs $25k-50k, 0.5% for AGIs $50k-75k, 0.3% for AGIs $75k-100k, 0.3% for AGIs over 100k)
Net capital gain/loss: +$6,539 (reported on 13.9% of returns)
Here:
+$6,539
State:
+$23,581
(% of AGI for various income ranges: 7.5% for AGIs below $10k, 2.0% for AGIs $10k-25k, 0.1% for AGIs $25k-50k, 2.4% for AGIs $50k-75k, -0.1% for AGIs $75k-100k, 11.4% for AGIs over 100k)
Profit/loss from business: +$2,206 (reported on 13.9% of returns)
Here:
+$2,206
State:
+$13,809
(% of AGI for various income ranges: -3.8% for AGIs below $10k, 4.0% for AGIs $10k-25k, 1.5% for AGIs $25k-50k, -0.2% for AGIs $50k-75k, 0.6% for AGIs $75k-100k)
IRA payment deduction: $2,300 (reported on 2.0% of returns)
12920:
$2,300
New York:
$3,115
Total itemized deductions: $14,193 (21% of AGI, reported on 18.4% of returns)
Here:
$14,193
State:
$25,864
Here:
21.4% of AGI
State:
21.9% of AGI
(% of AGI for various income ranges: 5.7% for AGIs $10k-25k, 6.7% for AGIs $25k-50k, 6.0% for AGIs $50k-75k, 9.8% for AGIs $75k-100k, 11.0% for AGIs over 100k)
Charity contributions deductions: $2,075 (3% of AGI, reported on 17.1% of returns)
Here:
$2,075
State:
$4,439
Here:
3.0% of AGI
State:
3.6% of AGI
(% of AGI for various income ranges: 0.5% for AGIs $10k-25k, 0.9% for AGIs $25k-50k, 0.9% for AGIs $50k-75k, 1.2% for AGIs $75k-100k, 1.7% for AGIs over 100k)
Total tax: $4,084 (reported on 75.4% of returns)
12920:
$4,084
State:
$11,730
(% of AGI for various income ranges: 5.5% for AGIs below $10k, 3.9% for AGIs $10k-25k, 6.8% for AGIs $25k-50k, 8.5% for AGIs $50k-75k, 10.7% for AGIs $75k-100k, 15.0% for AGIs over 100k)
Earned income credit: $1,469 (reported on 19.1% of returns)
Here:
$1,469
State:
$1,757
Percentage of individuals using paid preparers for their 2004 taxes: 74.7%
Here:
75%
State:
67%
(% for various income ranges: 68.3% for AGIs below $10k, 75.5% for AGIs $10k-25k, 74.5% for AGIs $25k-50k, 80.2% for AGIs $50k-75k, 80.8% for AGIs $75k-100k, 70.6% for AGIs over 100k)
Likely homosexual households (counted as self-reported same-sex unmarried-partner households)
Lesbian couples: 0.3% of all households
Gay men: 0.0% of all households
Household received Food Stamps/SNAP in the past 12 months: 160 Household did not receive Food Stamps/SNAP in the past 12 months: 885
Women who had a birth in the past 12 months: 9 (9 now married, 0 unmarried) Women who did not have a birth in the past 12 months: 512 (177 now married, 335 unmarried)
Housing units in zip code 12920 with a mortgage: 388 (47 second mortgage, 45 both second mortgage and home equity loan) Houses without a mortgage: 26
Median monthly owner costs for units with a mortgage: $1,132 Median monthly owner costs for units without a mortgage: $535
Residents with income below the poverty level in 2022:
This zip code:
18.3%
Whole state:
14.3%
Residents with income below 50% of the poverty level in 2022:
This zip code:
9.0%
Whole state:
6.8%
Median number of rooms in houses and condos:
Here:
6.4
State:
6.3
Median number of rooms in apartments:
Here:
5.6
State:
3.8
Notable locations in this zip code not listed on our city pages
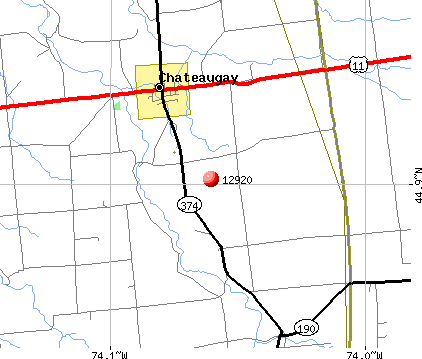
Notable locations in zip code 12920: Chateaugay State Fish Hatchery (A), Ponderosa Campsite (B), High Falls Park Campground (C), Chateaugay Port of Entry (D), Chateaugay Village Wastewater Treatment Plant (E), Brainardsville Sewer District 1 Wastewater Treatment Plant (F), Blairs Kiln (G), Chateaugay Town Hall (H), Chateaugay Fire Department (I), Chateaugay Memorial Library (J). Display/hide their locations on the map
Churches in zip code 12920 include: First Presbyterian Church (A), First Methodist Church of Chateaugay (B), Saint Patrick's Roman Catholic Church (C). Display/hide their locations on the map
Cemeteries: Brayton Hollow Cemetery (1), Brainardsville Cemetery (2), Saint Patricks Cemetery (3), Sandy Knoll Cemetery (4), Bigelow Cemetery (5), Bunker Hill Cemetery (6), Morningside Cemetery (7). Display/hide their locations on the map
Streams, rivers, and creeks: Allen Brook (A), Boardman Brook (B), Chateaugay River (C), Thurber Brook (D), Bailey Brook (E), Nay Brook (F), Marble River (G). Display/hide their locations on the map
In group quarters: 37 (-1 institutionalized population)
Size of family households: 312 2-persons, 184 3-persons, 132 4-persons, 32 5-persons, 34 6-persons, 11 7-or-more-persons
Size of nonfamily households: 278 1-person, 36 2-persons, 19 3-persons
279 married couples with children.
189 single-parent households (74 men, 115 women).
97.6% of residents of 12920 zip code speak English at home.
0.2% of residents speak Spanish at home (100% not at all).
1.7% of residents speak other Indo-European language at home (79% very well, 13% well, 8% not well).
0.4% of residents speak other language at home (100% very well).
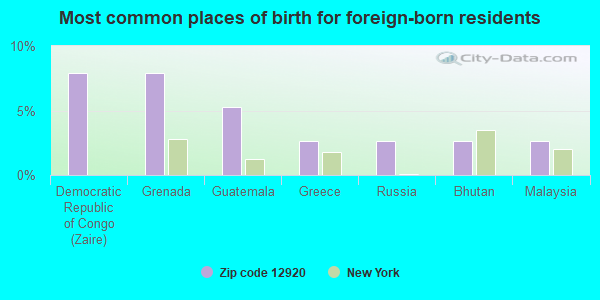
Foreign born population: 76 (3.2%) (59.7% of them are naturalized citizens)
This zip code:
3.2%
Whole state:
22.7%
8%Democratic Republic of Congo (Zaire)
8%Grenada
5%Guatemala
3%Greece
3%Russia
3%Bhutan
3%Malaysia
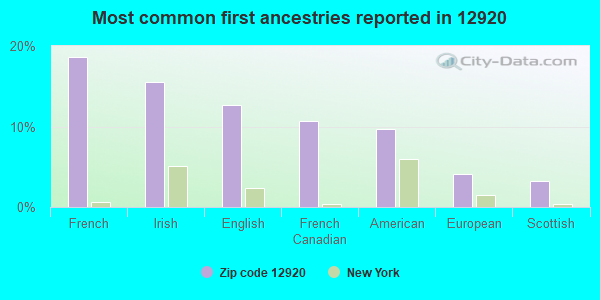
19%French
16%Irish
13%English
11%French Canadian
10%American
4%European
3%Scottish
Year of entry for the foreign-born population
282010 or later
212000 to 2009
41990 to 1999
44Before 1990
Facilities with environmental interests located in this zip code:
AGRI-MARK INC - CHATEAUGAY PLANT (39 MCCADAM LANE in CHATEAUGAY, NY)
STATE MASTER (New York facility tracking) - SOLID WASTE PROGRAM, AIR PROGRAM, National Pollutant Discharge Elimination System Permit, ENFORCEMENT/COMPLIANCE ACTIVITY (Integrated Compliance Information System) Business SIC classification: NATURAL, PROCESSED, AND IMITATION CHEESE; NONCLASSIFIABLE ESTABLISHMENTS Business NAICS classification: CHEESE MANUFACTURING. Organizations: VALIO-MCCADAM CHEESE CO INC (LEGALLY RESPONSIBLE PARTY)
Alternative names: AGRI-MARK AMD
GRASSLANDS ORGANICS (SMITH ROAD in CHATEAUGAY, NY)
ENFORCEMENT/COMPLIANCE ACTIVITY (Integrated Compliance Information System)
Housing units lacking complete plumbing facilities: 4.4% Housing units lacking complete kitchen facilities: 4.1%
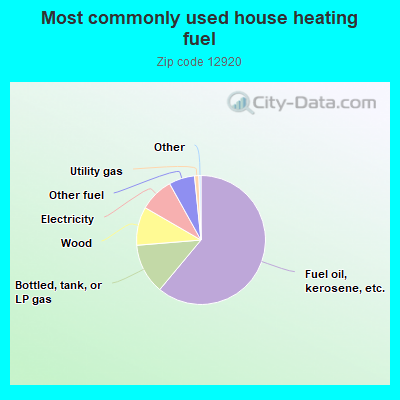
61.3%Fuel oil, kerosene, etc.
12.7%Bottled, tank, or LP gas
9.7%Wood
8.6%Electricity
6.5%Other fuel
1.1%Utility gas
Population in 1990: 2,088. Population change in the 1990s: +449 (+21.5%).
Place of birth for U.S.-born residents:
This state: 1,943
Northeast: 184
Midwest: 91
South: 39
West: 27
60% of the 12920 zip code residents lived in the same house 5 years ago. Out of people who lived in different houses, 43% lived in this county. Out of people who lived in different counties, 50% lived in New York.
92% of the 12920 zip code residents lived in the same house 1 year ago. Out of people who lived in different houses, 69% moved from this county. Out of people who lived in different houses, 20% moved from different county within same state. Out of people who lived in different houses, 4% moved from different state. Out of people who lived in different houses, 4% moved from abroad.
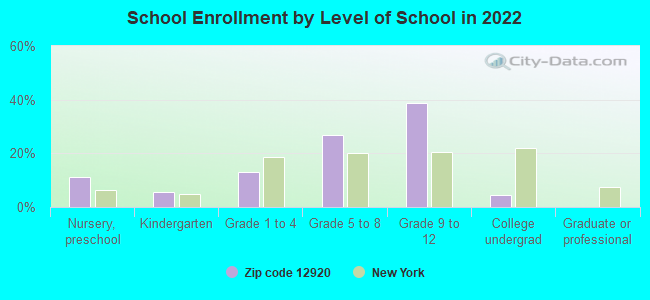
Private vs. public school enrollment:
Students in private schools in grades 1 to 8 (elementary and middle school): 23
Here:
9.6%
New York:
15.6%
Students in private schools in grades 9 to 12 (high school): 4
Here:
1.9%
New York:
15.0%
Students in private undergraduate colleges: 14
Here:
52.1%
New York:
39.2%
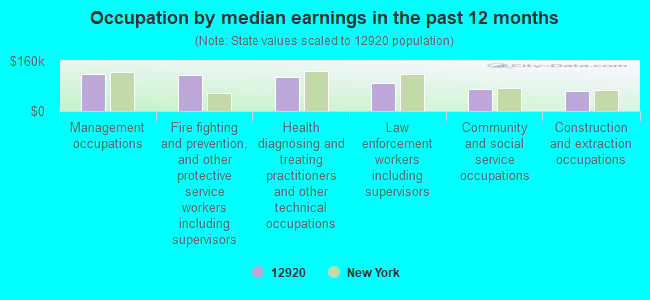
Occupation by median earnings in the past 12 months ($)
117,576Management occupations
115,765Fire fighting and prevention, and other protective service workers including supervisors
109,862Health diagnosing and treating practitioners and other technical occupations
90,422Law enforcement workers including supervisors
69,017Community and social service occupations
65,362Construction and extraction occupations
Top industries in this zip code by the number of employees in 2005:
Health Care and Social Assistance: Residential Mental Retardation Facilities (20-49 employees: 2 establishments)
Other Services (except Public Administration): Religious Organizations (5-9: 1, 1-4: 1)
Accommodation and Food Services: Full-Service Restaurants (5-9: 1, 1-4: 1)
Professional, Scientific, and Technical Services: Building Inspection Services (5-9: 1)
Health Care and Social Assistance: Offices of Physicians (except Mental Health Specialists) (5-9: 1)
Professional, Scientific, and Technical Services: Veterinary Services (5-9: 1)
People in group quarters in 2010:
201 people in state prisons
12 people in group homes for juveniles (non-correctional)
12 people in group homes intended for adults
People in group quarters in 2000:
247 people in federal prisons and detention centers
17 people in other noninstitutional group quarters
12 people in homes for the mentally retarded
Fatal accident statistics in 2014:
Fatal accident count: 1
Vehicles involved in fatal accidents: 2
Fatal accidents caused by drunken drivers: 1
Fatalities: 2
Persons involved in fatal accidents: 2
Pedestrians involved in fatal accidents: 0
2003 - 2018 National Fire Incident Reporting System (NFIRS) incidents
Based on the data from the years 2003 - 2018 the average number of fires per year is 24. The highest number of reported fires - 44 took place in 2006, and the least - 8 in 2011. The data has a growing trend.
When looking into fire subcategories, the most incidents belonged to: Structure Fires (51.7%), and Outside Fires (26.4%).
Fire incident types reported to NFIRS in Zip Code 12920


 Nearest zip codes: 12917, 12955, 12923, 12969, 12934, 12933.


 Based on the data from the years 2003 - 2018 the average number of fires per year is 24. The highest number of reported fires - 44 took place in 2006, and the least - 8 in 2011. The data has a growing trend.
 When looking into fire subcategories, the most incidents belonged to: Structure Fires (51.7%), and Outside Fires (26.4%).