Estimated zip code population in 2022: 4,642 Zip code population in 2010: 5,015 Zip code population in 2000: 4,413
Houses and condos: 2,010 Renter-occupied apartments: 503
% of renters here:
27%
State:
46%
March 2022 cost of living index in zip code 13053: 105.7 (more than average, U.S. average is 100)
Land area: 33.2 sq. mi. Water area: 0.2 sq. mi.
Population density: 140 people per square mile
(very low).
OSM Map
General Map
Google Map
MSN Map
OSM Map
General Map
Google Map
MSN Map
OSM Map
General Map
Google Map
MSN Map
OSM Map
General Map
Google Map
MSN Map
Please wait while loading the map...
Real estate property taxes paid for housing units in 2022:
This zip code:
2.6% ($5,756)
New York:
1.5% ($6,180)
Median real estate property taxes paid for housing units with mortgages in 2022: $5,871 (2.5%) Median real estate property taxes paid for housing units with no mortgage in 2022: $5,562 (2.9%)
Business Search- 14 Million verified businesses
Males: 2,123
(45.7%)
Females: 2,518
(54.3%)
For population 25 years and over in 13053:
High school or higher: 95.3%
Bachelor's degree or higher: 44.9%
Graduate or professional degree: 20.9%
Unemployed: 5.4%
Mean travel time to work (commute): 22.5 minutes
For population 15 years and over in 13053:
Never married: 34.4%
Now married: 50.1%
Separated: 3.0%
Widowed: 2.9%
Divorced: 9.6%
Zip code 13053 compared to state average:
Median house value below state average.
Black race population percentage significantly below state average.
Hispanic race population percentage significantly below state average.
Foreign-born population percentage significantly below state average.
Renting percentage below state average.
Length of stay since moving in significantly above state average.
Averages for the 2020 tax year for zip code 13053, filed in 2021:
Average Adjusted Gross Income (AGI) in 2020: $64,322 (Individual Income Tax Returns)
Here:
$64,322
State:
$90,930
Salary/wage: $53,480 (reported on 81.9% of returns)
Here:
$53,480
State:
$72,104
(% of AGI for various income ranges: 1027.7% for AGIs below $25k, 3424.2% for AGIs $25k-50k, 6423.8% for AGIs $50k-75k, 9365.7% for AGIs $75k-100k, 15813.2% for AGIs $100k-200k)
Taxable interest for individuals: $802 (reported on 40.9% of returns)
This zip code:
$802
New York:
$3,075
(% of AGI for various income ranges: 16.5% for AGIs below $25k, 20.4% for AGIs $25k-50k, 55.8% for AGIs $50k-75k, 84.3% for AGIs $75k-100k, 78.6% for AGIs $100k-200k)
Ordinary dividends: $5,143 (reported on 23.7% of returns)
Here:
$5,143
State:
$11,095
(% of AGI for various income ranges: 26.3% for AGIs below $25k, 36.9% for AGIs $25k-50k, 100.0% for AGIs $50k-75k, 186.4% for AGIs $75k-100k, 323.2% for AGIs $100k-200k)
Net capital gain/loss in AGI: +$12,450 (reported on 17.7% of returns)
Here:
+$12,450
State:
+$44,925
(% of AGI for various income ranges: 4.2% for AGIs below $25k, 34.9% for AGIs $25k-50k, 145.0% for AGIs $50k-75k, 305.7% for AGIs $75k-100k, 493.2% for AGIs $100k-200k)
Profit/loss from business: +$15,593 (reported on 12.6% of returns)
Here:
+$15,593
State:
+$14,940
(% of AGI for various income ranges: 79.3% for AGIs below $25k, 92.0% for AGIs $25k-50k, 72.9% for AGIs $50k-75k, 341.4% for AGIs $75k-100k, 610.9% for AGIs $100k-200k)
Taxable individual retirement arrangement distribution: $14,917 (reported on 10.7% of returns)
13053:
$14,917
New York:
$19,609
(% of AGI for various income ranges: 53.7% for AGIs below $25k, 96.0% for AGIs $25k-50k, 189.6% for AGIs $50k-75k, 189.3% for AGIs $75k-100k, 930.9% for AGIs $100k-200k)
Total itemized deductions: $27,877 (reported on 6.0% of returns)
Here:
$27,877
State:
$39,326
(% of AGI for various income ranges: 314.6% for AGIs $50k-75k, 467.1% for AGIs $75k-100k, 1006.8% for AGIs $100k-200k)
Charity contributions: $10,300 (reported on 4.2% of returns)
Here:
$10,300
State:
$15,420
(% of AGI for various income ranges: 51.2% for AGIs $50k-75k, 365.5% for AGIs $100k-200k)
Taxes paid: $8,700 (reported on 6.0% of returns)
13053:
$8,700
State:
$9,183
(% of AGI for various income ranges: 128.8% for AGIs $50k-75k, 135.0% for AGIs $75k-100k, 287.7% for AGIs $100k-200k)
Earned income credit: $1,830 (reported on 12.6% of returns)
Here:
$1,830
State:
$2,138
(% of AGI for various income ranges: 63.3% for AGIs below $25k, 49.3% for AGIs $25k-50k)
Percentage of individuals using paid preparers for their 2020 taxes: 94.9%
Here:
95%
State:
95%
(% for various income ranges: 94.9% for AGIs below $25k, 94.7% for AGIs $25k-50k, 94.1% for AGIs $50k-75k, 95.2% for AGIs $75k-100k, 97.3% for AGIs $100k-200k, 85.7% for AGIs over 200k)
Averages for the 2012 tax year for zip code 13053, filed in 2013:
Average Adjusted Gross Income (AGI) in 2012: $53,236 (Individual Income Tax Returns)
Here:
$53,236
State:
$77,088
Salary/wage: $45,994 (reported on 86.5% of returns)
Here:
$45,994
State:
$60,593
(% of AGI for various income ranges: 78.1% for AGIs below $25k, 79.9% for AGIs $25k-50k, 76.0% for AGIs $50k-75k, 72.7% for AGIs $75k-100k, 78.4% for AGIs $100k-200k, 57.3% for AGIs over 200k)
Taxable interest for individuals: $715 (reported on 42.2% of returns)
This zip code:
$715
New York:
$3,125
(% of AGI for various income ranges: 0.8% for AGIs below $25k, 1.0% for AGIs $25k-50k, 0.6% for AGIs $50k-75k, 0.5% for AGIs $75k-100k, 0.3% for AGIs $100k-200k, 0.6% for AGIs over 200k)
Ordinary dividends: $4,064 (reported on 22.4% of returns)
Here:
$4,064
State:
$10,299
(% of AGI for various income ranges: 1.5% for AGIs below $25k, 1.1% for AGIs $25k-50k, 1.2% for AGIs $50k-75k, 1.3% for AGIs $75k-100k, 1.8% for AGIs $100k-200k, 4.0% for AGIs over 200k)
Net capital gain/loss in AGI: +$4,989 (reported on 16.1% of returns)
Here:
+$4,989
State:
+$42,474
(% of AGI for various income ranges: 0.5% for AGIs below $25k, 1.3% for AGIs $50k-75k, 1.2% for AGIs $75k-100k, 1.3% for AGIs $100k-200k, 5.6% for AGIs over 200k)
Profit/loss from business: +$8,983 (reported on 13.5% of returns)
Here:
+$8,983
State:
+$16,168
(% of AGI for various income ranges: 6.0% for AGIs below $25k, 1.7% for AGIs $25k-50k, 2.1% for AGIs $50k-75k, 3.9% for AGIs $75k-100k, 1.6% for AGIs $100k-200k)
Taxable individual retirement arrangement distribution: $13,195 (reported on 9.9% of returns)
13053:
$13,195
New York:
$17,621
(% of AGI for various income ranges: 2.3% for AGIs below $25k, 1.9% for AGIs $25k-50k, 2.4% for AGIs $50k-75k, 2.1% for AGIs $75k-100k, 3.9% for AGIs $100k-200k)
Total itemized deductions: $19,690 (20% of AGI, reported on 32.7% of returns)
Here:
$19,690
State:
$34,985
Here:
19.8% of AGI
State:
21.3% of AGI
(% of AGI for various income ranges: 8.4% for AGIs below $25k, 7.9% for AGIs $25k-50k, 11.5% for AGIs $50k-75k, 13.2% for AGIs $75k-100k, 15.4% for AGIs $100k-200k, 11.1% for AGIs over 200k)
Charity contributions: $3,037 (reported on 25.6% of returns)
Here:
$3,037
State:
$5,572
(% of AGI for various income ranges: 0.4% for AGIs below $25k, 0.6% for AGIs $25k-50k, 1.4% for AGIs $50k-75k, 1.5% for AGIs $75k-100k, 2.2% for AGIs $100k-200k, 1.4% for AGIs over 200k)
Taxes paid: $10,536 (reported on 32.3% of returns)
13053:
$10,536
State:
$18,656
(% of AGI for various income ranges: 1.8% for AGIs below $25k, 2.8% for AGIs $25k-50k, 5.2% for AGIs $50k-75k, 7.0% for AGIs $75k-100k, 8.9% for AGIs $100k-200k, 8.5% for AGIs over 200k)
Earned income credit: $1,847 (reported on 15.2% of returns)
Here:
$1,847
State:
$2,230
(% of AGI for various income ranges: 5.0% for AGIs below $25k, 0.7% for AGIs $25k-50k)
Percentage of individuals using paid preparers for their 2012 taxes: 46.6%
Here:
47%
State:
66%
(% for various income ranges: 39.5% for AGIs below $25k, 46.0% for AGIs $25k-50k, 50.0% for AGIs $50k-75k, 56.5% for AGIs $75k-100k, 53.6% for AGIs $100k-200k, 75.0% for AGIs over 200k)
Averages for the 2004 tax year for zip code 13053, filed in 2005:
Average Adjusted Gross Income (AGI) in 2004: $44,072 (Individual Income Tax Returns)
Here:
$44,072
State:
$59,519
Salary/wage: $39,635 (reported on 87.6% of returns)
Here:
$39,635
State:
$50,673
(% of AGI for various income ranges: 149.2% for AGIs below $10k, 77.7% for AGIs $10k-25k, 82.3% for AGIs $25k-50k, 80.6% for AGIs $50k-75k, 80.6% for AGIs $75k-100k, 71.4% for AGIs over 100k)
Taxable interest for individuals: $1,041 (reported on 53.5% of returns)
This zip code:
$1,041
New York:
$2,377
(% of AGI for various income ranges: 6.8% for AGIs below $10k, 2.5% for AGIs $10k-25k, 1.2% for AGIs $25k-50k, 0.7% for AGIs $50k-75k, 1.1% for AGIs $75k-100k, 1.3% for AGIs over 100k)
Taxable dividends: $2,193 (reported on 28.2% of returns)
Here:
$2,193
State:
$5,394
(% of AGI for various income ranges: 3.9% for AGIs below $10k, 1.9% for AGIs $10k-25k, 1.0% for AGIs $25k-50k, 1.2% for AGIs $50k-75k, 1.2% for AGIs $75k-100k, 1.7% for AGIs over 100k)
Net capital gain/loss: +$6,471 (reported on 19.2% of returns)
Here:
+$6,471
State:
+$23,581
(% of AGI for various income ranges: 1.0% for AGIs below $10k, 0.5% for AGIs $10k-25k, 0.3% for AGIs $25k-50k, 1.4% for AGIs $50k-75k, 1.3% for AGIs $75k-100k, 7.1% for AGIs over 100k)
Profit/loss from business: +$8,851 (reported on 12.5% of returns)
Here:
+$8,851
State:
+$13,809
(% of AGI for various income ranges: -6.5% for AGIs below $10k, 3.3% for AGIs $10k-25k, 2.9% for AGIs $25k-50k, 2.3% for AGIs $50k-75k, 2.7% for AGIs $75k-100k, 2.4% for AGIs over 100k)
IRA payment deduction: $2,790 (reported on 2.9% of returns)
13053:
$2,790
New York:
$3,115
(% of AGI for various income ranges: 0.3% for AGIs $25k-50k, 0.1% for AGIs $50k-75k, 0.2% for AGIs $75k-100k, 0.2% for AGIs over 100k)
Self-employed pension: $7,067 (reported on 0.7% of returns)
Here:
$7,067
New York:
$19,016
Total itemized deductions: $16,007 (20% of AGI, reported on 34.3% of returns)
Here:
$16,007
State:
$25,864
Here:
20.1% of AGI
State:
21.9% of AGI
(% of AGI for various income ranges: 10.3% for AGIs $10k-25k, 9.6% for AGIs $25k-50k, 13.2% for AGIs $50k-75k, 14.8% for AGIs $75k-100k, 13.4% for AGIs over 100k)
Charity contributions deductions: $2,485 (3% of AGI, reported on 28.9% of returns)
Here:
$2,485
State:
$4,439
Here:
2.9% of AGI
State:
3.6% of AGI
(% of AGI for various income ranges: 0.7% for AGIs $10k-25k, 1.2% for AGIs $25k-50k, 1.6% for AGIs $50k-75k, 2.1% for AGIs $75k-100k, 1.9% for AGIs over 100k)
Total tax: $6,019 (reported on 77.2% of returns)
13053:
$6,019
State:
$11,730
(% of AGI for various income ranges: 2.9% for AGIs below $10k, 4.4% for AGIs $10k-25k, 7.3% for AGIs $25k-50k, 8.5% for AGIs $50k-75k, 10.0% for AGIs $75k-100k, 16.5% for AGIs over 100k)
Earned income credit: $1,359 (reported on 12.8% of returns)
Here:
$1,359
State:
$1,757
Percentage of individuals using paid preparers for their 2004 taxes: 52.7%
Here:
53%
State:
67%
(% for various income ranges: 44.5% for AGIs below $10k, 53.2% for AGIs $10k-25k, 54.2% for AGIs $25k-50k, 56.4% for AGIs $50k-75k, 54.1% for AGIs $75k-100k, 58.3% for AGIs over 100k)
Likely homosexual households (counted as self-reported same-sex unmarried-partner households)
Lesbian couples: 0.4% of all households
Gay men: 0.1% of all households
Household received Food Stamps/SNAP in the past 12 months: 290 Household did not receive Food Stamps/SNAP in the past 12 months: 1,588
Women who had a birth in the past 12 months: 45 (31 now married, 14 unmarried) Women who did not have a birth in the past 12 months: 1,141 (388 now married, 754 unmarried)
Housing units in zip code 13053 with a mortgage: 771 (115 second mortgage, 89 both second mortgage and home equity loan) Houses without a mortgage: 90
Median monthly owner costs for units with a mortgage: $1,800 Median monthly owner costs for units without a mortgage: $745
Residents with income below the poverty level in 2022:
This zip code:
21.0%
Whole state:
14.3%
Residents with income below 50% of the poverty level in 2022:
This zip code:
5.2%
Whole state:
6.8%
Median number of rooms in houses and condos:
Here:
6.7
State:
6.3
Median number of rooms in apartments:
Here:
4.0
State:
3.8
Notable locations in this zip code not listed on our city pages
Notable locations in zip code 13053: Ballard Corners (A), Dryden Village Sewage Treatment Plant (B), Sugar Bush Farms (C), Saltsman Dairy Farm (D), Dryden Lake Golf Club (E), Dryden Library (F), Dryden Fire Department (G), Neptune Hose Company 1 (H). Display/hide their locations on the map
Churches in zip code 13053 include: Dryden Assembly of God (A), Dryden United Methodist Church (B), Holy Cross Catholic Church (C), Dryden Baptist Church (D), First Presbyterian Church of Dryden (E). Display/hide their locations on the map
In group quarters: 616 (-1 institutionalized population)
Size of family households: 671 2-persons, 203 3-persons, 196 4-persons, 106 5-persons, 47 6-persons
Size of nonfamily households: 561 1-person, 95 2-persons
442 married couples with children.
323 single-parent households (64 men, 259 women).
92.9% of residents of 13053 zip code speak English at home.
1.7% of residents speak Spanish at home (100% very well).
2.4% of residents speak other Indo-European language at home (93% very well, 7% well).
2.8% of residents speak Asian or Pacific Island language at home (53% very well, 23% well, 14% not well, 11% not at all).
Foreign born population: 208 (4.5%) (49.9% of them are naturalized citizens)
This zip code:
4.5%
Whole state:
22.7%
19%Indonesia
13%China, excluding Hong Kong and Taiwan
10%Scotland
8%Italy
5%Bulgaria
3%Bhutan
2%Denmark
18%English
15%Irish
14%American
8%German
8%Italian
4%Dutch
4%European
Year of entry for the foreign-born population
902010 or later
652000 to 2009
01990 to 1999
110Before 1990
Facilities with environmental interests located in this zip code:
ACME PEST CONTROL, INC. (359 DRYDEN-HARFORD ROAD in DRYDEN, NY)
ENFORCEMENT/COMPLIANCE ACTIVITY (Integrated Compliance Information System)
INTEGRATED WATER MANAGEMENT (289 CORTLAND STREET in DRYDEN, NY)
ENFORCEMENT/COMPLIANCE ACTIVITY (Integrated Compliance Information System)
BELLS AUTO CARE (116 NORTH STREET in DRYDEN, NY)
ENFORCEMENT/COMPLIANCE ACTIVITY (Integrated Compliance Information System)
Housing units lacking complete plumbing facilities: 0.6% Housing units lacking complete kitchen facilities: 0.6%
47.0%Utility gas
23.5%Electricity
12.9%Fuel oil, kerosene, etc.
8.3%Bottled, tank, or LP gas
3.4%Wood
2.1%Coal or coke
1.4%Solar energy
0.8%Other fuel
0.7%No fuel used
Population in 1990: 4,659.
Place of birth for U.S.-born residents:
This state: 3,194
Northeast: 591
Midwest: 152
South: 254
West: 188
60% of the 13053 zip code residents lived in the same house 5 years ago. Out of people who lived in different houses, 44% lived in this county. Out of people who lived in different counties, 50% lived in New York.
91% of the 13053 zip code residents lived in the same house 1 year ago. Out of people who lived in different houses, 62% moved from this county. Out of people who lived in different houses, 13% moved from different county within same state. Out of people who lived in different houses, 23% moved from different state.
Private vs. public school enrollment:
Students in private schools in grades 1 to 8 (elementary and middle school): 12
Here:
4.8%
New York:
15.6%
Students in private schools in grades 9 to 12 (high school): 16
Here:
7.1%
New York:
15.0%
Students in private undergraduate colleges: 351
Here:
51.6%
New York:
39.2%
Occupation by median earnings in the past 12 months ($)
146,916Fire fighting and prevention, and other protective service workers including supervisors
138,449Construction and extraction occupations
101,218Computer and mathematical occupations
82,151Architecture and engineering occupations
79,351Health diagnosing and treating practitioners and other technical occupations
71,280Health technologists and technicians
Companies with federal contracts located in this zip code:
MR. FRED KRAFT (249 DRYDEN CORTLAND RD in DRYDEN, NY; small business) : $1,280,836 in 49 contractsfrom 1999 to 2006
Contracts for Lease or Rental of Facilities -- Office Buildings by Public Buildings Service Signed by year:2000: $160,000; 2001: $170,000; 2002: $225,278; 2003: $423,901; 2004: $45,981; 2005: $153,636; 2006: $62,040.
Biggest contracts:
$45,573 with Public Buildings Service for Lease or Rental of Facilities -- Office Buildings. Signed on 2003-06-15. Completion date: 2003-06-15.
$45,573, same as above.Signed on 2003-09-15. Completion date: 2003-09-15.
$45,139, same as above.Signed on 2003-09-15. Completion date: 2003-09-15.
$45,139, same as above.Signed on 2002-12-15. Completion date: 2002-12-15.
R M S GRAVEL INC (MOTT RD in DRYDEN, NY; small business) : $491,435 in 8 contractsin 2005
Contracts for Maintenance, Repair or Alteration of Real Property -- Dams, Construction of Structures and Facilities -- Other Conservation and Development Facilities, Mineral Construction Materials, Bulk by Army, Natural Resources Conservation Service, U.S. Army Corps of Engineers - civil program financing only Signed by year:2000: $0; 2001: $0; 2002: $0; 2003: $0; 2004: $0; 2005: $491,435; 2006: $0.
Biggest contracts:
$95,280 with Army for Maintenance, Repair or Alteration of Real Property -- Dams. Taking place in PA. Signed on 2005-05-24. Completion date: 2005-08-26.
$87,495 with Natural Resources Conservation Service for Construction of Structures and Facilities -- Other Conservation and Development Facilities. Signed on 2005-08-18. Effective on 2005-08-26. Completion date: 2005-09-27.
$62,950, same as above.Signed on 2005-08-18. Effective on 2005-08-22. Completion date: 2005-09-01.
$50,000 with U.S. Army Corps of Engineers - civil program financing only for Maintenance, Repair or Alteration of Real Property -- Dams. Taking place in PA. Signed on 2005-09-21. Completion date: 2005-08-26.
Top industries in this zip code by the number of employees in 2005:
Finance and Insurance: Direct Property and Casualty Insurance Carriers (50-99 employees: 1 establishment)
Detailed PMIC statistics for the following Tracts:0020.00
2003 - 2018 National Fire Incident Reporting System (NFIRS) incidents
According to the data from the years 2003 - 2018 the average number of fires per year is 20. The highest number of reported fires - 46 took place in 2008, and the least - 0 in 2009. The data has a rising trend.
When looking into fire subcategories, the most incidents belonged to: Structure Fires (62.4%), and Outside Fires (22.3%).
Fire incident types reported to NFIRS in Zip Code 13053

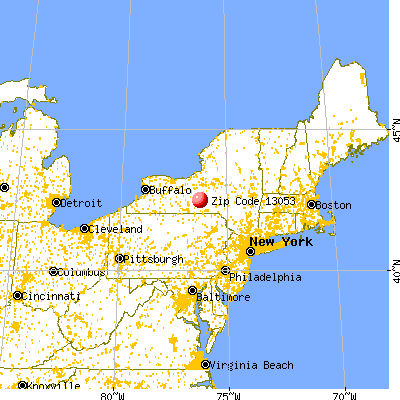


 Nearest zip codes: 13784, 13102, 13068, 13045, 13062, 14881.


 According to the data from the years 2003 - 2018 the average number of fires per year is 20. The highest number of reported fires - 46 took place in 2008, and the least - 0 in 2009. The data has a rising trend.
 When looking into fire subcategories, the most incidents belonged to: Structure Fires (62.4%), and Outside Fires (22.3%).