Estimated zip code population in 2022: 1,198 Zip code population in 2010: 1,582 Zip code population in 2000: 2,162
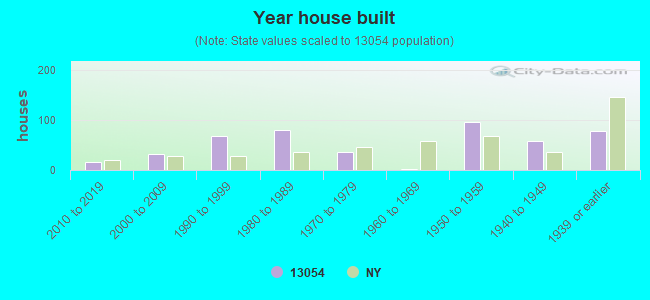
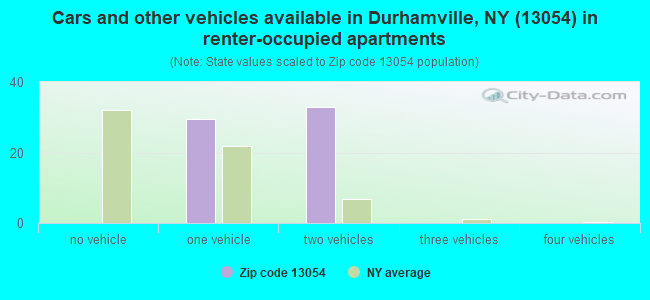
Houses and condos: 476 Renter-occupied apartments: 62
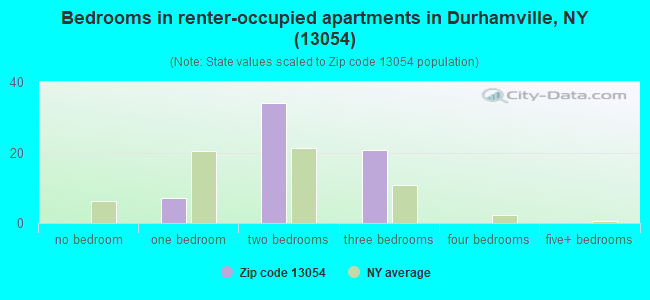
% of renters here:
15%
State:
46%
March 2022 cost of living index in zip code 13054: 94.0 (less than average, U.S. average is 100)
Land area: 22.1 sq. mi. Water area: 0.2 sq. mi.
Population density: 54 people per square mile
(very low).
OSM Map
General Map
Google Map
MSN Map
OSM Map
General Map
Google Map
MSN Map
OSM Map
General Map
Google Map
MSN Map
OSM Map
General Map
Google Map
MSN Map
Please wait while loading the map...
Real estate property taxes paid for housing units in 2022:
This zip code:
2.1% ($4,209)
New York:
1.5% ($6,180)
Median real estate property taxes paid for housing units with mortgages in 2022: $4,462 (2.2%) Median real estate property taxes paid for housing units with no mortgage in 2022: $2,963 (1.5%)
Business Search- 14 Million verified businesses
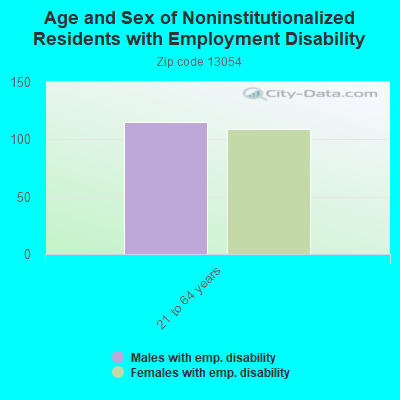
Males: 564
(47.1%)
Females: 634
(52.9%)
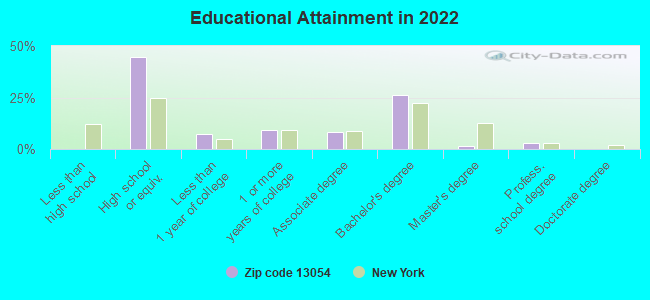
For population 25 years and over in 13054:
High school or higher: 99.5%
Bachelor's degree or higher: 30.7%
Graduate or professional degree: 4.6%
Unemployed: 2.2%
Mean travel time to work (commute): 23.0 minutes
For population 15 years and over in 13054:
Never married: 22.6%
Now married: 61.6%
Separated: 1.9%
Widowed: 4.3%
Divorced: 9.6%
Zip code 13054 compared to state average:
Median house value below state average.
Unemployed percentage below state average.
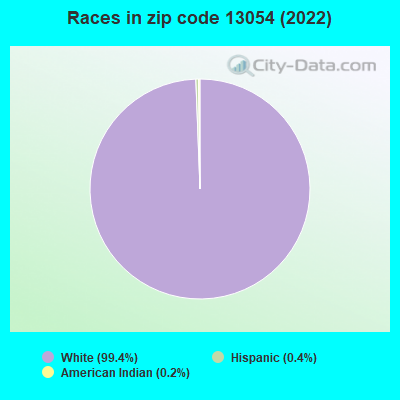
Black race population percentage significantly below state average.
Hispanic race population percentage significantly below state average.
Median age above state average.
Foreign-born population percentage significantly below state average.
Renting percentage significantly below state average.
Length of stay since moving in significantly above state average.
Averages for the 2020 tax year for zip code 13054, filed in 2021:
Average Adjusted Gross Income (AGI) in 2020: $52,642 (Individual Income Tax Returns)
Here:
$52,642
State:
$90,930
Salary/wage: $47,340 (reported on 80.3% of returns)
Here:
$47,340
State:
$72,104
(% of AGI for various income ranges: 1208.6% for AGIs below $25k, 3337.3% for AGIs $25k-50k, 6611.2% for AGIs $50k-75k, 8671.7% for AGIs $75k-100k, 16323.3% for AGIs $100k-200k)
Taxable interest for individuals: $504 (reported on 38.0% of returns)
This zip code:
$504
New York:
$3,075
(% of AGI for various income ranges: 35.0% for AGIs below $25k, 22.0% for AGIs $25k-50k, 27.5% for AGIs $50k-75k, 31.7% for AGIs $75k-100k, 21.7% for AGIs $100k-200k)
Ordinary dividends: $1,180 (reported on 14.1% of returns)
Here:
$1,180
State:
$11,095
(% of AGI for various income ranges: 25.3% for AGIs $25k-50k, 71.2% for AGIs $50k-75k, 38.3% for AGIs $100k-200k)
Net capital gain/loss in AGI: +$4,075 (reported on 11.3% of returns)
Here:
+$4,075
State:
+$44,925
(% of AGI for various income ranges: 96.7% for AGIs $25k-50k, 301.7% for AGIs $75k-100k)
Profit/loss from business: +$7,512 (reported on 11.3% of returns)
Here:
+$7,512
State:
+$14,940
(% of AGI for various income ranges: 227.3% for AGIs $25k-50k, 325.0% for AGIs $50k-75k)
Taxable individual retirement arrangement distribution: $12,760 (reported on 7.0% of returns)
13054:
$12,760
New York:
$19,609
(% of AGI for various income ranges: 227.1% for AGIs below $25k, 400.0% for AGIs $50k-75k)
Earned income credit: $2,257 (reported on 9.9% of returns)
Here:
$2,257
State:
$2,138
(% of AGI for various income ranges: 51.4% for AGIs below $25k, 57.3% for AGIs $25k-50k)
Percentage of individuals using paid preparers for their 2020 taxes: 97.2%
Here:
97%
State:
95%
(% for various income ranges: 95.0% for AGIs below $25k, 95.2% for AGIs $25k-50k, 100.0% for AGIs $50k-75k, 100.0% for AGIs $75k-100k, 100.0% for AGIs $100k-200k)
Averages for the 2012 tax year for zip code 13054, filed in 2013:
Average Adjusted Gross Income (AGI) in 2012: $41,678 (Individual Income Tax Returns)
Here:
$41,678
State:
$77,088
Salary/wage: $39,500 (reported on 83.6% of returns)
Here:
$39,500
State:
$60,593
(% of AGI for various income ranges: 72.9% for AGIs below $25k, 79.8% for AGIs $25k-50k, 78.1% for AGIs $50k-75k, 81.2% for AGIs $75k-100k, 81.3% for AGIs $100k-200k)
Taxable interest for individuals: $341 (reported on 39.7% of returns)
This zip code:
$341
New York:
$3,125
(% of AGI for various income ranges: 1.7% for AGIs below $25k, 0.1% for AGIs $25k-50k, 0.2% for AGIs $50k-75k, 0.1% for AGIs $75k-100k, 0.1% for AGIs $100k-200k)
Ordinary dividends: $564 (reported on 15.1% of returns)
Here:
$564
State:
$10,299
(% of AGI for various income ranges: 0.7% for AGIs below $25k, 0.2% for AGIs $50k-75k, 0.3% for AGIs $75k-100k)
Net capital gain/loss in AGI: +$71 (reported on 9.6% of returns)
Here:
+$71
State:
+$42,474
Profit/loss from business: +$6,471 (reported on 9.6% of returns)
Here:
+$6,471
State:
+$16,168
(% of AGI for various income ranges: 3.1% for AGIs below $25k, 3.4% for AGIs $25k-50k, 1.3% for AGIs $50k-75k)
Taxable individual retirement arrangement distribution: $7,043 (reported on 9.6% of returns)
13054:
$7,043
New York:
$17,621
Total itemized deductions: $15,578 (22% of AGI, reported on 24.7% of returns)
Here:
$15,578
State:
$34,985
Here:
21.6% of AGI
State:
21.3% of AGI
(% of AGI for various income ranges: 8.4% for AGIs $25k-50k, 9.1% for AGIs $50k-75k, 10.3% for AGIs $75k-100k, 14.3% for AGIs $100k-200k)
Charity contributions: $1,836 (reported on 15.1% of returns)
Here:
$1,836
State:
$5,572
(% of AGI for various income ranges: 1.3% for AGIs below $25k, 0.6% for AGIs $50k-75k, 0.8% for AGIs $75k-100k, 1.0% for AGIs $100k-200k)
Taxes paid: $7,033 (reported on 24.7% of returns)
13054:
$7,033
State:
$18,656
(% of AGI for various income ranges: 2.5% for AGIs $25k-50k, 4.0% for AGIs $50k-75k, 4.7% for AGIs $75k-100k, 8.0% for AGIs $100k-200k)
Earned income credit: $2,192 (reported on 16.4% of returns)
Here:
$2,192
State:
$2,230
(% of AGI for various income ranges: 5.2% for AGIs below $25k, 1.1% for AGIs $25k-50k)
Percentage of individuals using paid preparers for their 2012 taxes: 58.9%
Here:
59%
State:
66%
(% for various income ranges: 51.7% for AGIs below $25k, 60.0% for AGIs $25k-50k, 66.7% for AGIs $50k-75k, 71.4% for AGIs $75k-100k, 60.0% for AGIs $100k-200k)
Averages for the 2004 tax year for zip code 13054, filed in 2005:
Average Adjusted Gross Income (AGI) in 2004: $34,218 (Individual Income Tax Returns)
Here:
$34,218
State:
$59,519
Salary/wage: $32,592 (reported on 88.8% of returns)
Here:
$32,592
State:
$50,673
(% of AGI for various income ranges: 114.9% for AGIs below $10k, 84.2% for AGIs $10k-25k, 85.2% for AGIs $25k-50k, 82.8% for AGIs $50k-75k, 83.5% for AGIs $75k-100k, 83.2% for AGIs over 100k)
Taxable interest for individuals: $849 (reported on 41.7% of returns)
This zip code:
$849
New York:
$2,377
(% of AGI for various income ranges: 6.9% for AGIs below $10k, 1.8% for AGIs $10k-25k, 1.0% for AGIs $25k-50k, 0.7% for AGIs $50k-75k, 0.9% for AGIs $75k-100k, 0.1% for AGIs over 100k)
Taxable dividends: $512 (reported on 18.2% of returns)
Here:
$512
State:
$5,394
(% of AGI for various income ranges: 0.6% for AGIs below $10k, 0.2% for AGIs $10k-25k, 0.3% for AGIs $25k-50k, 0.4% for AGIs $50k-75k, 0.3% for AGIs $75k-100k)
Net capital gain/loss: +$557 (reported on 8.7% of returns)
Here:
+$557
State:
+$23,581
(% of AGI for various income ranges: -0.1% for AGIs $10k-25k, 0.4% for AGIs $25k-50k, 0.1% for AGIs $50k-75k, 0.1% for AGIs $75k-100k)
Profit/loss from business: +$2,932 (reported on 8.5% of returns)
Here:
+$2,932
State:
+$13,809
(% of AGI for various income ranges: 4.3% for AGIs below $10k, 3.2% for AGIs $10k-25k, 0.3% for AGIs $25k-50k, 0.6% for AGIs $50k-75k)
IRA payment deduction: $1,688 (reported on 2.3% of returns)
13054:
$1,688
New York:
$3,115
Total itemized deductions: $13,062 (21% of AGI, reported on 20.9% of returns)
Here:
$13,062
State:
$25,864
Here:
20.9% of AGI
State:
21.9% of AGI
(% of AGI for various income ranges: 4.6% for AGIs $10k-25k, 6.2% for AGIs $25k-50k, 7.7% for AGIs $50k-75k, 10.8% for AGIs $75k-100k, 14.6% for AGIs over 100k)
Charity contributions deductions: $1,355 (2% of AGI, reported on 17.8% of returns)
Here:
$1,355
State:
$4,439
Here:
2.1% of AGI
State:
3.6% of AGI
(% of AGI for various income ranges: 1.2% for AGIs below $10k, 0.6% for AGIs $25k-50k, 0.6% for AGIs $50k-75k, 0.9% for AGIs $75k-100k, 1.7% for AGIs over 100k)
Total tax: $3,702 (reported on 75.1% of returns)
13054:
$3,702
State:
$11,730
(% of AGI for various income ranges: 2.4% for AGIs below $10k, 4.2% for AGIs $10k-25k, 6.6% for AGIs $25k-50k, 7.9% for AGIs $50k-75k, 10.3% for AGIs $75k-100k, 14.9% for AGIs over 100k)
Earned income credit: $1,465 (reported on 14.5% of returns)
Here:
$1,465
State:
$1,757
Percentage of individuals using paid preparers for their 2004 taxes: 57.7%
Here:
58%
State:
67%
(% for various income ranges: 41.0% for AGIs below $10k, 58.4% for AGIs $10k-25k, 61.1% for AGIs $25k-50k, 68.8% for AGIs $50k-75k, 64.7% for AGIs $75k-100k, 61.9% for AGIs over 100k)
Household received Food Stamps/SNAP in the past 12 months: 36 Household did not receive Food Stamps/SNAP in the past 12 months: 389
Women who did not have a birth in the past 12 months: 187 (97 now married, 88 unmarried)
Housing units in zip code 13054 with a mortgage: 253 (55 second mortgage, 19 both second mortgage and home equity loan) Median monthly owner costs for units with a mortgage: $1,781 Median monthly owner costs for units without a mortgage: $654
Residents with income below the poverty level in 2022:
This zip code:
5.1%
Whole state:
14.3%
Residents with income below 50% of the poverty level in 2022:
This zip code:
4.4%
Whole state:
6.8%
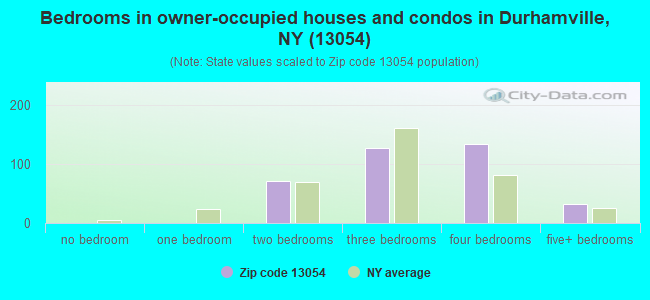
Median number of rooms in houses and condos:
Here:
7.1
State:
6.3
Median number of rooms in apartments:
Here:
4.3
State:
3.8
Notable locations in this zip code not listed on our city pages
Churches in zip code 13054 include: Irish Ridge Church (A), Saint Francis Church (B), Durhamville Baptist Church (C), Saint Francis Roman Catholic Church (D). Display/hide their locations on the map
Size of family households: 193 2-persons, 47 3-persons, 43 4-persons, 9 5-persons, 14 6-persons, 21 7-or-more-persons
Size of nonfamily households: 18 1-person, 79 2-persons, 3 3-persons
277 married couples with children.
31 single-parent households (13 men, 18 women).
99.7% of residents of 13054 zip code speak English at home.
Foreign born population: 0 (0.0%)
:
0.0%
Whole state:
22.7%
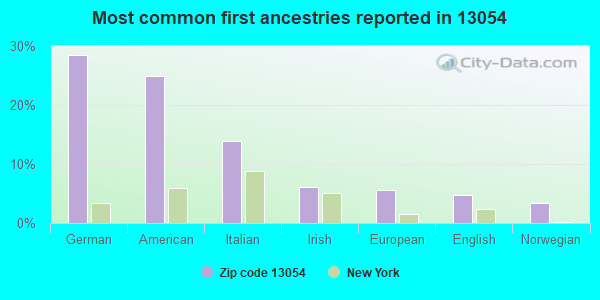
28%German
25%American
14%Italian
6%Irish
6%European
5%English
3%Norwegian
Year of entry for the foreign-born population
02010 or later
22000 to 2009
01990 to 1999
0Before 1990
Facilities with environmental interests located in this zip code:
DURHAMVILLE SCHOOL ( in DURHAMVILLE, NY)
(National Center for Education Statistics) - STATE ID-251400010002 Organizations: ONEIDA CITY SD (SCHOOL DISTRICT)
Housing units lacking complete plumbing facilities: 2.7%
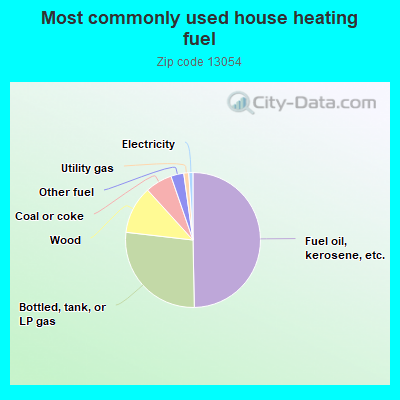
50.0%Fuel oil, kerosene, etc.
27.3%Bottled, tank, or LP gas
11.5%Wood
6.5%Coal or coke
3.1%Other fuel
1.2%Utility gas
1.0%Electricity
Population in 1990: 1,470. Population change in the 1990s: +692 (+47.1%).
Place of birth for U.S.-born residents:
This state: 1,084
Northeast: 7
Midwest: 36
South: 43
West: 19
79% of the 13054 zip code residents lived in the same house 5 years ago. Out of people who lived in different houses, 56% lived in this county. Out of people who lived in different counties, 50% lived in New York.
95% of the 13054 zip code residents lived in the same house 1 year ago. Out of people who lived in different houses, 93% moved from this county.
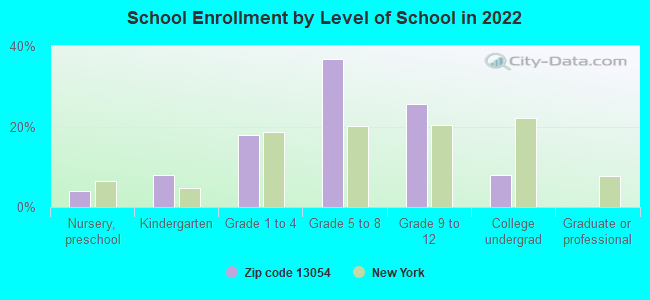
Private vs. public school enrollment:
Students in private schools in grades 1 to 8 (elementary and middle school): 19
Here:
10.4%
New York:
15.6%
Students in private schools in grades 9 to 12 (high school): 26
Here:
30.0%
New York:
15.0%
Students in private undergraduate colleges: 2
Here:
10.7%
New York:
39.2%
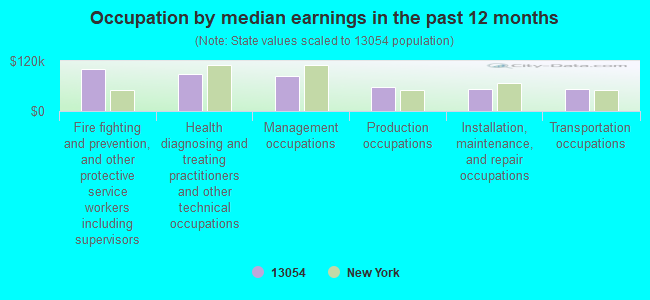
Occupation by median earnings in the past 12 months ($)
101,600Fire fighting and prevention, and other protective service workers including supervisors
89,453Health diagnosing and treating practitioners and other technical occupations
83,234Management occupations
56,478Production occupations
53,742Installation, maintenance, and repair occupations
53,455Transportation occupations
Companies with federal contracts located in this zip code:
PRO-TECH RESOURCES (5272 ONEIDA ST in DURHAMVILLE, NY; small business) : $186,252 in 4 contractsfrom 2002 to 2005
$54,996 with Air Force for Other Professional Services. Signed on 2005-08-29. Completion date: 2006-08-31.
$46,584, same as above.Signed on 2004-05-07. Completion date: 2005-08-31.
$45,000, same as above.Signed on 2003-08-25. Completion date: 2004-08-31.
$39,672, same as above.Signed on 2002-08-15. Completion date: 2003-08-31.
Top industries in this zip code by the number of employees in 2005:
Wholesale Trade: Sporting and Recreational Goods and Supplies Merchant Wholesalers (5-9 employees: 1 establishment)
Other Services (except Public Administration): Civic and Social Organizations (5-9: 1)
Administrative and Support and Waste Management and Remediation Services: Landscaping Services (1-4: 2)
Construction: Residential Remodelers (1-4: 1)
Arts, Entertainment, and Recreation: Golf Courses and Country Clubs (1-4: 1)
Fatal accident statistics in 2011:
Fatal accident count: 1
Vehicles involved in fatal accidents: 1
Fatal accidents caused by drunken drivers: 0
Fatalities: 1
Persons involved in fatal accidents: 1
Pedestrians involved in fatal accidents: 1
Home Mortgage Disclosure Act Aggregated Statistics For Year 2009 (Based on 2 partial tracts)
A) FHA, FSA/RHS & VA Home Purchase Loans
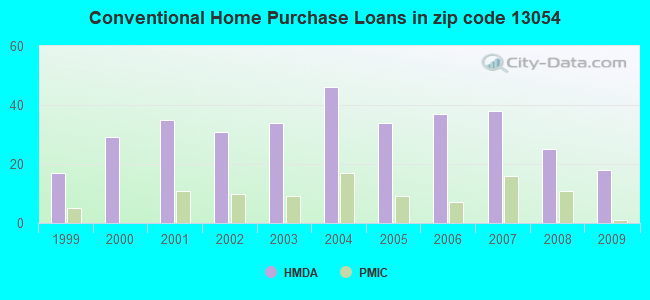
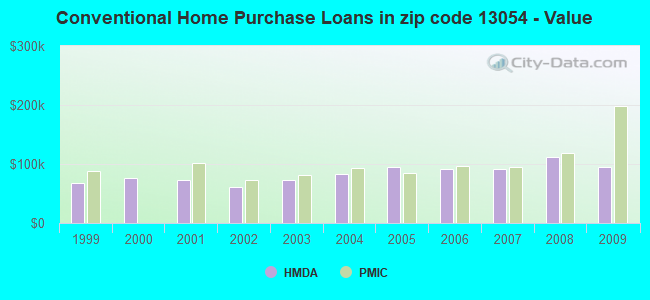
B) Conventional Home Purchase Loans
C) Refinancings
D) Home Improvement Loans
F) Non-occupant Loans on < 5 Family Dwellings (A B C & D)
G) Loans On Manufactured Home Dwelling (A B C & D)
Number
Average Value
Number
Average Value
Number
Average Value
Number
Average Value
Number
Average Value
Number
Average Value
LOANS ORIGINATED
16
$107,941
18
$95,661
55
$103,929
29
$17,683
2
$57,100
4
$30,025
APPLICATIONS APPROVED, NOT ACCEPTED
1
$87,680
3
$96,030
2
$166,515
2
$67,415
1
$160,620
1
$50,840
APPLICATIONS DENIED
2
$102,045
1
$82,520
24
$114,296
13
$31,569
1
$198,200
3
$103,153
APPLICATIONS WITHDRAWN
1
$84,730
1
$23,580
8
$106,468
1
$70,000
1
$48,630
0
$0
FILES CLOSED FOR INCOMPLETENESS
0
$0
1
$184,200
1
$47,890
0
$0
0
$0
0
$0
Aggregated Statistics For Year 2008 (Based on 2 partial tracts)
A) FHA, FSA/RHS & VA Home Purchase Loans
B) Conventional Home Purchase Loans
C) Refinancings
D) Home Improvement Loans
F) Non-occupant Loans on < 5 Family Dwellings (A B C & D)
G) Loans On Manufactured Home Dwelling (A B C & D)
Number
Average Value
Number
Average Value
Number
Average Value
Number
Average Value
Number
Average Value
Number
Average Value
LOANS ORIGINATED
16
$90,811
25
$112,112
45
$87,319
27
$18,584
5
$75,300
4
$67,602
APPLICATIONS APPROVED, NOT ACCEPTED
1
$83,260
4
$104,810
7
$79,996
4
$38,498
0
$0
4
$90,810
APPLICATIONS DENIED
2
$150,675
6
$75,522
46
$108,085
32
$24,153
3
$40,280
3
$52,560
APPLICATIONS WITHDRAWN
2
$94,680
3
$128,693
15
$128,203
2
$28,365
1
$59,680
1
$80,310
FILES CLOSED FOR INCOMPLETENESS
0
$0
1
$73,680
2
$121,570
0
$0
1
$38,310
0
$0
Aggregated Statistics For Year 2007 (Based on 2 partial tracts)
A) FHA, FSA/RHS & VA Home Purchase Loans
B) Conventional Home Purchase Loans
C) Refinancings
D) Home Improvement Loans
E) Loans on Dwellings For 5+ Families
F) Non-occupant Loans on < 5 Family Dwellings (A B C & D)
G) Loans On Manufactured Home Dwelling (A B C & D)
Number
Average Value
Number
Average Value
Number
Average Value
Number
Average Value
Number
Average Value
Number
Average Value
Number
Average Value
LOANS ORIGINATED
13
$108,593
38
$92,022
49
$76,567
41
$31,179
1
$153,250
9
$62,219
8
$53,050
APPLICATIONS APPROVED, NOT ACCEPTED
0
$0
7
$74,627
12
$69,382
4
$27,630
0
$0
2
$49,365
2
$40,525
APPLICATIONS DENIED
2
$90,995
15
$79,083
60
$81,502
53
$23,452
0
$0
5
$88,416
7
$34,946
APPLICATIONS WITHDRAWN
1
$41,260
4
$69,812
41
$108,184
6
$56,242
0
$0
1
$47,160
1
$80,310
FILES CLOSED FOR INCOMPLETENESS
0
$0
1
$123,050
3
$127,220
0
$0
0
$0
1
$61,150
0
$0
Aggregated Statistics For Year 2006 (Based on 2 partial tracts)
A) FHA, FSA/RHS & VA Home Purchase Loans
B) Conventional Home Purchase Loans
C) Refinancings
D) Home Improvement Loans
E) Loans on Dwellings For 5+ Families
F) Non-occupant Loans on < 5 Family Dwellings (A B C & D)
G) Loans On Manufactured Home Dwelling (A B C & D)
Number
Average Value
Number
Average Value
Number
Average Value
Number
Average Value
Number
Average Value
Number
Average Value
Number
Average Value
LOANS ORIGINATED
18
$100,205
37
$91,881
62
$74,548
36
$21,244
1
$77,360
7
$108,414
6
$55,752
APPLICATIONS APPROVED, NOT ACCEPTED
0
$0
9
$72,124
18
$94,188
2
$39,420
0
$0
2
$126,360
2
$56,365
APPLICATIONS DENIED
1
$63,360
13
$76,627
69
$83,312
36
$34,711
0
$0
4
$86,022
10
$73,385
APPLICATIONS WITHDRAWN
2
$102,415
6
$79,083
32
$82,314
4
$67,050
0
$0
0
$0
1
$116,410
FILES CLOSED FOR INCOMPLETENESS
0
$0
1
$98,730
6
$117,520
1
$100,200
0
$0
0
$0
0
$0
Aggregated Statistics For Year 2005 (Based on 2 partial tracts)
A) FHA, FSA/RHS & VA Home Purchase Loans
B) Conventional Home Purchase Loans
C) Refinancings
D) Home Improvement Loans
E) Loans on Dwellings For 5+ Families
F) Non-occupant Loans on < 5 Family Dwellings (A B C & D)
G) Loans On Manufactured Home Dwelling (A B C & D)
Number
Average Value
Number
Average Value
Number
Average Value
Number
Average Value
Number
Average Value
Number
Average Value
Number
Average Value
LOANS ORIGINATED
10
$85,027
34
$95,091
61
$79,997
43
$25,188
1
$70,000
4
$37,392
6
$43,472
APPLICATIONS APPROVED, NOT ACCEPTED
0
$0
4
$56,550
16
$80,127
4
$31,498
0
$0
0
$0
1
$83,260
APPLICATIONS DENIED
1
$76,630
8
$61,155
75
$86,432
31
$25,075
0
$0
4
$46,602
10
$59,754
APPLICATIONS WITHDRAWN
2
$99,100
4
$101,495
68
$95,383
5
$154,728
0
$0
2
$95,785
3
$49,857
FILES CLOSED FOR INCOMPLETENESS
1
$104,630
1
$19,160
13
$94,027
1
$25,790
0
$0
1
$19,160
0
$0
Aggregated Statistics For Year 2004 (Based on 2 partial tracts)
A) FHA, FSA/RHS & VA Home Purchase Loans
B) Conventional Home Purchase Loans
C) Refinancings
D) Home Improvement Loans
F) Non-occupant Loans on < 5 Family Dwellings (A B C & D)
G) Loans On Manufactured Home Dwelling (A B C & D)
Number
Average Value
Number
Average Value
Number
Average Value
Number
Average Value
Number
Average Value
Number
Average Value
LOANS ORIGINATED
14
$75,259
46
$83,611
60
$80,716
37
$29,611
11
$70,934
5
$48,776
APPLICATIONS APPROVED, NOT ACCEPTED
0
$0
6
$71,715
9
$89,071
5
$23,872
1
$37,580
1
$92,840
APPLICATIONS DENIED
1
$177,570
11
$59,681
69
$75,527
24
$22,104
3
$71,223
14
$53,524
APPLICATIONS WITHDRAWN
0
$0
4
$78,838
44
$83,325
7
$61,154
2
$145,150
4
$58,392
FILES CLOSED FOR INCOMPLETENESS
1
$36,840
1
$115,680
5
$108,900
1
$14,740
1
$219,570
0
$0
Aggregated Statistics For Year 2003 (Based on 2 partial tracts)
A) FHA, FSA/RHS & VA Home Purchase Loans
B) Conventional Home Purchase Loans
C) Refinancings
D) Home Improvement Loans
F) Non-occupant Loans on < 5 Family Dwellings (A B C & D)
Number
Average Value
Number
Average Value
Number
Average Value
Number
Average Value
Number
Average Value
LOANS ORIGINATED
11
$81,517
34
$73,181
111
$80,298
21
$21,472
4
$47,155
APPLICATIONS APPROVED, NOT ACCEPTED
0
$0
5
$47,302
16
$76,904
2
$25,050
3
$52,313
APPLICATIONS DENIED
1
$68,520
8
$56,550
77
$75,976
9
$23,004
1
$81,780
APPLICATIONS WITHDRAWN
1
$78,100
4
$104,995
52
$84,491
1
$4,420
1
$120,840
FILES CLOSED FOR INCOMPLETENESS
0
$0
0
$0
4
$77,180
3
$28,243
0
$0
Aggregated Statistics For Year 2002 (Based on 2 partial tracts)
A) FHA, FSA/RHS & VA Home Purchase Loans
B) Conventional Home Purchase Loans
C) Refinancings
D) Home Improvement Loans
F) Non-occupant Loans on < 5 Family Dwellings (A B C & D)
Number
Average Value
Number
Average Value
Number
Average Value
Number
Average Value
Number
Average Value
LOANS ORIGINATED
19
$72,788
31
$61,844
89
$71,089
35
$17,578
3
$62,873
APPLICATIONS APPROVED, NOT ACCEPTED
0
$0
3
$47,647
12
$67,294
5
$16,062
1
$18,420
APPLICATIONS DENIED
3
$64,100
9
$74,908
61
$65,913
13
$14,112
2
$61,890
APPLICATIONS WITHDRAWN
0
$0
1
$142,200
55
$72,970
10
$22,914
0
$0
FILES CLOSED FOR INCOMPLETENESS
0
$0
1
$47,160
7
$61,576
0
$0
0
$0
Aggregated Statistics For Year 2001 (Based on 2 partial tracts)
A) FHA, FSA/RHS & VA Home Purchase Loans
B) Conventional Home Purchase Loans
C) Refinancings
D) Home Improvement Loans
F) Non-occupant Loans on < 5 Family Dwellings (A B C & D)
Number
Average Value
Number
Average Value
Number
Average Value
Number
Average Value
Number
Average Value
LOANS ORIGINATED
13
$68,409
35
$73,069
62
$70,935
36
$10,622
1
$92,840
APPLICATIONS APPROVED, NOT ACCEPTED
0
$0
8
$46,971
12
$70,488
4
$35,735
2
$22,105
APPLICATIONS DENIED
2
$68,520
21
$45,962
41
$56,860
19
$27,029
2
$135,940
APPLICATIONS WITHDRAWN
2
$78,470
1
$104,630
37
$75,651
4
$25,605
0
$0
FILES CLOSED FOR INCOMPLETENESS
0
$0
0
$0
5
$73,828
1
$8,100
0
$0
Aggregated Statistics For Year 2000 (Based on 2 partial tracts)
A) FHA, FSA/RHS & VA Home Purchase Loans
B) Conventional Home Purchase Loans
C) Refinancings
D) Home Improvement Loans
E) Loans on Dwellings For 5+ Families
F) Non-occupant Loans on < 5 Family Dwellings (A B C & D)
Number
Average Value
Number
Average Value
Number
Average Value
Number
Average Value
Number
Average Value
Number
Average Value
LOANS ORIGINATED
11
$77,900
29
$77,059
35
$51,408
21
$15,473
0
$0
4
$59,865
APPLICATIONS APPROVED, NOT ACCEPTED
0
$0
6
$62,873
6
$57,962
4
$21,182
0
$0
0
$0
APPLICATIONS DENIED
1
$42,000
28
$42,919
43
$48,577
15
$23,332
0
$0
3
$47,893
APPLICATIONS WITHDRAWN
0
$0
4
$75,522
23
$51,897
1
$27,260
1
$14,740
1
$45,680
FILES CLOSED FOR INCOMPLETENESS
0
$0
1
$70,730
3
$38,067
1
$47,890
0
$0
1
$25,790
Aggregated Statistics For Year 1999 (Based on 1 partial tract)
A) FHA, FSA/RHS & VA Home Purchase Loans
B) Conventional Home Purchase Loans
C) Refinancings
D) Home Improvement Loans
F) Non-occupant Loans on < 5 Family Dwellings (A B C & D)


 Nearest zip codes: 13162, 13157, 13308, 13478, 13163, 13421.