Estimated zip code population in 2022: 4,382 Zip code population in 2010: 4,488 Zip code population in 2000: 4,340
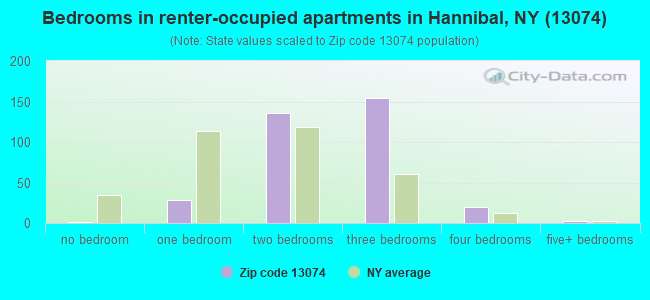
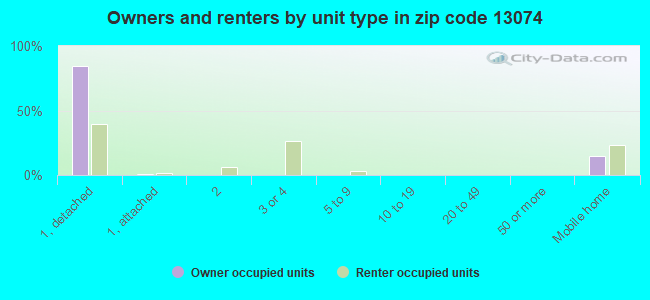
Houses and condos: 1,932 Renter-occupied apartments: 345
% of renters here:
19%
State:
46%
March 2022 cost of living index in zip code 13074: 94.2 (less than average, U.S. average is 100)
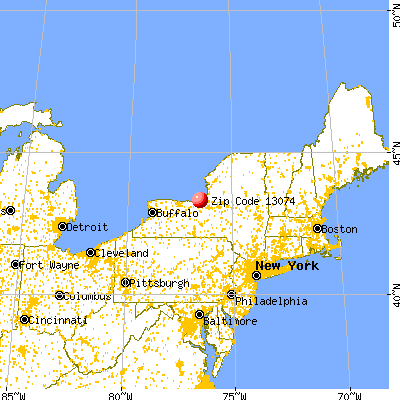
Land area: 42.5 sq. mi. Water area: 0.2 sq. mi.
Population density: 103 people per square mile
(very low).
OSM Map
General Map
Google Map
MSN Map
OSM Map
General Map
Google Map
MSN Map
OSM Map
General Map
Google Map
MSN Map
OSM Map
General Map
Google Map
MSN Map
Please wait while loading the map...
Real estate property taxes paid for housing units in 2022:
This zip code:
1.9% ($2,520)
New York:
1.5% ($6,180)
Median real estate property taxes paid for housing units with mortgages in 2022: $3,047 (2.0%) Median real estate property taxes paid for housing units with no mortgage in 2022: $1,882 (2.1%)
Averages for the 2020 tax year for zip code 13074, filed in 2021:
Average Adjusted Gross Income (AGI) in 2020: $52,118 (Individual Income Tax Returns)
Here:
$52,118
State:
$90,930
Salary/wage: $45,868 (reported on 82.6% of returns)
Here:
$45,868
State:
$72,104
(% of AGI for various income ranges: 1102.3% for AGIs below $25k, 3291.4% for AGIs $25k-50k, 6005.8% for AGIs $50k-75k, 9282.0% for AGIs $75k-100k, 14847.1% for AGIs $100k-200k)
Taxable interest for individuals: $369 (reported on 30.5% of returns)
This zip code:
$369
New York:
$3,075
(% of AGI for various income ranges: 5.0% for AGIs below $25k, 12.7% for AGIs $25k-50k, 15.8% for AGIs $50k-75k, 24.0% for AGIs $75k-100k, 44.3% for AGIs $100k-200k)
Ordinary dividends: $1,648 (reported on 11.1% of returns)
Here:
$1,648
State:
$11,095
(% of AGI for various income ranges: 7.7% for AGIs below $25k, 5.2% for AGIs $25k-50k, 42.5% for AGIs $50k-75k, 30.7% for AGIs $75k-100k, 100.7% for AGIs $100k-200k)
Net capital gain/loss in AGI: +$4,241 (reported on 8.9% of returns)
Here:
+$4,241
State:
+$44,925
(% of AGI for various income ranges: 5.9% for AGIs below $25k, 8.0% for AGIs $25k-50k, 72.5% for AGIs $50k-75k, 136.7% for AGIs $75k-100k, 200.7% for AGIs $100k-200k)
Profit/loss from business: +$7,355 (reported on 10.5% of returns)
Here:
+$7,355
State:
+$14,940
(% of AGI for various income ranges: 89.5% for AGIs below $25k, 98.4% for AGIs $25k-50k, 69.2% for AGIs $50k-75k, 46.0% for AGIs $75k-100k, 292.1% for AGIs $100k-200k)
Taxable individual retirement arrangement distribution: $18,762 (reported on 8.4% of returns)
13074:
$18,762
New York:
$19,609
(% of AGI for various income ranges: 49.8% for AGIs below $25k, 111.8% for AGIs $25k-50k, 433.8% for AGIs $50k-75k, 892.9% for AGIs $100k-200k)
Total itemized deductions: $26,340 (reported on 2.6% of returns)
Here:
$26,340
State:
$39,326
(% of AGI for various income ranges: 878.0% for AGIs $75k-100k)
Charity contributions: $4,500 (reported on 1.6% of returns)
Here:
$4,500
State:
$15,420
(% of AGI for various income ranges: 90.0% for AGIs $75k-100k)
Taxes paid: $7,320 (reported on 2.6% of returns)
13074:
$7,320
State:
$9,183
(% of AGI for various income ranges: 244.0% for AGIs $75k-100k)
Earned income credit: $2,176 (reported on 17.9% of returns)
Here:
$2,176
State:
$2,138
(% of AGI for various income ranges: 92.0% for AGIs below $25k, 76.1% for AGIs $25k-50k)
Percentage of individuals using paid preparers for their 2020 taxes: 97.4%
Here:
97%
State:
95%
(% for various income ranges: 94.9% for AGIs below $25k, 98.2% for AGIs $25k-50k, 100.0% for AGIs $50k-75k, 100.0% for AGIs $75k-100k, 95.5% for AGIs $100k-200k, 100.0% for AGIs over 200k)
Averages for the 2012 tax year for zip code 13074, filed in 2013:
Average Adjusted Gross Income (AGI) in 2012: $40,690 (Individual Income Tax Returns)
Here:
$40,690
State:
$77,088
Salary/wage: $36,533 (reported on 85.6% of returns)
Here:
$36,533
State:
$60,593
(% of AGI for various income ranges: 72.4% for AGIs below $25k, 80.3% for AGIs $25k-50k, 76.4% for AGIs $50k-75k, 81.3% for AGIs $75k-100k, 73.3% for AGIs $100k-200k)
Taxable interest for individuals: $409 (reported on 29.9% of returns)
This zip code:
$409
New York:
$3,125
(% of AGI for various income ranges: 0.6% for AGIs below $25k, 0.3% for AGIs $25k-50k, 0.3% for AGIs $50k-75k, 0.1% for AGIs $75k-100k, 0.3% for AGIs $100k-200k)
Ordinary dividends: $1,352 (reported on 13.9% of returns)
Here:
$1,352
State:
$10,299
(% of AGI for various income ranges: 0.5% for AGIs below $25k, 0.6% for AGIs $25k-50k, 0.5% for AGIs $50k-75k, 0.2% for AGIs $75k-100k, 0.4% for AGIs $100k-200k)
Net capital gain/loss in AGI: +$2,027 (reported on 7.7% of returns)
Here:
+$2,027
State:
+$42,474
(% of AGI for various income ranges: 0.2% for AGIs $25k-50k, 0.5% for AGIs $50k-75k, 1.0% for AGIs $100k-200k)
Profit/loss from business: +$6,157 (reported on 10.8% of returns)
Here:
+$6,157
State:
+$16,168
(% of AGI for various income ranges: 4.1% for AGIs below $25k, 1.5% for AGIs $25k-50k, 2.0% for AGIs $50k-75k, 0.1% for AGIs $75k-100k, 1.1% for AGIs $100k-200k)
Taxable individual retirement arrangement distribution: $12,936 (reported on 7.2% of returns)
13074:
$12,936
New York:
$17,621
(% of AGI for various income ranges: 2.6% for AGIs below $25k, 1.4% for AGIs $25k-50k, 3.3% for AGIs $50k-75k, 3.7% for AGIs $100k-200k)
Total itemized deductions: $16,200 (20% of AGI, reported on 20.6% of returns)
Here:
$16,200
State:
$34,985
Here:
20.3% of AGI
State:
21.3% of AGI
(% of AGI for various income ranges: 2.6% for AGIs below $25k, 5.8% for AGIs $25k-50k, 7.6% for AGIs $50k-75k, 10.8% for AGIs $75k-100k, 12.2% for AGIs $100k-200k)
Charity contributions: $1,818 (reported on 14.4% of returns)
Here:
$1,818
State:
$5,572
(% of AGI for various income ranges: 0.6% for AGIs $25k-50k, 0.5% for AGIs $50k-75k, 0.7% for AGIs $75k-100k, 1.1% for AGIs $100k-200k)
Taxes paid: $7,944 (reported on 20.1% of returns)
13074:
$7,944
State:
$18,656
(% of AGI for various income ranges: 2.6% for AGIs $25k-50k, 3.4% for AGIs $50k-75k, 4.8% for AGIs $75k-100k, 7.0% for AGIs $100k-200k)
Earned income credit: $2,302 (reported on 22.7% of returns)
Here:
$2,302
State:
$2,230
(% of AGI for various income ranges: 7.3% for AGIs below $25k, 1.4% for AGIs $25k-50k)
Percentage of individuals using paid preparers for their 2012 taxes: 61.3%
Here:
61%
State:
66%
(% for various income ranges: 55.8% for AGIs below $25k, 62.0% for AGIs $25k-50k, 67.9% for AGIs $50k-75k, 68.8% for AGIs $75k-100k, 71.4% for AGIs $100k-200k)
Averages for the 2004 tax year for zip code 13074, filed in 2005:
Average Adjusted Gross Income (AGI) in 2004: $33,483 (Individual Income Tax Returns)
Here:
$33,483
State:
$59,519
Salary/wage: $31,718 (reported on 88.7% of returns)
Here:
$31,718
State:
$50,673
(% of AGI for various income ranges: 85.1% for AGIs below $10k, 77.0% for AGIs $10k-25k, 85.4% for AGIs $25k-50k, 85.4% for AGIs $50k-75k, 85.9% for AGIs $75k-100k, 82.9% for AGIs over 100k)
Taxable interest for individuals: $524 (reported on 39.0% of returns)
This zip code:
$524
New York:
$2,377
(% of AGI for various income ranges: 1.4% for AGIs below $10k, 1.3% for AGIs $10k-25k, 0.4% for AGIs $25k-50k, 0.4% for AGIs $50k-75k, 0.6% for AGIs $75k-100k, 0.6% for AGIs over 100k)
Taxable dividends: $663 (reported on 14.5% of returns)
Here:
$663
State:
$5,394
(% of AGI for various income ranges: 0.3% for AGIs below $10k, 0.3% for AGIs $10k-25k, 0.2% for AGIs $25k-50k, 0.2% for AGIs $50k-75k, 0.5% for AGIs $75k-100k, 0.3% for AGIs over 100k)
Net capital gain/loss: +$934 (reported on 9.4% of returns)
Here:
+$934
State:
+$23,581
(% of AGI for various income ranges: -0.9% for AGIs below $10k, 0.5% for AGIs $10k-25k, 0.8% for AGIs $25k-50k, -0.1% for AGIs $50k-75k, -0.2% for AGIs $75k-100k, 0.4% for AGIs over 100k)
Profit/loss from business: +$3,576 (reported on 12.0% of returns)
Here:
+$3,576
State:
+$13,809
(% of AGI for various income ranges: 5.6% for AGIs below $10k, 4.6% for AGIs $10k-25k, 2.3% for AGIs $25k-50k, -0.4% for AGIs $50k-75k, -0.3% for AGIs $75k-100k, -0.1% for AGIs over 100k)
IRA payment deduction: $2,143 (reported on 1.5% of returns)
13074:
$2,143
New York:
$3,115
Total itemized deductions: $13,891 (21% of AGI, reported on 21.5% of returns)
Here:
$13,891
State:
$25,864
Here:
21.4% of AGI
State:
21.9% of AGI
(% of AGI for various income ranges: 4.7% for AGIs $10k-25k, 6.5% for AGIs $25k-50k, 10.9% for AGIs $50k-75k, 12.1% for AGIs $75k-100k, 12.7% for AGIs over 100k)
Charity contributions deductions: $1,836 (3% of AGI, reported on 18.1% of returns)
Here:
$1,836
State:
$4,439
Here:
2.7% of AGI
State:
3.6% of AGI
(% of AGI for various income ranges: 0.3% for AGIs $10k-25k, 0.6% for AGIs $25k-50k, 1.0% for AGIs $50k-75k, 1.6% for AGIs $75k-100k, 2.0% for AGIs over 100k)
Total tax: $3,821 (reported on 68.9% of returns)
13074:
$3,821
State:
$11,730
(% of AGI for various income ranges: 1.9% for AGIs below $10k, 3.5% for AGIs $10k-25k, 6.0% for AGIs $25k-50k, 8.0% for AGIs $50k-75k, 10.7% for AGIs $75k-100k, 14.2% for AGIs over 100k)
Earned income credit: $1,620 (reported on 21.6% of returns)
Here:
$1,620
State:
$1,757
Percentage of individuals using paid preparers for their 2004 taxes: 65.4%
Here:
65%
State:
67%
(% for various income ranges: 55.2% for AGIs below $10k, 66.3% for AGIs $10k-25k, 68.4% for AGIs $25k-50k, 71.3% for AGIs $50k-75k, 74.2% for AGIs $75k-100k, 62.1% for AGIs over 100k)
Household received Food Stamps/SNAP in the past 12 months: 288 Household did not receive Food Stamps/SNAP in the past 12 months: 1,502
Women who had a birth in the past 12 months: 66 (54 now married, 11 unmarried) Women who did not have a birth in the past 12 months: 874 (312 now married, 562 unmarried)
Housing units in zip code 13074 with a mortgage: 846 (174 second mortgage, 156 both second mortgage and home equity loan) Houses without a mortgage: 101
Median monthly owner costs for units with a mortgage: $1,306 Median monthly owner costs for units without a mortgage: $473
Residents with income below the poverty level in 2022:
This zip code:
17.9%
Whole state:
14.3%
Residents with income below 50% of the poverty level in 2022:
This zip code:
11.9%
Whole state:
6.8%
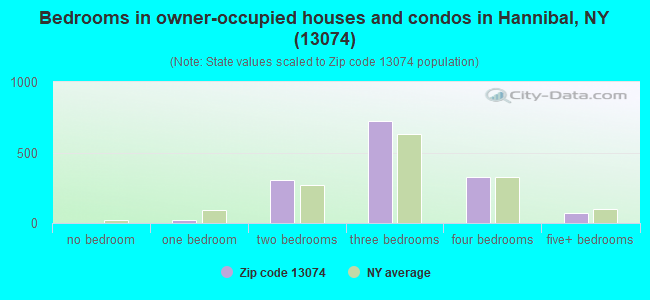
Median number of rooms in houses and condos:
Here:
6.7
State:
6.3
Median number of rooms in apartments:
Here:
5.0
State:
3.8
Notable locations in this zip code not listed on our city pages
Notable locations in zip code 13074: Enchantment Acres Flower Farm (A), Snow Valley Honey Farm (B), Wiltse's Fruit Farm (C), Kinney Corners (D), Hannibal Free Library (E), Meadowbrook Manor Assisted Living Facility (F). Display/hide their locations on the map
Churches in zip code 13074 include: Saint Joseph Chapel (A), Hannibal Community Church (B), Our Lady of the Rosary Church (C). Display/hide their locations on the map
Cemeteries: Hannibal Center Cemetery (1), Hannibal Cemetery (2), Fairdale Rural Cemetery (3), Stevens Cemetery (4), Mosher Cemetery (5). Display/hide their locations on the map
497 married couples with children.
203 single-parent households (85 men, 118 women).
99.4% of residents of 13074 zip code speak English at home.
0.1% of residents speak Spanish at home (100% not well).
0.2% of residents speak other Indo-European language at home (100% very well).
Foreign born population: 28 (0.7%) (49.6% of them are naturalized citizens)
This zip code:
0.7%
Whole state:
22.7%
7%Nepal
4%Sweden
4%United Kingdom, excluding England and Scotland
4%Greece
4%Malaysia
4%Honduras
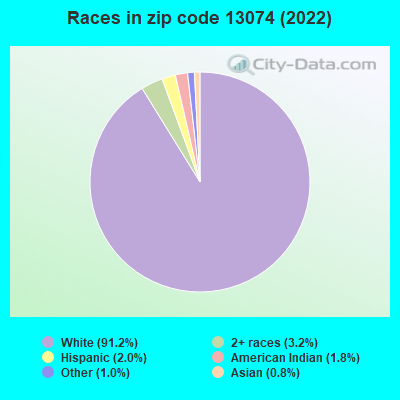
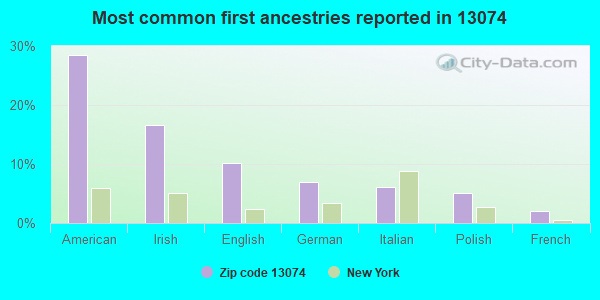
28%American
17%Irish
10%English
7%German
6%Italian
5%Polish
2%French
Year of entry for the foreign-born population
172010 or later
12000 to 2009
01990 to 1999
16Before 1990
Facilities with environmental interests located in this zip code:
ANDEL MOBILE HOME PARK (BOX 118 in HANNIBAL, NY)
(Integrated Compliance Information System) - ICIS-02-2000-8313, FORMAL ENFORCEMENT ACTION COMMUNITY WATER SYSTEM (SDWIS) Business SIC classification: WATER SUPPLY
HANNIBAL HS ( in HANNIBAL, NY)
(National Center for Education Statistics) - STATE ID-460701040002 Organizations: HANNIBAL CSD (SCHOOL DISTRICT)
HANNIBAL CENTRAL SCHOOL DIST (CAYUGA ST 1/4 MI N OF RTE 104 in HANNIBAL, NY)
(Resource Conservation and Recovery Act (tracking hazardous waste))
HANNIBAL CENTRAL SCHOOL DIST (CAYUGA ST 1/2 MI N OF RTE 104 in HANNIBAL, NY)
(Resource Conservation and Recovery Act (tracking hazardous waste))
HANNIBAL CENTRAL SCHOOLS (AUBURN ST in HANNIBAL, NY)
(Resource Conservation and Recovery Act (tracking hazardous waste))
ACRO-FAB LTD (ROCHESTER ST CAYUGA 1/4 MI W in HANNIBAL, NY)
Conditionally Exempt Small Quantity Generators, less than 100 kg/month of hazardous waste (Resource Conservation and Recovery Act (tracking hazardous waste)) - notification
HANNIBAL TOWN OF (CEMETARY DR - HANNIBAL CENTER in HANNIBAL, NY)
Conditionally Exempt Small Quantity Generators, less than 100 kg/month of hazardous waste (Resource Conservation and Recovery Act (tracking hazardous waste)) - notification Organizations: TOWN OF HANNIBAL (CONTACT/OWNER)
HANNIBAL COLLISION SERVICE (DURBIN RD BOX 325 in HANNIBAL, NY)
Conditionally Exempt Small Quantity Generators, less than 100 kg/month of hazardous waste (Resource Conservation and Recovery Act (tracking hazardous waste))
Housing units lacking complete plumbing facilities: 4.3% Housing units lacking complete kitchen facilities: 3.4%
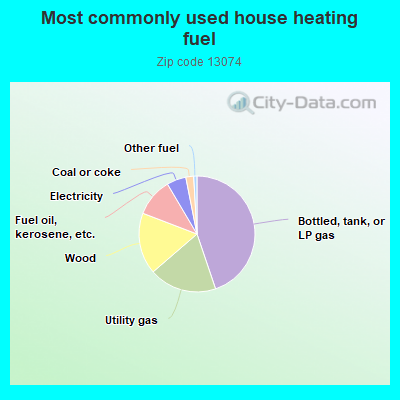
44.9%Bottled, tank, or LP gas
18.9%Utility gas
17.2%Wood
10.7%Fuel oil, kerosene, etc.
5.4%Electricity
2.2%Coal or coke
0.9%Other fuel
Population in 1990: 5,248.
Place of birth for U.S.-born residents:
This state: 3,652
Northeast: 253
Midwest: 56
South: 299
West: 70
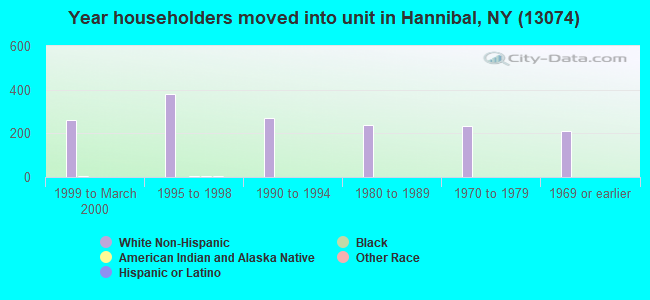
55% of the 13074 zip code residents lived in the same house 5 years ago. Out of people who lived in different houses, 72% lived in this county. Out of people who lived in different counties, 50% lived in New York.
93% of the 13074 zip code residents lived in the same house 1 year ago. Out of people who lived in different houses, 70% moved from this county. Out of people who lived in different houses, 9% moved from different county within same state. Out of people who lived in different houses, 19% moved from different state.
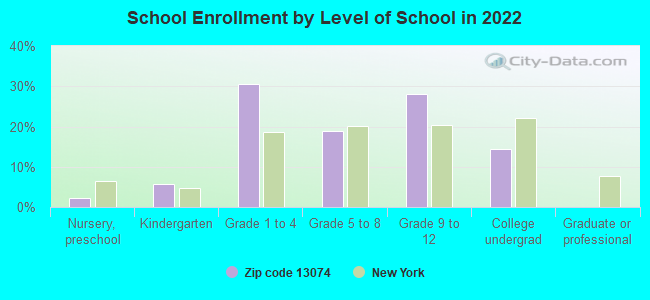
Private vs. public school enrollment:
Students in private schools in grades 1 to 8 (elementary and middle school):
Here:
0.0%
New York:
15.6%
Students in private schools in grades 9 to 12 (high school): 2
Here:
1.1%
New York:
15.0%
Students in private undergraduate colleges: 67
Here:
52.4%
New York:
39.2%
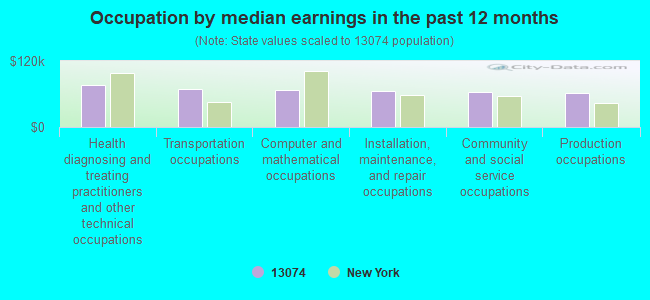
Occupation by median earnings in the past 12 months ($)
76,278Health diagnosing and treating practitioners and other technical occupations
68,996Transportation occupations
67,277Computer and mathematical occupations
65,771Installation, maintenance, and repair occupations
63,071Community and social service occupations
61,367Production occupations
Top industries in this zip code by the number of employees in 2005:
Health Care and Social Assistance: Homes for the Elderly (10-19 employees: 1 establishment)
Construction: Drywall and Insulation Contractors (5-9: 1, 1-4: 1)
Accommodation and Food Services: Limited-Service Restaurants (5-9: 1, 1-4: 1)
Health Care and Social Assistance: Residential Mental Health and Substance Abuse Facilities (5-9: 1)
Finance and Insurance: Savings Institutions (5-9: 1)
People in group quarters in 2010:
11 people in residential treatment centers for adults
People in group quarters in 2000:
16 people in nursing homes
13 people in homes or halfway houses for drug/alcohol abuse
Fatal accident statistics in 2014:
Fatal accident count: 1
Vehicles involved in fatal accidents: 1
Fatal accidents caused by drunken drivers: 1
Fatalities: 1
Persons involved in fatal accidents: 2
Pedestrians involved in fatal accidents: 0
Fatal accident statistics in 2013:
Fatal accident count: 1
Vehicles involved in fatal accidents: 1
Fatal accidents caused by drunken drivers: 0
Fatalities: 1
Persons involved in fatal accidents: 1
Pedestrians involved in fatal accidents: 1
Home Mortgage Disclosure Act Aggregated Statistics For Year 2009 (Based on 4 partial tracts)
A) FHA, FSA/RHS & VA Home Purchase Loans
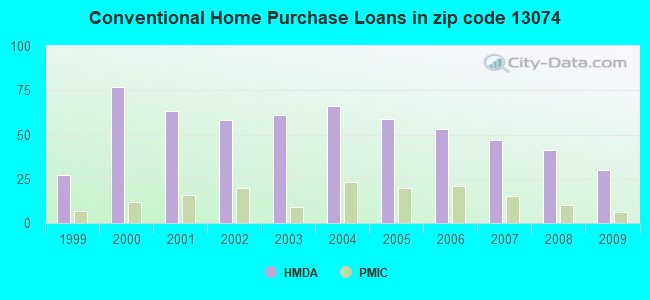
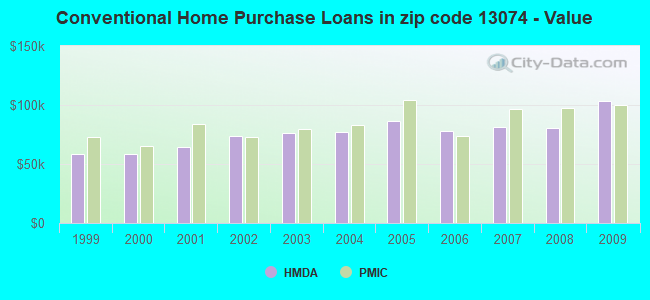
B) Conventional Home Purchase Loans
C) Refinancings
D) Home Improvement Loans
F) Non-occupant Loans on < 5 Family Dwellings (A B C & D)
G) Loans On Manufactured Home Dwelling (A B C & D)
Number
Average Value
Number
Average Value
Number
Average Value
Number
Average Value
Number
Average Value
Number
Average Value
LOANS ORIGINATED
23
$111,230
30
$103,250
47
$85,138
39
$29,155
6
$163,273
14
$85,742
APPLICATIONS APPROVED, NOT ACCEPTED
2
$60,230
3
$81,610
10
$104,997
4
$42,562
0
$0
6
$52,802
APPLICATIONS DENIED
5
$114,618
11
$72,842
33
$101,826
25
$15,388
0
$0
11
$72,685
APPLICATIONS WITHDRAWN
3
$128,150
0
$0
17
$115,956
5
$43,076
0
$0
0
$0
FILES CLOSED FOR INCOMPLETENESS
0
$0
0
$0
3
$89,293
0
$0
0
$0
0
$0
Aggregated Statistics For Year 2008 (Based on 4 partial tracts)
A) FHA, FSA/RHS & VA Home Purchase Loans
B) Conventional Home Purchase Loans
C) Refinancings
D) Home Improvement Loans
F) Non-occupant Loans on < 5 Family Dwellings (A B C & D)
G) Loans On Manufactured Home Dwelling (A B C & D)
Number
Average Value
Number
Average Value
Number
Average Value
Number
Average Value
Number
Average Value
Number
Average Value
LOANS ORIGINATED
18
$97,804
41
$80,610
54
$74,458
62
$32,543
4
$85,560
24
$46,057
APPLICATIONS APPROVED, NOT ACCEPTED
1
$87,340
5
$82,714
16
$89,309
0
$0
0
$0
6
$70,318
APPLICATIONS DENIED
14
$74,981
24
$68,454
73
$95,768
57
$15,366
2
$23,945
29
$62,427
APPLICATIONS WITHDRAWN
1
$152,480
2
$31,340
19
$97,345
12
$32,939
0
$0
2
$24,380
FILES CLOSED FOR INCOMPLETENESS
0
$0
2
$65,505
0
$0
1
$8,880
0
$0
0
$0
Aggregated Statistics For Year 2007 (Based on 4 partial tracts)
A) FHA, FSA/RHS & VA Home Purchase Loans
B) Conventional Home Purchase Loans
C) Refinancings
D) Home Improvement Loans
F) Non-occupant Loans on < 5 Family Dwellings (A B C & D)
G) Loans On Manufactured Home Dwelling (A B C & D)
Number
Average Value
Number
Average Value
Number
Average Value
Number
Average Value
Number
Average Value
Number
Average Value
LOANS ORIGINATED
14
$103,189
47
$81,656
41
$86,543
61
$30,482
4
$102,268
31
$48,213
APPLICATIONS APPROVED, NOT ACCEPTED
0
$0
14
$56,491
6
$68,358
4
$102,060
0
$0
8
$57,335
APPLICATIONS DENIED
3
$110,537
29
$48,963
95
$65,045
50
$23,097
1
$88,820
40
$39,101
APPLICATIONS WITHDRAWN
2
$87,430
3
$73,450
40
$111,232
7
$57,780
0
$0
6
$69,050
FILES CLOSED FOR INCOMPLETENESS
0
$0
2
$49,175
9
$93,357
2
$51,295
0
$0
0
$0
Aggregated Statistics For Year 2006 (Based on 4 partial tracts)
A) FHA, FSA/RHS & VA Home Purchase Loans
B) Conventional Home Purchase Loans
C) Refinancings
D) Home Improvement Loans
F) Non-occupant Loans on < 5 Family Dwellings (A B C & D)
G) Loans On Manufactured Home Dwelling (A B C & D)
Number
Average Value
Number
Average Value
Number
Average Value
Number
Average Value
Number
Average Value
Number
Average Value
LOANS ORIGINATED
15
$80,927
53
$77,788
67
$53,326
59
$34,373
11
$59,415
30
$44,310
APPLICATIONS APPROVED, NOT ACCEPTED
1
$113,990
11
$68,854
17
$77,105
2
$15,375
0
$0
9
$75,918
APPLICATIONS DENIED
1
$124,350
11
$79,604
90
$70,753
68
$24,436
7
$32,991
21
$48,791
APPLICATIONS WITHDRAWN
3
$55,267
3
$99,630
64
$78,094
10
$59,042
3
$78,953
3
$56,627
FILES CLOSED FOR INCOMPLETENESS
0
$0
3
$120,900
18
$59,228
0
$0
0
$0
0
$0
Aggregated Statistics For Year 2005 (Based on 4 partial tracts)
A) FHA, FSA/RHS & VA Home Purchase Loans
B) Conventional Home Purchase Loans
C) Refinancings
D) Home Improvement Loans
F) Non-occupant Loans on < 5 Family Dwellings (A B C & D)
G) Loans On Manufactured Home Dwelling (A B C & D)
Number
Average Value
Number
Average Value
Number
Average Value
Number
Average Value
Number
Average Value
Number
Average Value
LOANS ORIGINATED
11
$67,078
59
$86,748
73
$78,547
53
$24,307
4
$45,485
24
$52,909
APPLICATIONS APPROVED, NOT ACCEPTED
0
$0
8
$57,391
14
$67,199
2
$33,945
0
$0
2
$40,390
APPLICATIONS DENIED
4
$66,988
39
$50,922
114
$84,836
56
$26,290
5
$12,750
48
$42,247
APPLICATIONS WITHDRAWN
3
$80,457
13
$62,937
40
$80,536
9
$73,590
3
$75,500
10
$50,482
FILES CLOSED FOR INCOMPLETENESS
0
$0
10
$138,224
19
$91,390
0
$0
0
$0
0
$0
Aggregated Statistics For Year 2004 (Based on 4 partial tracts)
A) FHA, FSA/RHS & VA Home Purchase Loans
B) Conventional Home Purchase Loans
C) Refinancings
D) Home Improvement Loans
E) Loans on Dwellings For 5+ Families
F) Non-occupant Loans on < 5 Family Dwellings (A B C & D)
G) Loans On Manufactured Home Dwelling (A B C & D)
Number
Average Value
Number
Average Value
Number
Average Value
Number
Average Value
Number
Average Value
Number
Average Value
Number
Average Value
LOANS ORIGINATED
6
$86,395
66
$76,771
91
$65,927
63
$20,473
1
$59,220
6
$50,637
21
$51,995
APPLICATIONS APPROVED, NOT ACCEPTED
1
$109,550
10
$53,536
14
$60,216
4
$22,658
0
$0
1
$69,580
6
$48,713
APPLICATIONS DENIED
3
$140,637
16
$48,044
82
$71,479
20
$11,910
0
$0
3
$42,930
18
$40,901
APPLICATIONS WITHDRAWN
1
$5,920
9
$63,061
80
$68,389
10
$48,107
0
$0
1
$76,980
13
$60,273
FILES CLOSED FOR INCOMPLETENESS
0
$0
1
$112,510
11
$82,326
1
$39,970
0
$0
3
$83,890
0
$0
Aggregated Statistics For Year 2003 (Based on 4 partial tracts)
A) FHA, FSA/RHS & VA Home Purchase Loans
B) Conventional Home Purchase Loans
C) Refinancings
D) Home Improvement Loans
F) Non-occupant Loans on < 5 Family Dwellings (A B C & D)
Number
Average Value
Number
Average Value
Number
Average Value
Number
Average Value
Number
Average Value
LOANS ORIGINATED
15
$72,205
61
$76,188
130
$73,867
36
$12,097
5
$46,028
APPLICATIONS APPROVED, NOT ACCEPTED
1
$109,550
10
$61,748
16
$55,647
1
$19,250
1
$34,050
APPLICATIONS DENIED
0
$0
8
$53,676
79
$78,235
38
$20,727
2
$13,265
APPLICATIONS WITHDRAWN
0
$0
5
$49,474
53
$73,116
17
$60,221
0
$0
FILES CLOSED FOR INCOMPLETENESS
0
$0
0
$0
10
$85,006
0
$0
0
$0
Aggregated Statistics For Year 2002 (Based on 4 partial tracts)
A) FHA, FSA/RHS & VA Home Purchase Loans
B) Conventional Home Purchase Loans
C) Refinancings
D) Home Improvement Loans
F) Non-occupant Loans on < 5 Family Dwellings (A B C & D)
Number
Average Value
Number
Average Value
Number
Average Value
Number
Average Value
Number
Average Value
LOANS ORIGINATED
5
$61,732
58
$73,746
108
$69,194
45
$17,911
6
$41,462
APPLICATIONS APPROVED, NOT ACCEPTED
0
$0
7
$54,986
22
$60,555
5
$30,294
0
$0
APPLICATIONS DENIED
0
$0
25
$50,400
88
$61,200
26
$15,108
0
$0
APPLICATIONS WITHDRAWN
0
$0
6
$93,357
52
$74,871
10
$22,212
0
$0
FILES CLOSED FOR INCOMPLETENESS
0
$0
0
$0
7
$84,567
0
$0
0
$0
Aggregated Statistics For Year 2001 (Based on 4 partial tracts)
A) FHA, FSA/RHS & VA Home Purchase Loans
B) Conventional Home Purchase Loans
C) Refinancings
D) Home Improvement Loans
F) Non-occupant Loans on < 5 Family Dwellings (A B C & D)
Number
Average Value
Number
Average Value
Number
Average Value
Number
Average Value
Number
Average Value
LOANS ORIGINATED
11
$85,689
63
$64,701
80
$69,492
43
$23,167
6
$64,248
APPLICATIONS APPROVED, NOT ACCEPTED
3
$95,370
18
$62,407
12
$67,169
5
$8,186
0
$0
APPLICATIONS DENIED
1
$88,820
59
$40,519
120
$60,844
40
$16,781
7
$45,320
APPLICATIONS WITHDRAWN
1
$42,930
8
$42,204
45
$67,505
6
$24,870
0
$0
FILES CLOSED FOR INCOMPLETENESS
0
$0
0
$0
5
$75,944
0
$0
0
$0
Aggregated Statistics For Year 2000 (Based on 4 partial tracts)
A) FHA, FSA/RHS & VA Home Purchase Loans
B) Conventional Home Purchase Loans
C) Refinancings
D) Home Improvement Loans
F) Non-occupant Loans on < 5 Family Dwellings (A B C & D)
Number
Average Value
Number
Average Value
Number
Average Value
Number
Average Value
Number
Average Value
LOANS ORIGINATED
10
$67,394
77
$58,719
45
$52,455
52
$19,080
2
$31,255
APPLICATIONS APPROVED, NOT ACCEPTED
1
$75,500
38
$56,320
18
$60,065
18
$17,833
0
$0
APPLICATIONS DENIED
3
$48,360
92
$44,369
71
$52,725
15
$10,832
2
$72,325
APPLICATIONS WITHDRAWN
0
$0
7
$34,850
22
$41,926
4
$19,410
0
$0
FILES CLOSED FOR INCOMPLETENESS
0
$0
0
$0
9
$72,763
0
$0
0
$0
Aggregated Statistics For Year 1999 (Based on 2 partial tracts)
A) FHA, FSA/RHS & VA Home Purchase Loans
B) Conventional Home Purchase Loans
C) Refinancings
D) Home Improvement Loans
F) Non-occupant Loans on < 5 Family Dwellings (A B C & D)
Detailed PMIC statistics for the following Tracts:0213.00
, 0214.01
2002 - 2018 National Fire Incident Reporting System (NFIRS) incidents
According to the data from the years 2002 - 2018 the average number of fires per year is 7. The highest number of reported fires - 20 took place in 2002, and the least - 0 in 2005. The data has a declining trend.
When looking into fire subcategories, the most incidents belonged to: Structure Fires (68.4%), and Outside Fires (21.9%).
Fire incident types reported to NFIRS in Zip Code 13074


 Nearest zip codes: 13111, 13156, 13115, 13033, 13113, 13126.


 According to the data from the years 2002 - 2018 the average number of fires per year is 7. The highest number of reported fires - 20 took place in 2002, and the least - 0 in 2005. The data has a declining trend.
 When looking into fire subcategories, the most incidents belonged to: Structure Fires (68.4%), and Outside Fires (21.9%).