Estimated zip code population in 2022: 2,182 Zip code population in 2010: 2,328 Zip code population in 2000: 2,998
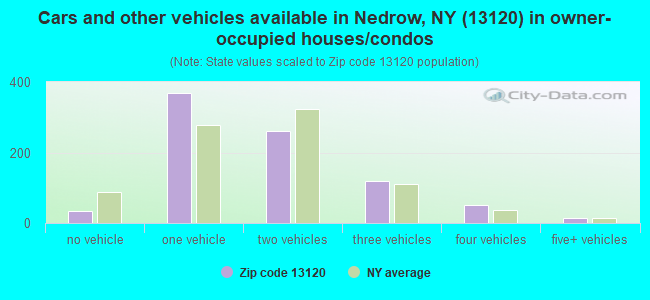
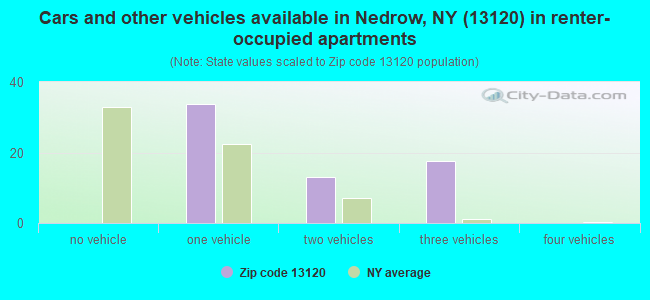
Houses and condos: 929 Renter-occupied apartments: 64
% of renters here:
7%
State:
46%
March 2022 cost of living index in zip code 13120: 101.0 (near average, U.S. average is 100)
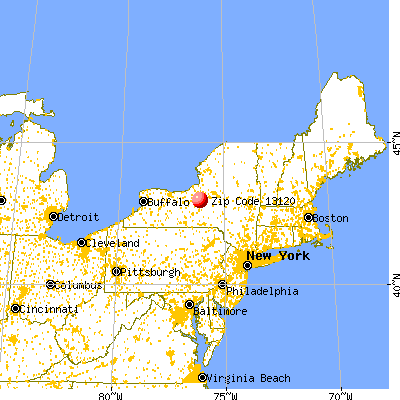
Land area: 17.1 sq. mi. Water area: 0.1 sq. mi.
Population density: 128 people per square mile
(very low).
OSM Map
General Map
Google Map
MSN Map
OSM Map
General Map
Google Map
MSN Map
OSM Map
General Map
Google Map
MSN Map
OSM Map
General Map
Google Map
MSN Map
Please wait while loading the map...
Real estate property taxes paid for housing units in 2022:
This zip code:
2.4% ($2,624)
New York:
1.5% ($6,180)
Median real estate property taxes paid for housing units with mortgages in 2022: $2,553 (2.4%) Median real estate property taxes paid for housing units with no mortgage in 2022: $2,787 (2.4%)
Business Search- 14 Million verified businesses
Males: 1,013
(46.5%)
Females: 1,168
(53.5%)
For population 25 years and over in 13120:
High school or higher: 89.7%
Bachelor's degree or higher: 14.9%
Graduate or professional degree: 7.3%
Unemployed: 3.7%
Mean travel time to work (commute): 18.7 minutes
For population 15 years and over in 13120:
Never married: 34.5%
Now married: 44.6%
Separated: 1.6%
Widowed: 3.5%
Divorced: 15.8%
Zip code 13120 compared to state average:
Median house value significantly below state average.
Black race population percentage significantly below state average.
Hispanic race population percentage significantly below state average.
Median age significantly above state average.
Foreign-born population percentage significantly below state average.
Renting percentage significantly below state average.
Length of stay since moving in significantly above state average.
Number of rooms per house above state average.
Percentage of population with a bachelor's degree or higher significantly below state average.
Averages for the 2020 tax year for zip code 13120, filed in 2021:
Average Adjusted Gross Income (AGI) in 2020: $46,792 (Individual Income Tax Returns)
Here:
$46,792
State:
$90,930
Salary/wage: $38,892 (reported on 80.9% of returns)
Here:
$38,892
State:
$72,104
(% of AGI for various income ranges: 975.3% for AGIs below $25k, 3407.2% for AGIs $25k-50k, 5594.7% for AGIs $50k-75k, 9425.0% for AGIs $75k-100k, 15201.7% for AGIs $100k-200k)
Taxable interest for individuals: $776 (reported on 25.2% of returns)
This zip code:
$776
New York:
$3,075
(% of AGI for various income ranges: 2.8% for AGIs below $25k, 5.2% for AGIs $25k-50k, 13.3% for AGIs $50k-75k, 28.3% for AGIs $75k-100k, 273.3% for AGIs $100k-200k)
Ordinary dividends: $2,129 (reported on 12.2% of returns)
Here:
$2,129
State:
$11,095
(% of AGI for various income ranges: 4.1% for AGIs below $25k, 8.3% for AGIs $25k-50k, 89.3% for AGIs $50k-75k, 211.7% for AGIs $100k-200k)
Net capital gain/loss in AGI: +$2,650 (reported on 8.7% of returns)
Here:
+$2,650
State:
+$44,925
(% of AGI for various income ranges: 10.7% for AGIs $25k-50k, 77.3% for AGIs $50k-75k, 196.7% for AGIs $100k-200k)
Profit/loss from business: +$8,850 (reported on 8.7% of returns)
Here:
+$8,850
State:
+$14,940
(% of AGI for various income ranges: 53.1% for AGIs below $25k, 143.4% for AGIs $25k-50k, 498.3% for AGIs $75k-100k)
Taxable individual retirement arrangement distribution: $15,922 (reported on 7.8% of returns)
13120:
$15,922
New York:
$19,609
(% of AGI for various income ranges: 48.4% for AGIs below $25k, 153.8% for AGIs $25k-50k, 1386.7% for AGIs $75k-100k)
Taxes paid: $8,050 (reported on 1.7% of returns)
13120:
$8,050
State:
$9,183
(% of AGI for various income ranges: 55.5% for AGIs $25k-50k)
Earned income credit: $2,258 (reported on 22.6% of returns)
Here:
$2,258
State:
$2,138
(% of AGI for various income ranges: 110.3% for AGIs below $25k, 80.7% for AGIs $25k-50k)
Percentage of individuals using paid preparers for their 2020 taxes: 93.9%
Here:
94%
State:
95%
(% for various income ranges: 95.1% for AGIs below $25k, 94.4% for AGIs $25k-50k, 94.7% for AGIs $50k-75k, 88.9% for AGIs $75k-100k, 90.0% for AGIs $100k-200k)
Averages for the 2012 tax year for zip code 13120, filed in 2013:
Average Adjusted Gross Income (AGI) in 2012: $44,164 (Individual Income Tax Returns)
Here:
$44,164
State:
$77,088
Salary/wage: $36,763 (reported on 85.2% of returns)
Here:
$36,763
State:
$60,593
(% of AGI for various income ranges: 74.0% for AGIs below $25k, 82.1% for AGIs $25k-50k, 77.5% for AGIs $50k-75k, 79.2% for AGIs $75k-100k, 50.8% for AGIs $100k-200k)
Taxable interest for individuals: $424 (reported on 30.6% of returns)
This zip code:
$424
New York:
$3,125
(% of AGI for various income ranges: 0.2% for AGIs below $25k, 0.2% for AGIs $25k-50k, 0.1% for AGIs $50k-75k, 0.6% for AGIs $100k-200k)
Ordinary dividends: $1,400 (reported on 12.0% of returns)
Here:
$1,400
State:
$10,299
(% of AGI for various income ranges: 0.8% for AGIs below $25k, 0.4% for AGIs $25k-50k, 0.3% for AGIs $50k-75k, 0.5% for AGIs $100k-200k)
Net capital gain/loss in AGI: +$10,167 (reported on 5.6% of returns)
Here:
+$10,167
State:
+$42,474
Profit/loss from business: +$8,220 (reported on 9.3% of returns)
Here:
+$8,220
State:
+$16,168
(% of AGI for various income ranges: 3.1% for AGIs below $25k, 2.2% for AGIs $25k-50k, 5.8% for AGIs $75k-100k)
Taxable individual retirement arrangement distribution: $11,375 (reported on 7.4% of returns)
13120:
$11,375
New York:
$17,621
(% of AGI for various income ranges: 2.6% for AGIs below $25k, 0.7% for AGIs $25k-50k, 6.8% for AGIs $50k-75k)
Total itemized deductions: $20,170 (22% of AGI, reported on 21.3% of returns)
Here:
$20,170
State:
$34,985
Here:
21.6% of AGI
State:
21.3% of AGI
(% of AGI for various income ranges: 4.8% for AGIs below $25k, 5.2% for AGIs $25k-50k, 7.5% for AGIs $50k-75k, 9.2% for AGIs $75k-100k, 17.6% for AGIs $100k-200k)
Charity contributions: $2,972 (reported on 16.7% of returns)
Here:
$2,972
State:
$5,572
(% of AGI for various income ranges: 0.8% for AGIs $25k-50k, 0.7% for AGIs $50k-75k, 1.0% for AGIs $75k-100k, 2.2% for AGIs $100k-200k)
Taxes paid: $9,500 (reported on 21.3% of returns)
13120:
$9,500
State:
$18,656
(% of AGI for various income ranges: 1.3% for AGIs below $25k, 1.9% for AGIs $25k-50k, 3.7% for AGIs $50k-75k, 4.3% for AGIs $75k-100k, 9.1% for AGIs $100k-200k)
Earned income credit: $2,233 (reported on 22.2% of returns)
Here:
$2,233
State:
$2,230
(% of AGI for various income ranges: 7.3% for AGIs below $25k, 1.1% for AGIs $25k-50k)
Percentage of individuals using paid preparers for their 2012 taxes: 50.9%
Here:
51%
State:
66%
(% for various income ranges: 43.2% for AGIs below $25k, 51.5% for AGIs $25k-50k, 58.8% for AGIs $50k-75k, 50.0% for AGIs $75k-100k, 83.3% for AGIs $100k-200k)
Averages for the 2004 tax year for zip code 13120, filed in 2005:
Average Adjusted Gross Income (AGI) in 2004: $36,286 (Individual Income Tax Returns)
Here:
$36,286
State:
$59,519
Salary/wage: $32,058 (reported on 86.9% of returns)
Here:
$32,058
State:
$50,673
(% of AGI for various income ranges: 86.1% for AGIs below $10k, 76.1% for AGIs $10k-25k, 85.3% for AGIs $25k-50k, 84.1% for AGIs $50k-75k, 80.3% for AGIs $75k-100k, 50.3% for AGIs over 100k)
Taxable interest for individuals: $766 (reported on 41.0% of returns)
This zip code:
$766
New York:
$2,377
(% of AGI for various income ranges: 2.5% for AGIs below $10k, 0.7% for AGIs $10k-25k, 0.5% for AGIs $25k-50k, 0.6% for AGIs $50k-75k, 0.3% for AGIs $75k-100k, 2.1% for AGIs over 100k)
Taxable dividends: $1,340 (reported on 18.1% of returns)
Here:
$1,340
State:
$5,394
(% of AGI for various income ranges: 2.6% for AGIs below $10k, 1.5% for AGIs $10k-25k, 0.3% for AGIs $25k-50k, 0.4% for AGIs $50k-75k, 0.5% for AGIs $75k-100k, 0.8% for AGIs over 100k)
Profit/loss from business: +$5,989 (reported on 8.7% of returns)
Here:
+$5,989
State:
+$13,809
(% of AGI for various income ranges: 2.7% for AGIs below $10k, 5.6% for AGIs $10k-25k, 1.2% for AGIs $25k-50k, 0.8% for AGIs $50k-75k, 0.9% for AGIs $75k-100k)
IRA payment deduction: $2,190 (reported on 1.9% of returns)
13120:
$2,190
New York:
$3,115
Total itemized deductions: $14,675 (20% of AGI, reported on 21.3% of returns)
Here:
$14,675
State:
$25,864
Here:
19.7% of AGI
State:
21.9% of AGI
(% of AGI for various income ranges: 5.2% for AGIs $10k-25k, 6.8% for AGIs $25k-50k, 8.7% for AGIs $50k-75k, 12.3% for AGIs $75k-100k, 12.3% for AGIs over 100k)
Charity contributions deductions: $2,220 (3% of AGI, reported on 18.4% of returns)
Here:
$2,220
State:
$4,439
Here:
2.8% of AGI
State:
3.6% of AGI
(% of AGI for various income ranges: 0.6% for AGIs $10k-25k, 0.5% for AGIs $25k-50k, 1.2% for AGIs $50k-75k, 1.7% for AGIs $75k-100k, 2.0% for AGIs over 100k)
Total tax: $5,041 (reported on 69.8% of returns)
13120:
$5,041
State:
$11,730
(% of AGI for various income ranges: 1.5% for AGIs below $10k, 3.9% for AGIs $10k-25k, 6.2% for AGIs $25k-50k, 9.3% for AGIs $50k-75k, 11.5% for AGIs $75k-100k, 19.5% for AGIs over 100k)
Earned income credit: $1,619 (reported on 22.7% of returns)
Here:
$1,619
State:
$1,757
Percentage of individuals using paid preparers for their 2004 taxes: 57.0%
Here:
57%
State:
67%
(% for various income ranges: 43.4% for AGIs below $10k, 57.0% for AGIs $10k-25k, 60.5% for AGIs $25k-50k, 62.1% for AGIs $50k-75k, 62.7% for AGIs $75k-100k, 80.6% for AGIs over 100k)
Likely homosexual households (counted as self-reported same-sex unmarried-partner households)
Lesbian couples: 0.5% of all households
Gay men: 0.0% of all households
Household received Food Stamps/SNAP in the past 12 months: 72 Household did not receive Food Stamps/SNAP in the past 12 months: 835
Women who had a birth in the past 12 months: 28 (12 now married, 16 unmarried) Women who did not have a birth in the past 12 months: 366 (60 now married, 309 unmarried)
Housing units in zip code 13120 with a mortgage: 550 (13 second mortgage, 13 both second mortgage and home equity loan) Houses without a mortgage: 49
Median monthly owner costs for units with a mortgage: $961 Median monthly owner costs for units without a mortgage: $566
Residents with income below the poverty level in 2022:
This zip code:
12.4%
Whole state:
14.3%
Residents with income below 50% of the poverty level in 2022:
This zip code:
8.0%
Whole state:
6.8%
Median number of rooms in houses and condos:
Here:
6.4
State:
6.3
Median number of rooms in apartments:
Here:
3.5
State:
3.8
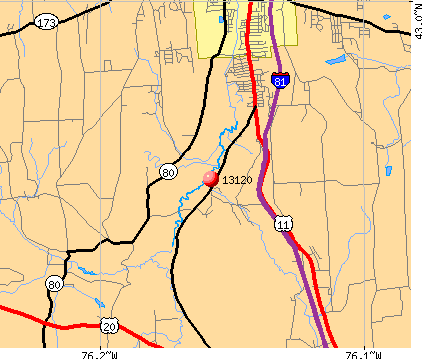
Notable locations in this zip code not listed on our city pages
Notable locations in zip code 13120: Gwills Corners (A), McLusky Orchards (B), Nedrow Fire Department (C), Onondaga Nation Fire Department (D). Display/hide their locations on the map
Churches in zip code 13120 include: Apple Valley United Methodist Church (A), Full Gospel Church of the Lord (B), Onondaga Wesleyan Church (C), Turning Point Assembly of God Church (D), Holy Tabernacle Church of God (E). Display/hide their locations on the map
In group quarters: 6 (-1 institutionalized population)
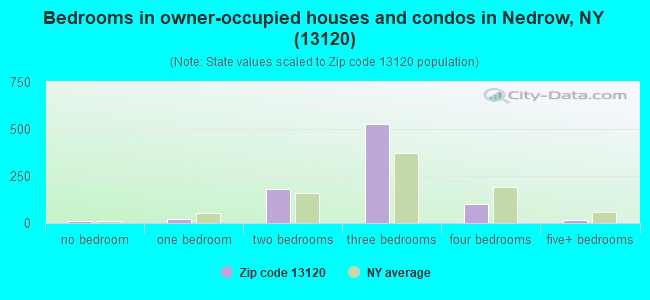
Size of family households: 225 2-persons, 128 3-persons, 71 4-persons, 77 5-persons, 51 6-persons
Size of nonfamily households: 339 1-person, 20 2-persons
41 married couples with children.
139 single-parent households (82 men, 57 women).
97.5% of residents of 13120 zip code speak English at home.
0.2% of residents speak Spanish at home (100% very well).
1.7% of residents speak Asian or Pacific Island language at home (47% well, 53% not at all).
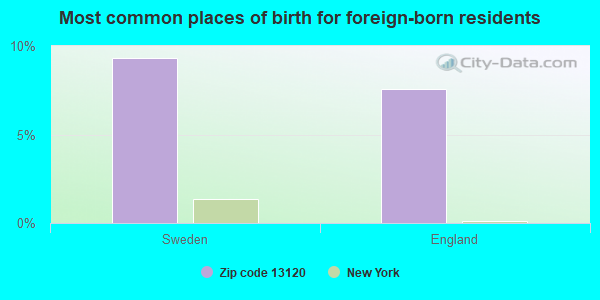
Foreign born population: 174 (8.0%) (88.5% of them are naturalized citizens)
This zip code:
8.0%
Whole state:
22.7%
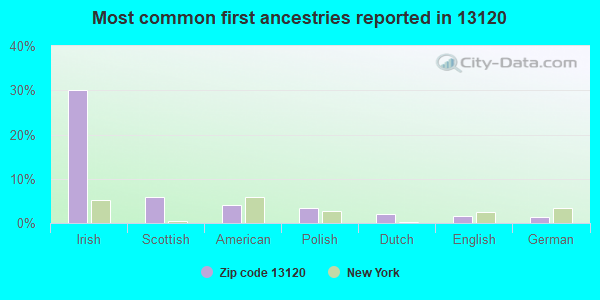
9%Sweden
8%England
30%Irish
6%Scottish
4%American
3%Polish
2%Dutch
2%English
1%German
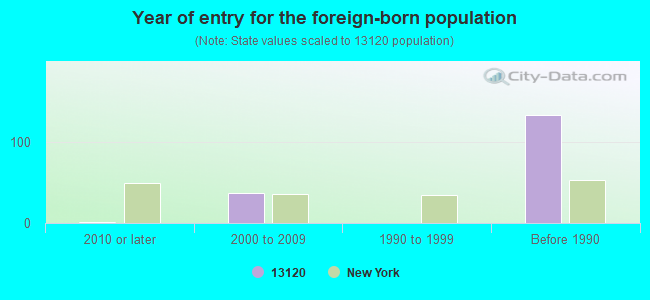
Year of entry for the foreign-born population
12010 or later
372000 to 2009
01990 to 1999
133Before 1990
Facilities with environmental interests located in this zip code:
HILL OLIVER R DBA O R GAS GROCERY (STATE RTE 11 in NEDROW, NY) . Tribal Land
(Resource Conservation and Recovery Act (tracking hazardous waste)) Organizations: OLIVER R HILL (CONTACT/OWNER)
Housing units lacking complete kitchen facilities: 2.3%
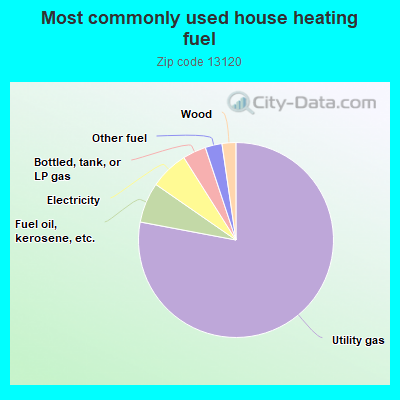
78.2%Utility gas
6.7%Fuel oil, kerosene, etc.
6.4%Electricity
3.9%Bottled, tank, or LP gas
2.8%Other fuel
2.3%Wood
Population in 1990: 2,349. Population change in the 1990s: +649 (+27.6%).
Place of birth for U.S.-born residents:
This state: 1,855
Northeast: 30
Midwest: 38
South: 59
West: 10
70% of the 13120 zip code residents lived in the same house 5 years ago. Out of people who lived in different houses, 83% lived in this county. Out of people who lived in different counties, 50% lived in New York.
91% of the 13120 zip code residents lived in the same house 1 year ago. Out of people who lived in different houses, 77% moved from this county. Out of people who lived in different houses, 12% moved from different county within same state. Out of people who lived in different houses, 8% moved from different state.
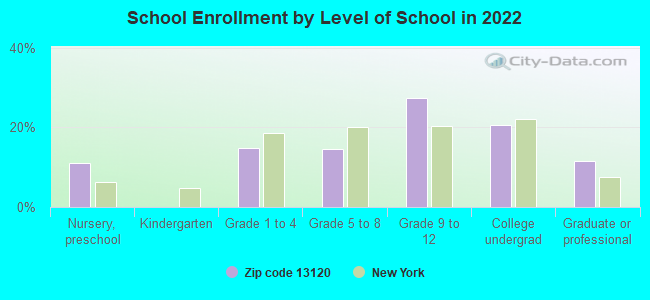
Private vs. public school enrollment:
Students in private schools in grades 1 to 8 (elementary and middle school):
Here:
0.0%
New York:
15.6%
Students in private schools in grades 9 to 12 (high school):
Here:
0.0%
New York:
15.0%
Students in private undergraduate colleges: 3
Here:
4.6%
New York:
39.2%
Occupation by median earnings in the past 12 months ($)
82,703Building and grounds cleaning and maintenance occupations
80,513Architecture and engineering occupations
75,862Education, training, and library occupations
62,821Business and financial operations occupations
59,544Installation, maintenance, and repair occupations
54,230Transportation occupations
Companies with federal contracts located in this zip code:
NOTIFIER OF NY, INC (102 MARY LANE in NEDROW, NY; small business)
$50,565 with Defense Logistics Agency for Maintenance, Repair and Rebuilding of Equipment -- Alarm, Signal, and Security Detection Systems. Signed on 2001-05-01. Completion date: 2001-05-01.
Top industries in this zip code by the number of employees in 2005:
Other Services (except Public Administration): Coin-Operated Laundries and Drycleaners (50-99 employees: 1 establishment)
Accommodation and Food Services: Limited-Service Restaurants (20-49: 1)
Professional, Scientific, and Technical Services: Other Services Related to Advertising (10-19: 1)
Health Care and Social Assistance: Other Individual and Family Services (10-19: 1)
Construction: Commercial and Institutional Building Construction (5-9: 1)
People in group quarters in 2010:
4 people in college/university student housing
Fatal accident statistics in 2014:
Fatal accident count: 1
Vehicles involved in fatal accidents: 1
Fatal accidents caused by drunken drivers: 0
Fatalities: 1
Persons involved in fatal accidents: 2
Pedestrians involved in fatal accidents: 0
Home Mortgage Disclosure Act Aggregated Statistics For Year 2009 (Based on 2 full and 4 partial tracts)
A) FHA, FSA/RHS & VA Home Purchase Loans
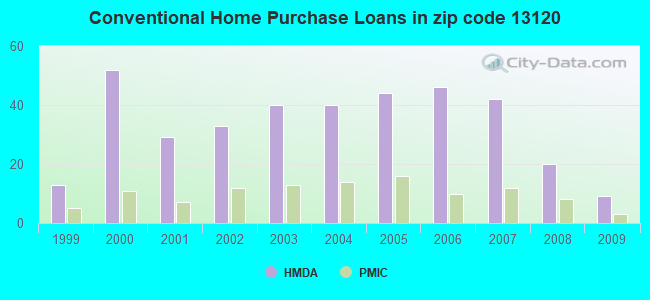
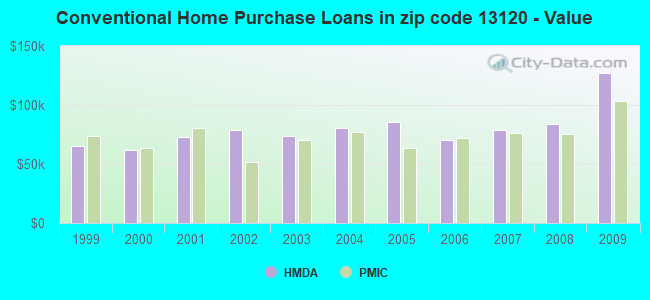
B) Conventional Home Purchase Loans
C) Refinancings
D) Home Improvement Loans
F) Non-occupant Loans on < 5 Family Dwellings (A B C & D)
Number
Average Value
Number
Average Value
Number
Average Value
Number
Average Value
Number
Average Value
LOANS ORIGINATED
27
$88,734
9
$126,861
39
$76,528
19
$13,676
1
$149,390
APPLICATIONS APPROVED, NOT ACCEPTED
4
$69,162
2
$120,570
7
$70,936
1
$13,900
0
$0
APPLICATIONS DENIED
1
$55,920
3
$66,730
21
$79,336
16
$21,526
0
$0
APPLICATIONS WITHDRAWN
2
$104,595
2
$65,210
11
$84,415
0
$0
0
$0
FILES CLOSED FOR INCOMPLETENESS
0
$0
0
$0
2
$108,725
1
$5,560
0
$0
Aggregated Statistics For Year 2008 (Based on 2 full and 4 partial tracts)
A) FHA, FSA/RHS & VA Home Purchase Loans
B) Conventional Home Purchase Loans
C) Refinancings
D) Home Improvement Loans
F) Non-occupant Loans on < 5 Family Dwellings (A B C & D)
G) Loans On Manufactured Home Dwelling (A B C & D)
Number
Average Value
Number
Average Value
Number
Average Value
Number
Average Value
Number
Average Value
Number
Average Value
LOANS ORIGINATED
30
$100,950
20
$83,970
25
$82,941
15
$23,419
4
$36,125
2
$78,305
APPLICATIONS APPROVED, NOT ACCEPTED
0
$0
3
$67,020
8
$98,134
6
$23,540
0
$0
2
$70,315
APPLICATIONS DENIED
6
$75,767
6
$79,318
38
$77,274
34
$32,468
6
$36,837
2
$111,330
APPLICATIONS WITHDRAWN
3
$93,607
2
$82,095
19
$72,422
3
$52,183
1
$84,800
2
$77,150
FILES CLOSED FOR INCOMPLETENESS
0
$0
0
$0
1
$146,570
2
$39,710
0
$0
0
$0
Aggregated Statistics For Year 2007 (Based on 2 full and 4 partial tracts)
A) FHA, FSA/RHS & VA Home Purchase Loans
B) Conventional Home Purchase Loans
C) Refinancings
D) Home Improvement Loans
F) Non-occupant Loans on < 5 Family Dwellings (A B C & D)
G) Loans On Manufactured Home Dwelling (A B C & D)
Number
Average Value
Number
Average Value
Number
Average Value
Number
Average Value
Number
Average Value
Number
Average Value
LOANS ORIGINATED
11
$90,420
42
$78,633
42
$76,049
22
$17,289
2
$68,785
1
$62,560
APPLICATIONS APPROVED, NOT ACCEPTED
0
$0
1
$55,350
9
$64,226
4
$19,822
0
$0
0
$0
APPLICATIONS DENIED
3
$79,633
10
$48,705
56
$100,999
51
$19,748
9
$28,117
5
$39,474
APPLICATIONS WITHDRAWN
2
$61,950
7
$58,980
23
$98,528
6
$75,643
0
$0
1
$25,020
FILES CLOSED FOR INCOMPLETENESS
0
$0
1
$54,220
5
$84,264
0
$0
0
$0
0
$0
Aggregated Statistics For Year 2006 (Based on 2 full and 4 partial tracts)
A) FHA, FSA/RHS & VA Home Purchase Loans
B) Conventional Home Purchase Loans
C) Refinancings
D) Home Improvement Loans
F) Non-occupant Loans on < 5 Family Dwellings (A B C & D)
G) Loans On Manufactured Home Dwelling (A B C & D)
Number
Average Value
Number
Average Value
Number
Average Value
Number
Average Value
Number
Average Value
Number
Average Value
LOANS ORIGINATED
26
$76,848
46
$70,477
53
$58,997
37
$24,752
9
$56,453
0
$0
APPLICATIONS APPROVED, NOT ACCEPTED
0
$0
3
$105,277
10
$58,364
3
$12,353
0
$0
1
$119,560
APPLICATIONS DENIED
1
$37,540
11
$69,836
47
$72,034
32
$20,723
0
$0
2
$14,705
APPLICATIONS WITHDRAWN
2
$103,260
2
$60,050
30
$72,283
6
$39,313
0
$0
2
$9,765
FILES CLOSED FOR INCOMPLETENESS
0
$0
2
$70,815
7
$90,277
0
$0
0
$0
0
$0
Aggregated Statistics For Year 2005 (Based on 2 full and 4 partial tracts)
A) FHA, FSA/RHS & VA Home Purchase Loans
B) Conventional Home Purchase Loans
C) Refinancings
D) Home Improvement Loans
F) Non-occupant Loans on < 5 Family Dwellings (A B C & D)
G) Loans On Manufactured Home Dwelling (A B C & D)
Number
Average Value
Number
Average Value
Number
Average Value
Number
Average Value
Number
Average Value
Number
Average Value
LOANS ORIGINATED
9
$92,864
44
$85,800
53
$72,054
25
$20,781
11
$60,517
2
$77,245
APPLICATIONS APPROVED, NOT ACCEPTED
0
$0
2
$120,635
6
$86,125
8
$19,916
1
$173,780
0
$0
APPLICATIONS DENIED
0
$0
9
$47,697
52
$74,843
32
$26,485
4
$29,340
4
$30,932
APPLICATIONS WITHDRAWN
1
$101,480
4
$104,840
40
$84,925
9
$66,763
0
$0
0
$0
FILES CLOSED FOR INCOMPLETENESS
0
$0
2
$95,125
11
$96,929
3
$28,290
1
$73,680
0
$0
Aggregated Statistics For Year 2004 (Based on 2 full and 4 partial tracts)
A) FHA, FSA/RHS & VA Home Purchase Loans
B) Conventional Home Purchase Loans
C) Refinancings
D) Home Improvement Loans
F) Non-occupant Loans on < 5 Family Dwellings (A B C & D)
G) Loans On Manufactured Home Dwelling (A B C & D)
Number
Average Value
Number
Average Value
Number
Average Value
Number
Average Value
Number
Average Value
Number
Average Value
LOANS ORIGINATED
23
$68,927
40
$80,272
68
$72,838
26
$14,855
4
$48,648
1
$55,610
APPLICATIONS APPROVED, NOT ACCEPTED
4
$135,230
4
$33,208
9
$87,812
3
$51,960
2
$66,410
3
$37,593
APPLICATIONS DENIED
1
$65,340
9
$73,902
78
$66,624
22
$18,350
4
$53,995
3
$30,303
APPLICATIONS WITHDRAWN
0
$0
4
$73,585
49
$68,455
2
$36,690
1
$132,070
2
$66,730
FILES CLOSED FOR INCOMPLETENESS
0
$0
0
$0
13
$79,415
2
$7,855
0
$0
0
$0
Aggregated Statistics For Year 2003 (Based on 2 full and 4 partial tracts)
A) FHA, FSA/RHS & VA Home Purchase Loans
B) Conventional Home Purchase Loans
C) Refinancings
D) Home Improvement Loans
F) Non-occupant Loans on < 5 Family Dwellings (A B C & D)
Number
Average Value
Number
Average Value
Number
Average Value
Number
Average Value
Number
Average Value
LOANS ORIGINATED
26
$69,034
40
$73,404
121
$73,289
24
$14,890
4
$58,040
APPLICATIONS APPROVED, NOT ACCEPTED
1
$47,440
3
$64,537
20
$69,590
1
$9,320
1
$44,490
APPLICATIONS DENIED
1
$76,460
13
$44,640
55
$60,296
16
$17,019
3
$57,693
APPLICATIONS WITHDRAWN
2
$44,900
1
$22,240
44
$76,007
1
$29,090
0
$0
FILES CLOSED FOR INCOMPLETENESS
0
$0
1
$87,580
6
$61,698
0
$0
0
$0
Aggregated Statistics For Year 2002 (Based on 2 full and 4 partial tracts)
A) FHA, FSA/RHS & VA Home Purchase Loans
B) Conventional Home Purchase Loans
C) Refinancings
D) Home Improvement Loans
F) Non-occupant Loans on < 5 Family Dwellings (A B C & D)
Number
Average Value
Number
Average Value
Number
Average Value
Number
Average Value
Number
Average Value
LOANS ORIGINATED
34
$58,994
33
$78,652
80
$65,159
21
$15,460
2
$19,160
APPLICATIONS APPROVED, NOT ACCEPTED
0
$0
6
$39,788
11
$57,576
4
$5,792
0
$0
APPLICATIONS DENIED
1
$114,000
14
$32,256
62
$70,112
35
$11,649
6
$20,073
APPLICATIONS WITHDRAWN
2
$53,590
1
$126,800
46
$68,716
6
$21,420
0
$0
FILES CLOSED FOR INCOMPLETENESS
0
$0
3
$36,610
7
$51,219
0
$0
0
$0
Aggregated Statistics For Year 2001 (Based on 2 full and 4 partial tracts)
A) FHA, FSA/RHS & VA Home Purchase Loans
B) Conventional Home Purchase Loans
C) Refinancings
D) Home Improvement Loans
F) Non-occupant Loans on < 5 Family Dwellings (A B C & D)
Number
Average Value
Number
Average Value
Number
Average Value
Number
Average Value
Number
Average Value
LOANS ORIGINATED
25
$50,661
29
$72,777
48
$71,361
30
$13,179
4
$45,740
APPLICATIONS APPROVED, NOT ACCEPTED
0
$0
4
$54,240
10
$35,793
6
$20,720
0
$0
APPLICATIONS DENIED
1
$52,240
10
$46,266
49
$61,627
26
$12,790
0
$0
APPLICATIONS WITHDRAWN
2
$64,830
1
$88,960
43
$73,357
1
$49,980
0
$0
FILES CLOSED FOR INCOMPLETENESS
0
$0
0
$0
5
$69,380
0
$0
0
$0
Aggregated Statistics For Year 2000 (Based on 2 full and 4 partial tracts)
A) FHA, FSA/RHS & VA Home Purchase Loans
B) Conventional Home Purchase Loans
C) Refinancings
D) Home Improvement Loans
F) Non-occupant Loans on < 5 Family Dwellings (A B C & D)
Number
Average Value
Number
Average Value
Number
Average Value
Number
Average Value
Number
Average Value
LOANS ORIGINATED
26
$51,015
52
$61,991
32
$47,456
28
$9,886
5
$44,356
APPLICATIONS APPROVED, NOT ACCEPTED
1
$43,100
8
$40,539
9
$39,223
11
$9,914
0
$0
APPLICATIONS DENIED
2
$106,450
17
$44,005
25
$49,935
21
$19,023
0
$0
APPLICATIONS WITHDRAWN
2
$42,035
4
$44,075
15
$52,504
1
$5,080
0
$0
FILES CLOSED FOR INCOMPLETENESS
2
$100,590
4
$76,460
5
$61,608
0
$0
0
$0
Aggregated Statistics For Year 1999 (Based on 1 full and 2 partial tracts)
A) FHA, FSA/RHS & VA Home Purchase Loans
B) Conventional Home Purchase Loans
C) Refinancings
D) Home Improvement Loans
F) Non-occupant Loans on < 5 Family Dwellings (A B C & D)
2003 - 2018 National Fire Incident Reporting System (NFIRS) incidents
Based on the data from the years 2003 - 2018 the average number of fires per year is 29. The highest number of fires - 58 took place in 2012, and the least - 5 in 2005. The data has an increasing trend.
When looking into fire subcategories, the most reports belonged to: Structure Fires (56.6%), and Outside Fires (22.4%).
Fire incident types reported to NFIRS in Zip Code 13120


 Nearest zip codes: 13215, 13084, 13205, 13207, 13210, 13110.


 . Tribal Land


 Based on the data from the years 2003 - 2018 the average number of fires per year is 29. The highest number of fires - 58 took place in 2012, and the least - 5 in 2005. The data has an increasing trend.
 When looking into fire subcategories, the most reports belonged to: Structure Fires (56.6%), and Outside Fires (22.4%).