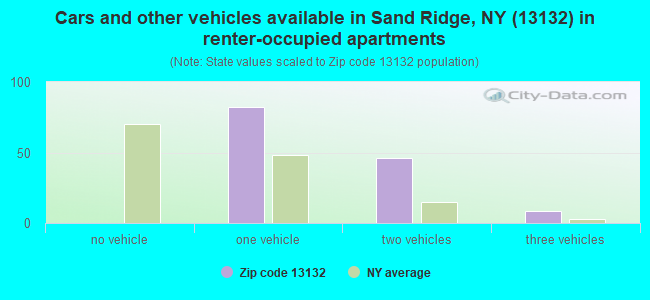
Estimated zip code population in 2022: 3,439 Zip code population in 2010: 4,244 Zip code population in 2000: 4,310
Houses and condos: 1,806 Renter-occupied apartments: 136
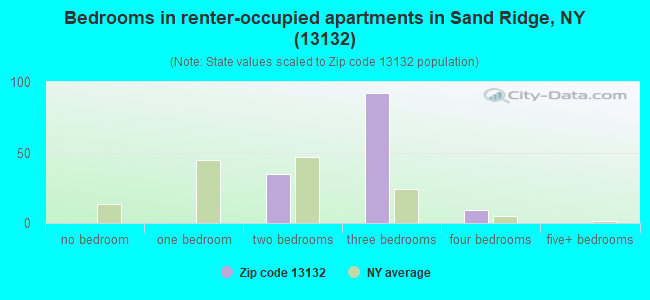
% of renters here:
8%
State:
46%
March 2022 cost of living index in zip code 13132: 95.3 (near average, U.S. average is 100)
Land area: 23.7 sq. mi. Water area: 0.4 sq. mi.
Population density: 145 people per square mile
(very low).
OSM Map
General Map
Google Map
MSN Map
OSM Map
General Map
Google Map
MSN Map
OSM Map
General Map
Google Map
MSN Map
OSM Map
General Map
Google Map
MSN Map
Please wait while loading the map...
Real estate property taxes paid for housing units in 2022:
This zip code:
2.3% ($4,539)
New York:
1.5% ($6,180)
Median real estate property taxes paid for housing units with mortgages in 2022: $4,561 (2.2%) Median real estate property taxes paid for housing units with no mortgage in 2022: $4,535 (2.8%)
Business Search- 14 Million verified businesses
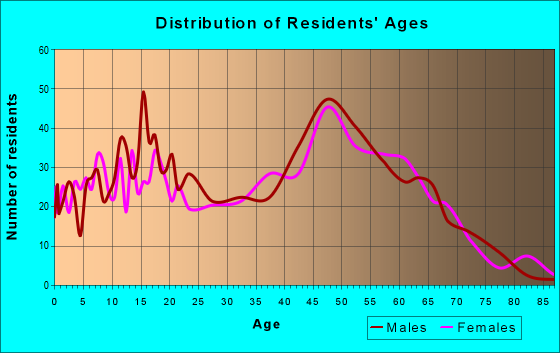
Males: 1,810
(52.6%)
Females: 1,629
(47.4%)
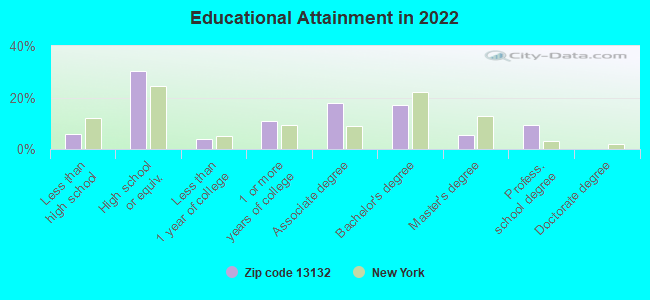
For population 25 years and over in 13132:
High school or higher: 93.5%
Bachelor's degree or higher: 31.2%
Graduate or professional degree: 14.4%
Unemployed: 4.7%
Mean travel time to work (commute): 19.8 minutes
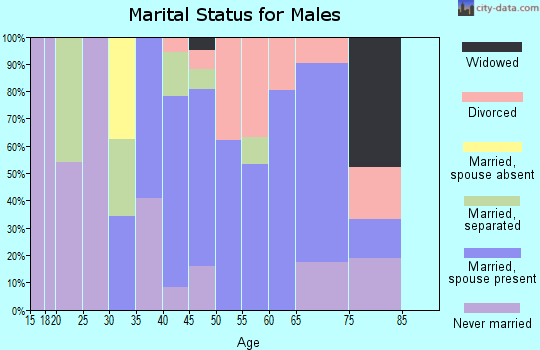
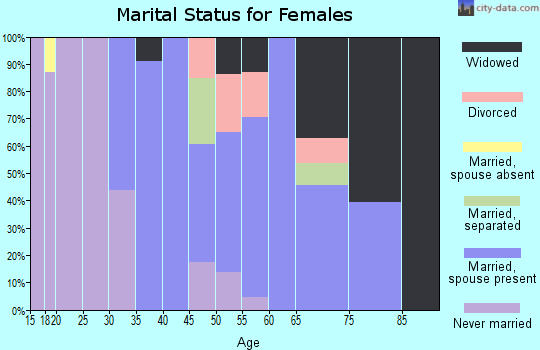
For population 15 years and over in 13132:
Never married: 36.5%
Now married: 51.4%
Separated: 0.8%
Widowed: 4.1%
Divorced: 7.2%
Zip code 13132 compared to state average:
Median house value below state average.
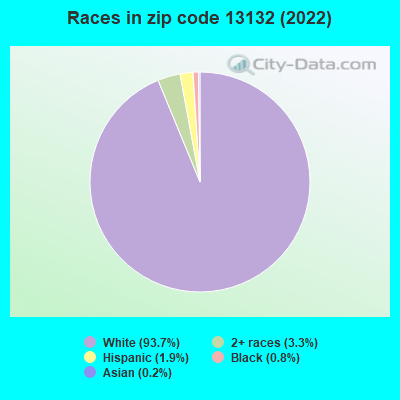
Black race population percentage significantly below state average.
Hispanic race population percentage significantly below state average.
Median age significantly above state average.
Foreign-born population percentage significantly below state average.
Renting percentage significantly below state average.
Length of stay since moving in above state average.
Averages for the 2020 tax year for zip code 13132, filed in 2021:
Average Adjusted Gross Income (AGI) in 2020: $60,601 (Individual Income Tax Returns)
Here:
$60,601
State:
$90,930
Salary/wage: $52,021 (reported on 80.7% of returns)
Here:
$52,021
State:
$72,104
(% of AGI for various income ranges: 1106.3% for AGIs below $25k, 3388.8% for AGIs $25k-50k, 6130.0% for AGIs $50k-75k, 8848.0% for AGIs $75k-100k, 14786.8% for AGIs $100k-200k)
Taxable interest for individuals: $776 (reported on 37.0% of returns)
This zip code:
$776
New York:
$3,075
(% of AGI for various income ranges: 6.8% for AGIs below $25k, 13.4% for AGIs $25k-50k, 40.0% for AGIs $50k-75k, 41.3% for AGIs $75k-100k, 91.1% for AGIs $100k-200k)
Ordinary dividends: $3,831 (reported on 18.2% of returns)
Here:
$3,831
State:
$11,095
(% of AGI for various income ranges: 30.5% for AGIs below $25k, 8.5% for AGIs $25k-50k, 85.7% for AGIs $50k-75k, 94.7% for AGIs $75k-100k, 312.6% for AGIs $100k-200k)
Net capital gain/loss in AGI: +$6,844 (reported on 13.0% of returns)
Here:
+$6,844
State:
+$44,925
(% of AGI for various income ranges: 6.8% for AGIs below $25k, 20.2% for AGIs $25k-50k, 24.8% for AGIs $50k-75k, 131.3% for AGIs $75k-100k, 383.7% for AGIs $100k-200k)
Profit/loss from business: +$18,591 (reported on 12.0% of returns)
Here:
+$18,591
State:
+$14,940
(% of AGI for various income ranges: 87.1% for AGIs below $25k, 99.8% for AGIs $25k-50k, 121.7% for AGIs $50k-75k, 306.0% for AGIs $75k-100k, 1472.1% for AGIs $100k-200k)
Taxable individual retirement arrangement distribution: $15,522 (reported on 12.0% of returns)
13132:
$15,522
New York:
$19,609
(% of AGI for various income ranges: 74.5% for AGIs below $25k, 80.2% for AGIs $25k-50k, 207.8% for AGIs $50k-75k, 488.0% for AGIs $75k-100k, 920.0% for AGIs $100k-200k)
Total itemized deductions: $24,190 (reported on 5.2% of returns)
Here:
$24,190
State:
$39,326
(% of AGI for various income ranges: 146.1% for AGIs below $25k, 292.6% for AGIs $50k-75k, 239.3% for AGIs $75k-100k, 437.9% for AGIs $100k-200k)
Charity contributions: $4,183 (reported on 3.1% of returns)
Here:
$4,183
State:
$15,420
(% of AGI for various income ranges: 26.1% for AGIs $50k-75k, 100.5% for AGIs $100k-200k)
Taxes paid: $7,860 (reported on 5.2% of returns)
13132:
$7,860
State:
$9,183
(% of AGI for various income ranges: 137.8% for AGIs $50k-75k, 126.7% for AGIs $75k-100k, 146.8% for AGIs $100k-200k)
Earned income credit: $2,012 (reported on 13.5% of returns)
Here:
$2,012
State:
$2,138
(% of AGI for various income ranges: 76.3% for AGIs below $25k, 56.8% for AGIs $25k-50k)
Percentage of individuals using paid preparers for their 2020 taxes: 95.8%
Here:
96%
State:
95%
(% for various income ranges: 94.3% for AGIs below $25k, 98.0% for AGIs $25k-50k, 93.5% for AGIs $50k-75k, 95.5% for AGIs $75k-100k, 96.7% for AGIs $100k-200k, 100.0% for AGIs over 200k)
Averages for the 2012 tax year for zip code 13132, filed in 2013:
Average Adjusted Gross Income (AGI) in 2012: $48,928 (Individual Income Tax Returns)
Here:
$48,928
State:
$77,088
Salary/wage: $43,166 (reported on 87.5% of returns)
Here:
$43,166
State:
$60,593
(% of AGI for various income ranges: 74.8% for AGIs below $25k, 80.6% for AGIs $25k-50k, 75.5% for AGIs $50k-75k, 77.6% for AGIs $75k-100k, 79.5% for AGIs $100k-200k, 63.9% for AGIs over 200k)
Taxable interest for individuals: $491 (reported on 40.6% of returns)
This zip code:
$491
New York:
$3,125
(% of AGI for various income ranges: 0.9% for AGIs below $25k, 0.2% for AGIs $25k-50k, 0.4% for AGIs $50k-75k, 0.1% for AGIs $75k-100k, 0.7% for AGIs $100k-200k)
Ordinary dividends: $2,326 (reported on 19.8% of returns)
Here:
$2,326
State:
$10,299
(% of AGI for various income ranges: 0.7% for AGIs below $25k, 0.5% for AGIs $25k-50k, 0.6% for AGIs $50k-75k, 1.0% for AGIs $75k-100k, 1.7% for AGIs $100k-200k)
Net capital gain/loss in AGI: +$1,343 (reported on 12.0% of returns)
Here:
+$1,343
State:
+$42,474
(% of AGI for various income ranges: 0.2% for AGIs $25k-50k, 0.5% for AGIs $75k-100k, 0.7% for AGIs $100k-200k)
Profit/loss from business: +$11,105 (reported on 10.9% of returns)
Here:
+$11,105
State:
+$16,168
(% of AGI for various income ranges: 4.5% for AGIs below $25k, 1.8% for AGIs $25k-50k, 1.7% for AGIs $50k-75k, 2.8% for AGIs $75k-100k, 3.1% for AGIs $100k-200k)
Taxable individual retirement arrangement distribution: $12,819 (reported on 8.3% of returns)
13132:
$12,819
New York:
$17,621
(% of AGI for various income ranges: 2.2% for AGIs below $25k, 2.2% for AGIs $25k-50k, 2.6% for AGIs $50k-75k, 2.3% for AGIs $75k-100k, 2.3% for AGIs $100k-200k)
Total itemized deductions: $18,540 (20% of AGI, reported on 29.7% of returns)
Here:
$18,540
State:
$34,985
Here:
20.1% of AGI
State:
21.3% of AGI
(% of AGI for various income ranges: 3.8% for AGIs below $25k, 5.8% for AGIs $25k-50k, 12.1% for AGIs $50k-75k, 11.7% for AGIs $75k-100k, 15.6% for AGIs $100k-200k, 14.3% for AGIs over 200k)
Charity contributions: $2,085 (reported on 25.0% of returns)
Here:
$2,085
State:
$5,572
(% of AGI for various income ranges: 0.6% for AGIs $25k-50k, 0.9% for AGIs $50k-75k, 1.2% for AGIs $75k-100k, 1.7% for AGIs $100k-200k, 1.1% for AGIs over 200k)
Taxes paid: $9,947 (reported on 29.7% of returns)
13132:
$9,947
State:
$18,656
(% of AGI for various income ranges: 1.2% for AGIs below $25k, 2.6% for AGIs $25k-50k, 5.5% for AGIs $50k-75k, 6.0% for AGIs $75k-100k, 9.0% for AGIs $100k-200k, 10.7% for AGIs over 200k)
Earned income credit: $1,991 (reported on 17.7% of returns)
Here:
$1,991
State:
$2,230
(% of AGI for various income ranges: 5.6% for AGIs below $25k, 1.1% for AGIs $25k-50k)
Percentage of individuals using paid preparers for their 2012 taxes: 53.6%
Here:
54%
State:
66%
(% for various income ranges: 45.9% for AGIs below $25k, 52.1% for AGIs $25k-50k, 59.3% for AGIs $50k-75k, 65.0% for AGIs $75k-100k, 71.4% for AGIs $100k-200k)
Averages for the 2004 tax year for zip code 13132, filed in 2005:
Average Adjusted Gross Income (AGI) in 2004: $40,130 (Individual Income Tax Returns)
Here:
$40,130
State:
$59,519
Salary/wage: $36,737 (reported on 90.0% of returns)
Here:
$36,737
State:
$50,673
(% of AGI for various income ranges: 91.5% for AGIs below $10k, 83.3% for AGIs $10k-25k, 81.5% for AGIs $25k-50k, 83.5% for AGIs $50k-75k, 86.7% for AGIs $75k-100k, 75.9% for AGIs over 100k)
Taxable interest for individuals: $564 (reported on 46.6% of returns)
This zip code:
$564
New York:
$2,377
(% of AGI for various income ranges: 2.2% for AGIs below $10k, 0.7% for AGIs $10k-25k, 0.4% for AGIs $25k-50k, 0.5% for AGIs $50k-75k, 0.3% for AGIs $75k-100k, 1.4% for AGIs over 100k)
Taxable dividends: $1,345 (reported on 22.5% of returns)
Here:
$1,345
State:
$5,394
(% of AGI for various income ranges: 1.2% for AGIs below $10k, 0.7% for AGIs $10k-25k, 0.5% for AGIs $25k-50k, 0.6% for AGIs $50k-75k, 0.4% for AGIs $75k-100k, 1.6% for AGIs over 100k)
Net capital gain/loss: +$1,114 (reported on 13.5% of returns)
Here:
+$1,114
State:
+$23,581
(% of AGI for various income ranges: -0.5% for AGIs below $10k, 0.2% for AGIs $10k-25k, 0.1% for AGIs $25k-50k, 0.2% for AGIs $50k-75k, 0.8% for AGIs $75k-100k, 0.8% for AGIs over 100k)
Profit/loss from business: +$9,858 (reported on 11.5% of returns)
Here:
+$9,858
State:
+$13,809
(% of AGI for various income ranges: 6.2% for AGIs below $10k, 1.4% for AGIs $10k-25k, 3.1% for AGIs $25k-50k, 1.4% for AGIs $50k-75k, 2.2% for AGIs $75k-100k, 5.2% for AGIs over 100k)
IRA payment deduction: $2,727 (reported on 2.3% of returns)
13132:
$2,727
New York:
$3,115
Total itemized deductions: $15,419 (22% of AGI, reported on 33.0% of returns)
Here:
$15,419
State:
$25,864
Here:
21.6% of AGI
State:
21.9% of AGI
(% of AGI for various income ranges: 9.9% for AGIs below $10k, 6.9% for AGIs $10k-25k, 9.3% for AGIs $25k-50k, 12.5% for AGIs $50k-75k, 16.0% for AGIs $75k-100k, 16.4% for AGIs over 100k)
Charity contributions deductions: $1,889 (3% of AGI, reported on 30.1% of returns)
Here:
$1,889
State:
$4,439
Here:
2.6% of AGI
State:
3.6% of AGI
(% of AGI for various income ranges: 0.6% for AGIs below $10k, 0.7% for AGIs $10k-25k, 1.1% for AGIs $25k-50k, 1.4% for AGIs $50k-75k, 1.9% for AGIs $75k-100k, 1.6% for AGIs over 100k)
Total tax: $4,876 (reported on 75.3% of returns)
13132:
$4,876
State:
$11,730
(% of AGI for various income ranges: 2.3% for AGIs below $10k, 3.7% for AGIs $10k-25k, 7.1% for AGIs $25k-50k, 8.5% for AGIs $50k-75k, 9.7% for AGIs $75k-100k, 15.3% for AGIs over 100k)
Earned income credit: $1,725 (reported on 15.5% of returns)
Here:
$1,725
State:
$1,757
Percentage of individuals using paid preparers for their 2004 taxes: 59.3%
Here:
59%
State:
67%
(% for various income ranges: 46.2% for AGIs below $10k, 61.1% for AGIs $10k-25k, 62.3% for AGIs $25k-50k, 62.8% for AGIs $50k-75k, 61.4% for AGIs $75k-100k, 74.1% for AGIs over 100k)
Household received Food Stamps/SNAP in the past 12 months: 186 Household did not receive Food Stamps/SNAP in the past 12 months: 1,476
Women who had a birth in the past 12 months: 43 (0 now married, 45 unmarried) Women who did not have a birth in the past 12 months: 623 (238 now married, 384 unmarried)
Housing units in zip code 13132 with a mortgage: 980 (58 second mortgage, 48 both second mortgage and home equity loan) Houses without a mortgage: 163
Median monthly owner costs for units with a mortgage: $1,307 Median monthly owner costs for units without a mortgage: $661
Residents with income below the poverty level in 2022:
This zip code:
15.2%
Whole state:
14.3%
Residents with income below 50% of the poverty level in 2022:
This zip code:
8.2%
Whole state:
6.8%
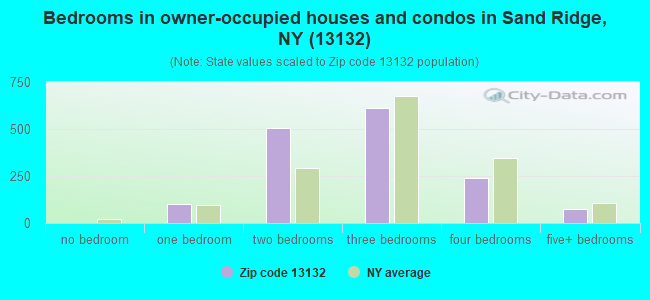
Median number of rooms in houses and condos:
Here:
5.8
State:
6.3
Median number of rooms in apartments:
Here:
6.1
State:
3.8
Notable locations in this zip code not listed on our city pages
Size of family households: 497 2-persons, 141 3-persons, 214 4-persons, 66 5-persons, 19 6-persons, 41 7-or-more-persons
Size of nonfamily households: 627 1-person, 70 2-persons
416 married couples with children.
214 single-parent households (26 men, 188 women).
97.7% of residents of 13132 zip code speak English at home.
0.5% of residents speak Spanish at home (100% very well).
1.6% of residents speak other Indo-European language at home (100% very well).
Foreign born population: 0 (0.0%)
:
0.0%
Whole state:
22.7%
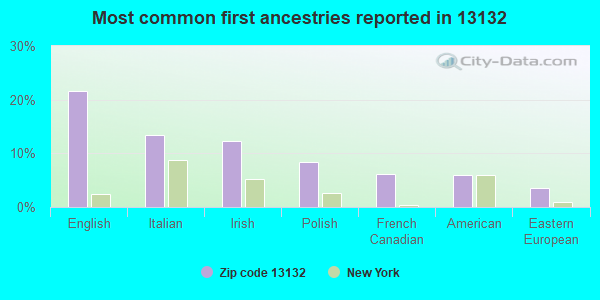
22%English
13%Italian
12%Irish
8%Polish
6%French Canadian
6%American
4%Eastern European
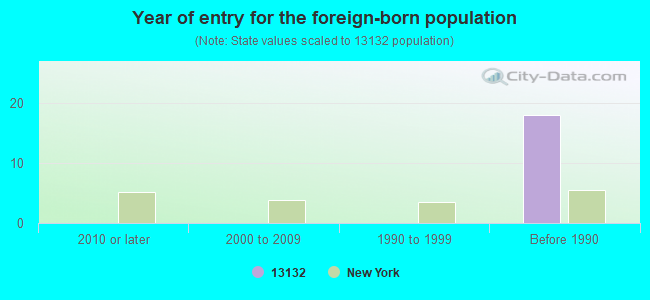
Year of entry for the foreign-born population
02010 or later
02000 to 2009
01990 to 1999
18Before 1990
Facilities with environmental interests located in this zip code:
CENTRAL NEW YORK ROD & GUN CLUB (182 PETER SCOTT RD in PENNELLVILLE, NY)
STATE MASTER (New York facility tracking) - SECTION 404 PERMITTING, 401 CERTIFICATION (Integrated Compliance Information System) - ICIS-02-2005-7304, ENFORCEMENT/COMPLIANCE ACTIVITY FORMAL ENFORCEMENT ACTION (Integrated Compliance Information System) - ICIS-02-2005-7304, ENFORCEMENT/COMPLIANCE ACTIVITY (Resource Conservation and Recovery Act (tracking hazardous waste)) Organizations: CENTRAL NEW YORK ROD AND GUN CLUB INC
Housing units lacking complete kitchen facilities: 0.8%
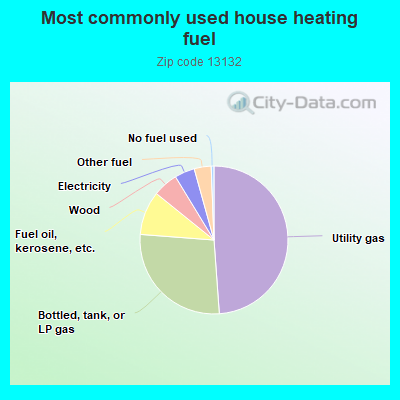
48.9%Utility gas
27.4%Bottled, tank, or LP gas
9.6%Fuel oil, kerosene, etc.
5.5%Wood
4.4%Electricity
3.7%Other fuel
0.6%No fuel used
Population in 1990: 4,566.
Place of birth for U.S.-born residents:
This state: 2,885
Northeast: 151
Midwest: 175
South: 64
West: 144
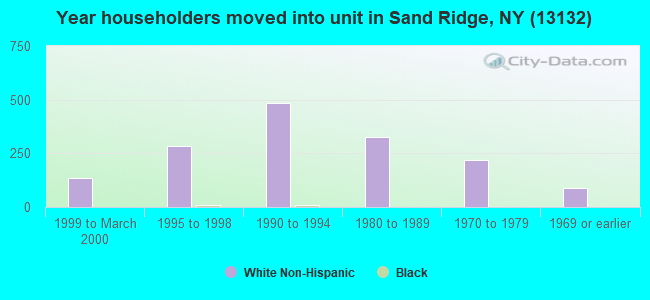
79% of the 13132 zip code residents lived in the same house 5 years ago. Out of people who lived in different houses, 50% lived in this county. Out of people who lived in different counties, 50% lived in New York.
96% of the 13132 zip code residents lived in the same house 1 year ago. Out of people who lived in different houses, 43% moved from this county. Out of people who lived in different houses, 54% moved from different county within same state.
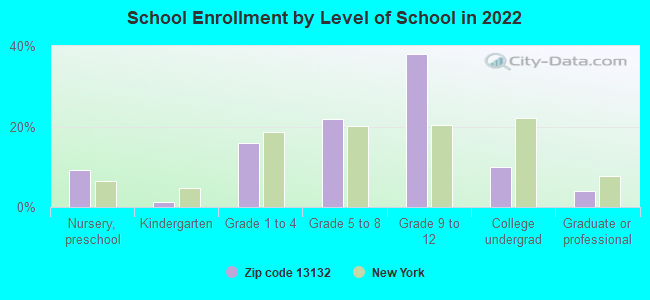
Private vs. public school enrollment:
Students in private schools in grades 1 to 8 (elementary and middle school): 50
Here:
19.7%
New York:
15.6%
Students in private schools in grades 9 to 12 (high school): 16
Here:
6.5%
New York:
15.0%
Students in private undergraduate colleges: 51
Here:
74.7%
New York:
39.2%
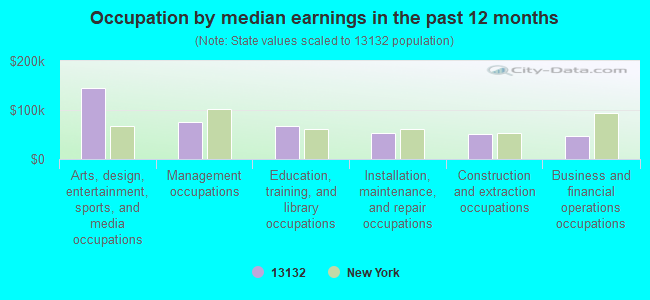
Occupation by median earnings in the past 12 months ($)
145,456Arts, design, entertainment, sports, and media occupations
75,838Management occupations
67,896Education, training, and library occupations
52,279Installation, maintenance, and repair occupations
51,101Construction and extraction occupations
47,319Business and financial operations occupations
Top industries in this zip code by the number of employees in 2005:
Wholesale Trade: Recyclable Material Merchant Wholesalers (20-49 employees: 1 establishment)
Administrative and Support and Waste Management and Remediation Services: Janitorial Services (20-49: 1)
Other Services (except Public Administration): General Automotive Repair (5-9: 2)
Construction: Residential Remodelers (1-4: 3)
Real Estate and Rental and Leasing: Lessors of Residential Buildings and Dwellings (1-4: 1)
Educational Services: Exam Preparation and Tutoring (1-4: 1)
Construction: Siding Contractors (1-4: 1)
Finance and Insurance: Insurance Agencies and Brokerages (1-4: 1)
Fatal accident statistics in 2012:
Fatal accident count: 1
Vehicles involved in fatal accidents: 1
Fatal accidents caused by drunken drivers: 0
Fatalities: 1
Persons involved in fatal accidents: 1
Pedestrians involved in fatal accidents: 0
Fatal accident statistics in 2010:
Fatal accident count: 1
Vehicles involved in fatal accidents: 2
Fatal accidents caused by drunken drivers: 0
Fatalities: 1
Persons involved in fatal accidents: 2
Pedestrians involved in fatal accidents: 0
Home Mortgage Disclosure Act Aggregated Statistics For Year 2009 (Based on 4 partial tracts)
A) FHA, FSA/RHS & VA Home Purchase Loans
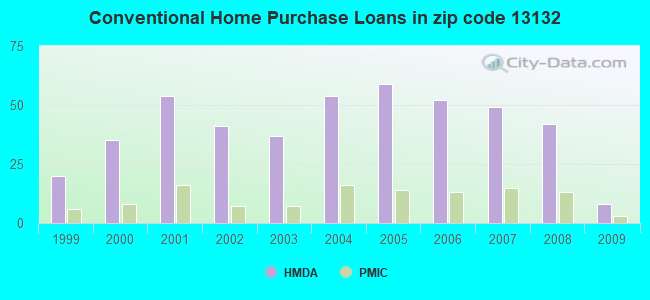
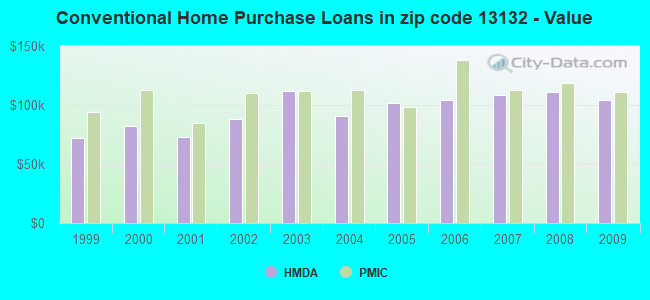
B) Conventional Home Purchase Loans
C) Refinancings
D) Home Improvement Loans
F) Non-occupant Loans on < 5 Family Dwellings (A B C & D)
G) Loans On Manufactured Home Dwelling (A B C & D)
Number
Average Value
Number
Average Value
Number
Average Value
Number
Average Value
Number
Average Value
Number
Average Value
LOANS ORIGINATED
19
$115,923
8
$103,988
86
$118,048
26
$24,425
3
$98,430
5
$74,934
APPLICATIONS APPROVED, NOT ACCEPTED
1
$166,170
3
$40,573
12
$93,668
1
$63,500
1
$71,970
2
$44,980
APPLICATIONS DENIED
4
$90,758
13
$63,992
34
$96,781
12
$12,612
1
$48,690
13
$60,817
APPLICATIONS WITHDRAWN
1
$106,900
2
$120,660
23
$130,643
2
$71,440
0
$0
0
$0
FILES CLOSED FOR INCOMPLETENESS
0
$0
0
$0
1
$107,960
0
$0
0
$0
0
$0
Aggregated Statistics For Year 2008 (Based on 4 partial tracts)
A) FHA, FSA/RHS & VA Home Purchase Loans
B) Conventional Home Purchase Loans
C) Refinancings
D) Home Improvement Loans
F) Non-occupant Loans on < 5 Family Dwellings (A B C & D)
G) Loans On Manufactured Home Dwelling (A B C & D)
Number
Average Value
Number
Average Value
Number
Average Value
Number
Average Value
Number
Average Value
Number
Average Value
LOANS ORIGINATED
21
$115,416
42
$111,082
76
$95,437
32
$45,015
3
$95,960
4
$59,535
APPLICATIONS APPROVED, NOT ACCEPTED
0
$0
11
$94,775
12
$98,519
2
$34,400
0
$0
4
$67,472
APPLICATIONS DENIED
2
$98,430
7
$116,424
43
$113,864
47
$34,049
1
$53,980
12
$56,448
APPLICATIONS WITHDRAWN
5
$146,906
0
$0
26
$113,778
6
$58,918
0
$0
4
$90,492
FILES CLOSED FOR INCOMPLETENESS
0
$0
1
$155,580
2
$62,445
2
$21,695
0
$0
0
$0
Aggregated Statistics For Year 2007 (Based on 4 partial tracts)
A) FHA, FSA/RHS & VA Home Purchase Loans
B) Conventional Home Purchase Loans
C) Refinancings
D) Home Improvement Loans
E) Loans on Dwellings For 5+ Families
F) Non-occupant Loans on < 5 Family Dwellings (A B C & D)
G) Loans On Manufactured Home Dwelling (A B C & D)
Number
Average Value
Number
Average Value
Number
Average Value
Number
Average Value
Number
Average Value
Number
Average Value
Number
Average Value
LOANS ORIGINATED
14
$115,744
49
$108,367
59
$95,884
29
$36,825
0
$0
3
$185,220
5
$50,804
APPLICATIONS APPROVED, NOT ACCEPTED
1
$99,490
10
$93,880
16
$81,828
3
$40,573
0
$0
1
$88,910
2
$36,515
APPLICATIONS DENIED
3
$123,833
17
$60,889
62
$90,613
30
$43,924
1
$264,600
2
$29,105
11
$37,044
APPLICATIONS WITHDRAWN
2
$89,965
6
$83,085
30
$100,054
3
$67,033
0
$0
0
$0
0
$0
FILES CLOSED FOR INCOMPLETENESS
0
$0
1
$200,040
10
$153,362
0
$0
0
$0
1
$453,000
0
$0
Aggregated Statistics For Year 2006 (Based on 4 partial tracts)
A) FHA, FSA/RHS & VA Home Purchase Loans
B) Conventional Home Purchase Loans
C) Refinancings
D) Home Improvement Loans
F) Non-occupant Loans on < 5 Family Dwellings (A B C & D)
G) Loans On Manufactured Home Dwelling (A B C & D)
Number
Average Value
Number
Average Value
Number
Average Value
Number
Average Value
Number
Average Value
Number
Average Value
LOANS ORIGINATED
20
$93,034
52
$104,028
74
$83,170
37
$31,495
5
$102,454
5
$64,774
APPLICATIONS APPROVED, NOT ACCEPTED
1
$42,340
2
$50,275
20
$91,076
7
$25,856
1
$71,970
0
$0
APPLICATIONS DENIED
3
$88,200
10
$64,139
83
$83,614
50
$33,615
4
$55,565
7
$48,837
APPLICATIONS WITHDRAWN
1
$74,090
7
$91,627
69
$76,435
2
$26,460
2
$74,090
4
$59,270
FILES CLOSED FOR INCOMPLETENESS
1
$85,730
0
$0
17
$112,626
2
$42,335
0
$0
0
$0
Aggregated Statistics For Year 2005 (Based on 4 partial tracts)
A) FHA, FSA/RHS & VA Home Purchase Loans
B) Conventional Home Purchase Loans
C) Refinancings
D) Home Improvement Loans
F) Non-occupant Loans on < 5 Family Dwellings (A B C & D)
G) Loans On Manufactured Home Dwelling (A B C & D)
Number
Average Value
Number
Average Value
Number
Average Value
Number
Average Value
Number
Average Value
Number
Average Value
LOANS ORIGINATED
11
$104,782
59
$101,337
86
$87,736
52
$29,147
8
$106,369
13
$43,232
APPLICATIONS APPROVED, NOT ACCEPTED
2
$120,660
4
$109,545
28
$64,865
6
$27,165
1
$71,970
1
$78,320
APPLICATIONS DENIED
3
$95,610
25
$97,712
98
$83,344
67
$30,378
11
$61,868
28
$46,834
APPLICATIONS WITHDRAWN
3
$69,150
16
$127,934
51
$94,488
11
$127,200
7
$140,314
5
$97,162
FILES CLOSED FOR INCOMPLETENESS
0
$0
3
$94,550
16
$120,724
1
$15,880
0
$0
0
$0
Aggregated Statistics For Year 2004 (Based on 4 partial tracts)
A) FHA, FSA/RHS & VA Home Purchase Loans
B) Conventional Home Purchase Loans
C) Refinancings
D) Home Improvement Loans
E) Loans on Dwellings For 5+ Families
F) Non-occupant Loans on < 5 Family Dwellings (A B C & D)
G) Loans On Manufactured Home Dwelling (A B C & D)
Number
Average Value
Number
Average Value
Number
Average Value
Number
Average Value
Number
Average Value
Number
Average Value
Number
Average Value
LOANS ORIGINATED
31
$91,978
54
$90,395
86
$91,785
44
$21,312
1
$899,640
7
$58,061
7
$43,091
APPLICATIONS APPROVED, NOT ACCEPTED
2
$111,660
5
$98,642
21
$70,409
7
$19,354
0
$0
1
$15,880
3
$28,930
APPLICATIONS DENIED
1
$37,040
15
$58,000
70
$79,229
25
$26,375
0
$0
2
$76,735
10
$41,383
APPLICATIONS WITHDRAWN
0
$0
8
$94,595
75
$84,841
6
$46,747
0
$0
2
$40,750
6
$88,553
FILES CLOSED FOR INCOMPLETENESS
0
$0
1
$101,610
6
$102,665
2
$45,510
0
$0
0
$0
0
$0
Aggregated Statistics For Year 2003 (Based on 4 partial tracts)
A) FHA, FSA/RHS & VA Home Purchase Loans
B) Conventional Home Purchase Loans
C) Refinancings
D) Home Improvement Loans
F) Non-occupant Loans on < 5 Family Dwellings (A B C & D)
Number
Average Value
Number
Average Value
Number
Average Value
Number
Average Value
Number
Average Value
LOANS ORIGINATED
14
$84,067
37
$111,475
169
$78,773
30
$27,271
2
$110,075
APPLICATIONS APPROVED, NOT ACCEPTED
0
$0
7
$53,676
25
$91,150
3
$13,760
1
$116,420
APPLICATIONS DENIED
2
$103,725
13
$97,454
76
$76,274
25
$17,654
1
$105,840
APPLICATIONS WITHDRAWN
0
$0
6
$135,122
70
$81,875
5
$32,810
1
$63,500
FILES CLOSED FOR INCOMPLETENESS
0
$0
1
$198,980
2
$91,020
0
$0
0
$0
Aggregated Statistics For Year 2002 (Based on 4 partial tracts)
A) FHA, FSA/RHS & VA Home Purchase Loans
B) Conventional Home Purchase Loans
C) Refinancings
D) Home Improvement Loans
F) Non-occupant Loans on < 5 Family Dwellings (A B C & D)
Number
Average Value
Number
Average Value
Number
Average Value
Number
Average Value
Number
Average Value
LOANS ORIGINATED
22
$82,892
41
$88,260
112
$69,533
32
$11,907
2
$41,805
APPLICATIONS APPROVED, NOT ACCEPTED
1
$60,330
5
$83,402
22
$75,916
4
$16,140
0
$0
APPLICATIONS DENIED
0
$0
24
$56,139
65
$67,363
21
$13,810
2
$16,405
APPLICATIONS WITHDRAWN
0
$0
3
$70,913
57
$70,337
10
$23,073
0
$0
FILES CLOSED FOR INCOMPLETENESS
0
$0
0
$0
12
$108,397
0
$0
0
$0
Aggregated Statistics For Year 2001 (Based on 4 partial tracts)
A) FHA, FSA/RHS & VA Home Purchase Loans
B) Conventional Home Purchase Loans
C) Refinancings
D) Home Improvement Loans
E) Loans on Dwellings For 5+ Families
F) Non-occupant Loans on < 5 Family Dwellings (A B C & D)
Number
Average Value
Number
Average Value
Number
Average Value
Number
Average Value
Number
Average Value
Number
Average Value
LOANS ORIGINATED
15
$89,047
54
$72,794
84
$70,925
25
$15,326
1
$675,260
2
$50,805
APPLICATIONS APPROVED, NOT ACCEPTED
2
$67,210
13
$67,168
15
$46,781
4
$11,378
0
$0
0
$0
APPLICATIONS DENIED
2
$42,865
41
$45,176
75
$67,455
25
$16,723
0
$0
0
$0
APPLICATIONS WITHDRAWN
1
$68,800
5
$56,942
55
$63,215
5
$36,198
0
$0
1
$47,630
FILES CLOSED FOR INCOMPLETENESS
1
$80,440
1
$63,500
6
$77,792
0
$0
0
$0
0
$0
Aggregated Statistics For Year 2000 (Based on 4 partial tracts)
A) FHA, FSA/RHS & VA Home Purchase Loans
B) Conventional Home Purchase Loans
C) Refinancings
D) Home Improvement Loans
F) Non-occupant Loans on < 5 Family Dwellings (A B C & D)
Number
Average Value
Number
Average Value
Number
Average Value
Number
Average Value
Number
Average Value
LOANS ORIGINATED
16
$70,781
35
$81,920
33
$66,679
38
$16,656
0
$0
APPLICATIONS APPROVED, NOT ACCEPTED
0
$0
20
$53,026
8
$40,088
16
$18,919
2
$66,150
APPLICATIONS DENIED
0
$0
57
$43,933
39
$62,690
17
$9,775
3
$20,817
APPLICATIONS WITHDRAWN
1
$46,570
6
$47,628
20
$49,850
2
$30,165
2
$45,510
FILES CLOSED FOR INCOMPLETENESS
0
$0
1
$42,340
8
$57,286
0
$0
0
$0
Aggregated Statistics For Year 1999 (Based on 2 partial tracts)
A) FHA, FSA/RHS & VA Home Purchase Loans
B) Conventional Home Purchase Loans
C) Refinancings
D) Home Improvement Loans
F) Non-occupant Loans on < 5 Family Dwellings (A B C & D)
Detailed PMIC statistics for the following Tracts:0209.02
2002 - 2018 National Fire Incident Reporting System (NFIRS) incidents
Based on the data from the years 2002 - 2018 the average number of fires per year is 12. The highest number of fires - 21 took place in 2014, and the least - 2 in 2007. The data has a decreasing trend.
When looking into fire subcategories, the most reports belonged to: Structure Fires (51.8%), and Outside Fires (24.6%).
Fire incident types reported to NFIRS in Zip Code 13132


 Nearest zip codes: 13135, 13036, 13041, 13029, 13090, 13076.
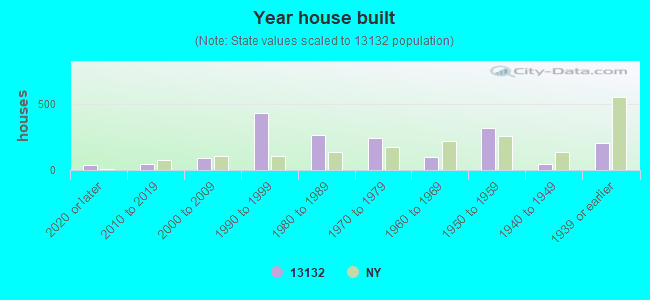


 Based on the data from the years 2002 - 2018 the average number of fires per year is 12. The highest number of fires - 21 took place in 2014, and the least - 2 in 2007. The data has a decreasing trend.
 When looking into fire subcategories, the most reports belonged to: Structure Fires (51.8%), and Outside Fires (24.6%).