Estimated zip code population in 2022: 2,141 Zip code population in 2010: 2,443 Zip code population in 2000: 2,541
Houses and condos: 834 Renter-occupied apartments: 184
% of renters here:
24%
State:
46%
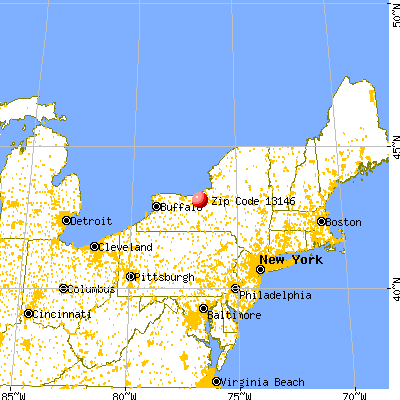
March 2022 cost of living index in zip code 13146: 93.1 (less than average, U.S. average is 100)
Land area: 54.4 sq. mi. Water area: 0.4 sq. mi.
Population density: 39 people per square mile
(very low).
OSM Map
General Map
Google Map
MSN Map
OSM Map
General Map
Google Map
MSN Map
OSM Map
General Map
Google Map
MSN Map
OSM Map
General Map
Google Map
MSN Map
Please wait while loading the map...
Real estate property taxes paid for housing units in 2022:
This zip code:
1.8% ($1,827)
New York:
1.5% ($6,180)
Median real estate property taxes paid for housing units with mortgages in 2022: $2,274 (1.8%) Median real estate property taxes paid for housing units with no mortgage in 2022: $1,670 (2.0%)
Business Search- 14 Million verified businesses
Males: 1,078
(50.4%)
Females: 1,062
(49.6%)
For population 25 years and over in 13146:
High school or higher: 81.3%
Bachelor's degree or higher: 8.2%
Graduate or professional degree: 3.6%
Unemployed: 10.3%
Mean travel time to work (commute): 26.5 minutes
For population 15 years and over in 13146:
Never married: 32.5%
Now married: 50.9%
Separated: 2.3%
Widowed: 5.8%
Divorced: 8.6%
Zip code 13146 compared to state average:
Median house value significantly below state average.
Unemployed percentage above state average.
Black race population percentage significantly below state average.
Hispanic race population percentage significantly below state average.
Median age below state average.
Foreign-born population percentage significantly below state average.
Renting percentage below state average.
Length of stay since moving in significantly above state average.
Number of rooms per house above state average.
Number of college students below state average.
Percentage of population with a bachelor's degree or higher significantly below state average.
Averages for the 2020 tax year for zip code 13146, filed in 2021:
Average Adjusted Gross Income (AGI) in 2020: $49,926 (Individual Income Tax Returns)
Here:
$49,926
State:
$90,930
Salary/wage: $42,876 (reported on 79.6% of returns)
Here:
$42,876
State:
$72,104
(% of AGI for various income ranges: 1227.9% for AGIs below $25k, 3163.5% for AGIs $25k-50k, 6087.5% for AGIs $50k-75k, 10234.3% for AGIs $75k-100k, 15300.0% for AGIs $100k-200k)
Taxable interest for individuals: $733 (reported on 32.3% of returns)
This zip code:
$733
New York:
$3,075
(% of AGI for various income ranges: 17.9% for AGIs below $25k, 7.8% for AGIs $25k-50k, 79.2% for AGIs $50k-75k, 51.4% for AGIs $75k-100k, 74.0% for AGIs $100k-200k)
Ordinary dividends: $1,578 (reported on 9.7% of returns)
Here:
$1,578
State:
$11,095
(% of AGI for various income ranges: 22.1% for AGIs below $25k, 16.1% for AGIs $25k-50k, 32.5% for AGIs $50k-75k, 34.3% for AGIs $75k-100k)
Net capital gain/loss in AGI: +$1,456 (reported on 9.7% of returns)
Here:
+$1,456
State:
+$44,925
(% of AGI for various income ranges: 27.4% for AGIs $25k-50k, 98.6% for AGIs $75k-100k)
Profit/loss from business: +$11,591 (reported on 11.8% of returns)
Here:
+$11,591
State:
+$14,940
(% of AGI for various income ranges: 62.6% for AGIs below $25k, 67.0% for AGIs $25k-50k, 201.7% for AGIs $50k-75k, 1520.0% for AGIs $100k-200k)
Taxable individual retirement arrangement distribution: $12,390 (reported on 10.8% of returns)
13146:
$12,390
New York:
$19,609
(% of AGI for various income ranges: 42.6% for AGIs below $25k, 156.5% for AGIs $25k-50k, 189.2% for AGIs $50k-75k, 815.7% for AGIs $75k-100k)
Earned income credit: $2,356 (reported on 17.2% of returns)
Here:
$2,356
State:
$2,138
(% of AGI for various income ranges: 108.4% for AGIs below $25k, 74.3% for AGIs $25k-50k)
Percentage of individuals using paid preparers for their 2020 taxes: 94.6%
Here:
95%
State:
95%
(% for various income ranges: 93.1% for AGIs below $25k, 96.4% for AGIs $25k-50k, 100.0% for AGIs $50k-75k, 90.9% for AGIs $75k-100k, 88.9% for AGIs $100k-200k)
Averages for the 2012 tax year for zip code 13146, filed in 2013:
Average Adjusted Gross Income (AGI) in 2012: $42,301 (Individual Income Tax Returns)
Here:
$42,301
State:
$77,088
Salary/wage: $36,088 (reported on 83.5% of returns)
Here:
$36,088
State:
$60,593
(% of AGI for various income ranges: 70.4% for AGIs below $25k, 80.4% for AGIs $25k-50k, 73.5% for AGIs $50k-75k, 69.0% for AGIs $75k-100k, 61.1% for AGIs $100k-200k)
Taxable interest for individuals: $800 (reported on 34.1% of returns)
This zip code:
$800
New York:
$3,125
(% of AGI for various income ranges: 0.7% for AGIs below $25k, 0.5% for AGIs $25k-50k, 0.4% for AGIs $50k-75k, 0.9% for AGIs $75k-100k, 0.8% for AGIs $100k-200k)
Ordinary dividends: $1,200 (reported on 15.4% of returns)
Here:
$1,200
State:
$10,299
(% of AGI for various income ranges: 0.8% for AGIs below $25k, 0.6% for AGIs $25k-50k, 0.6% for AGIs $50k-75k, 0.3% for AGIs $100k-200k)
Net capital gain/loss in AGI: +$1,383 (reported on 6.6% of returns)
Here:
+$1,383
State:
+$42,474
Profit/loss from business: +$7,482 (reported on 12.1% of returns)
Here:
+$7,482
State:
+$16,168
(% of AGI for various income ranges: 2.9% for AGIs below $25k, 3.2% for AGIs $25k-50k, 4.1% for AGIs $50k-75k)
Taxable individual retirement arrangement distribution: $9,480 (reported on 11.0% of returns)
13146:
$9,480
New York:
$17,621
(% of AGI for various income ranges: 3.9% for AGIs below $25k, 2.1% for AGIs $25k-50k, 6.1% for AGIs $50k-75k)
Total itemized deductions: $16,827 (21% of AGI, reported on 16.5% of returns)
Here:
$16,827
State:
$34,985
Here:
20.8% of AGI
State:
21.3% of AGI
(% of AGI for various income ranges: 5.3% for AGIs below $25k, 3.5% for AGIs $25k-50k, 8.6% for AGIs $50k-75k, 12.4% for AGIs $100k-200k)
Charity contributions: $2,850 (reported on 11.0% of returns)
Here:
$2,850
State:
$5,572
(% of AGI for various income ranges: 0.6% for AGIs below $25k, 1.2% for AGIs $50k-75k, 1.6% for AGIs $100k-200k)
Taxes paid: $7,320 (reported on 16.5% of returns)
13146:
$7,320
State:
$18,656
(% of AGI for various income ranges: 1.6% for AGIs below $25k, 1.2% for AGIs $25k-50k, 3.5% for AGIs $50k-75k, 6.2% for AGIs $100k-200k)
Earned income credit: $1,940 (reported on 22.0% of returns)
Here:
$1,940
State:
$2,230
(% of AGI for various income ranges: 6.4% for AGIs below $25k, 1.3% for AGIs $25k-50k)
Percentage of individuals using paid preparers for their 2012 taxes: 57.1%
Here:
57%
State:
66%
(% for various income ranges: 47.2% for AGIs below $25k, 57.7% for AGIs $25k-50k, 62.5% for AGIs $50k-75k, 71.4% for AGIs $75k-100k, 83.3% for AGIs $100k-200k)
Averages for the 2004 tax year for zip code 13146, filed in 2005:
Average Adjusted Gross Income (AGI) in 2004: $33,644 (Individual Income Tax Returns)
Here:
$33,644
State:
$59,519
Salary/wage: $31,891 (reported on 86.2% of returns)
Here:
$31,891
State:
$50,673
(% of AGI for various income ranges: 97.5% for AGIs below $10k, 71.4% for AGIs $10k-25k, 88.3% for AGIs $25k-50k, 83.5% for AGIs $50k-75k, 70.3% for AGIs $75k-100k, 77.7% for AGIs over 100k)
Taxable interest for individuals: $893 (reported on 43.6% of returns)
This zip code:
$893
New York:
$2,377
(% of AGI for various income ranges: 3.0% for AGIs below $10k, 1.3% for AGIs $10k-25k, 0.7% for AGIs $25k-50k, 0.7% for AGIs $50k-75k, 1.0% for AGIs $75k-100k, 3.7% for AGIs over 100k)
Taxable dividends: $903 (reported on 19.8% of returns)
Here:
$903
State:
$5,394
(% of AGI for various income ranges: 1.4% for AGIs below $10k, 0.9% for AGIs $10k-25k, 0.4% for AGIs $25k-50k, 0.4% for AGIs $50k-75k, 0.5% for AGIs $75k-100k, 0.4% for AGIs over 100k)
Net capital gain/loss: +$1,457 (reported on 9.8% of returns)
Here:
+$1,457
State:
+$23,581
(% of AGI for various income ranges: -0.3% for AGIs below $10k, -0.5% for AGIs $10k-25k, 0.6% for AGIs $25k-50k, 1.0% for AGIs $50k-75k, 0.1% for AGIs $75k-100k)
Profit/loss from business: +$4,697 (reported on 13.0% of returns)
Here:
+$4,697
State:
+$13,809
(% of AGI for various income ranges: 2.2% for AGIs below $10k, 5.7% for AGIs $10k-25k, 3.2% for AGIs $25k-50k, -0.2% for AGIs $50k-75k)
IRA payment deduction: $2,400 (reported on 2.1% of returns)
13146:
$2,400
New York:
$3,115
Total itemized deductions: $13,427 (20% of AGI, reported on 17.4% of returns)
Here:
$13,427
State:
$25,864
Here:
20.3% of AGI
State:
21.9% of AGI
(% of AGI for various income ranges: 3.6% for AGIs $10k-25k, 4.6% for AGIs $25k-50k, 8.6% for AGIs $50k-75k, 8.3% for AGIs $75k-100k, 14.4% for AGIs over 100k)
Charity contributions deductions: $2,140 (3% of AGI, reported on 14.5% of returns)
Here:
$2,140
State:
$4,439
Here:
3.1% of AGI
State:
3.6% of AGI
(% of AGI for various income ranges: 0.5% for AGIs $25k-50k, 1.3% for AGIs $50k-75k, 1.9% for AGIs $75k-100k, 1.5% for AGIs over 100k)
Total tax: $3,718 (reported on 71.5% of returns)
13146:
$3,718
State:
$11,730
(% of AGI for various income ranges: 2.9% for AGIs below $10k, 3.8% for AGIs $10k-25k, 6.4% for AGIs $25k-50k, 8.2% for AGIs $50k-75k, 10.6% for AGIs $75k-100k, 16.0% for AGIs over 100k)
Earned income credit: $1,732 (reported on 19.4% of returns)
Here:
$1,732
State:
$1,757
Percentage of individuals using paid preparers for their 2004 taxes: 65.1%
Here:
65%
State:
67%
(% for various income ranges: 58.2% for AGIs below $10k, 67.6% for AGIs $10k-25k, 65.0% for AGIs $25k-50k, 66.7% for AGIs $50k-75k, 75.6% for AGIs $75k-100k, 68.2% for AGIs over 100k)
Likely homosexual households (counted as self-reported same-sex unmarried-partner households)
Lesbian couples: 0.0% of all households
Gay men: 1.0% of all households
Household received Food Stamps/SNAP in the past 12 months: 101 Household did not receive Food Stamps/SNAP in the past 12 months: 664
Women who had a birth in the past 12 months: 44 (41 now married, 3 unmarried) Women who did not have a birth in the past 12 months: 444 (177 now married, 266 unmarried)
Housing units in zip code 13146 with a mortgage: 304 (33 second mortgage, 34 both second mortgage and home equity loan) Houses without a mortgage: 35
Median monthly owner costs for units with a mortgage: $1,189 Median monthly owner costs for units without a mortgage: $508
Residents with income below the poverty level in 2022:
This zip code:
11.3%
Whole state:
14.3%
Residents with income below 50% of the poverty level in 2022:
This zip code:
5.2%
Whole state:
6.8%
Median number of rooms in houses and condos:
Here:
6.8
State:
6.3
Median number of rooms in apartments:
Here:
6.5
State:
3.8
Notable locations in this zip code not listed on our city pages
Churches in zip code 13146 include: Butler United Methodist Church (A), Christian Center (B), Congregational Church of Savannah (C), Saint Patrick's Church (D), Savannah Community Church (E), Savannah Family of God Church (F). Display/hide their locations on the map
Cemeteries: Butler-Savannah Cemetery (1), Ferris Cemetery (2), Wiley Cemetery (3), Harvey Cemetery (4), Wilsey Farm Cemetery (5), Herrington Cemetery (6), Crusoe Cemetery (7). Display/hide their locations on the map
In group quarters: 26 (-1 institutionalized population)
Size of family households: 222 2-persons, 69 3-persons, 94 4-persons, 32 5-persons, 21 6-persons, 72 7-or-more-persons
Size of nonfamily households: 230 1-person, 20 2-persons, 4 4-persons
378 married couples with children.
69 single-parent households (12 men, 57 women).
89.2% of residents of 13146 zip code speak English at home.
1.9% of residents speak Spanish at home (54% very well, 46% well).
8.3% of residents speak other Indo-European language at home (85% very well, 15% well).
Foreign born population: 24 (1.1%) (25.0% of them are naturalized citizens)
This zip code:
1.1%
Whole state:
22.7%
88%El Salvador
12%Netherlands
8%North Macedonia (Macedonia)
29%German
18%American
10%English
10%Swiss
5%Italian
4%Irish
2%Trinidadian and Tobagonian
Year of entry for the foreign-born population
212010 or later
02000 to 2009
01990 to 1999
5Before 1990
Facilities with environmental interests located in this zip code:
J & R DAIRY LLC (12530 FERRIS ROAD in SAVANNAH, NY)
STATE MASTER (New York facility tracking) - National Pollutant Discharge Elimination System Permit National Pollutant Discharge Elimination System NON-MAJOR (Tracking pollutant discharge elimination systems) - permit Business SIC classification: GENERAL FARMS, PRIMARILY LIVESTOCK AND ANIMAL SPECIALTIES Organizations: REED FARMS INC. (CONTACT/OWNER)
, REED FARMS INC (LEGALLY RESPONSIBLE PARTY)
Alternative names: REED FARMS INC.
HARPER FARMS (3392 WHISKEY HILL ROAD in SAVANNAH, NY)
STATE MASTER (New York facility tracking) - National Pollutant Discharge Elimination System Permit National Pollutant Discharge Elimination System NON-MAJOR (Tracking pollutant discharge elimination systems) - permit Business SIC classification: GENERAL FARMS, PRIMARILY LIVESTOCK AND ANIMAL SPECIALTIES Organizations: SCOTT FLOWERS & JOHN/MIKE/DAVE (CONTACT/OWNER)
Alternative names: SCOTT FLOWERS & JOHN/MIKE/DAVE
Housing units lacking complete kitchen facilities: 1.7%
41.6%Fuel oil, kerosene, etc.
27.9%Bottled, tank, or LP gas
12.2%Electricity
11.1%Wood
3.1%Coal or coke
2.7%Other fuel
1.2%No fuel used
0.8%Utility gas
Population in 1990: 2,141. Population change in the 1990s: +400 (+18.7%).
Place of birth for U.S.-born residents:
This state: 1,846
Northeast: 112
Midwest: 12
South: 108
West: 28
66% of the 13146 zip code residents lived in the same house 5 years ago. Out of people who lived in different houses, 72% lived in this county. Out of people who lived in different counties, 50% lived in New York.
91% of the 13146 zip code residents lived in the same house 1 year ago. Out of people who lived in different houses, 73% moved from this county. Out of people who lived in different houses, 17% moved from different county within same state. Out of people who lived in different houses, 7% moved from different state.
Private vs. public school enrollment:
Students in private schools in grades 1 to 8 (elementary and middle school): 67
Here:
32.7%
New York:
15.6%
Students in private schools in grades 9 to 12 (high school):
Here:
0.0%
New York:
15.0%
Students in private undergraduate colleges: 10
Here:
28.4%
New York:
39.2%
Occupation by median earnings in the past 12 months ($)
88,913Transportation occupations
62,155Management occupations
57,157Farming, fishing, and forestry occupations
55,885Business and financial operations occupations
50,363Office and administrative support occupations
39,178Health technologists and technicians
Companies with federal contracts located in this zip code:
A-VERDI LLC (14150 RT 31 in SAVANNAH, NY; small business)
$117,120 with Army for Prefabricated and Portable Buildings. Signed on 2004-04-30. Completion date: 2004-05-25.
Top industries in this zip code by the number of employees in 2005:
Finance and Insurance: Commercial Banking (20-49 employees: 1 establishment)
Wholesale Trade: Farm and Garden Machinery and Equipment Merchant Wholesalers (20-49: 1)
Construction: Commercial and Institutional Building Construction (5-9: 1)
Construction: Power and Communication Line and Related Structures Construction (5-9: 1)
Administrative and Support and Waste Management and Remediation Services: Septic Tank and Related Services (5-9: 1)
Other Services (except Public Administration): Reupholstery and Furniture Repair (1-4: 1)
Wholesale Trade: Other Electronic Parts and Equipment Merchant Wholesalers (1-4: 1)
People in group quarters in 2010:
10 people in group homes intended for adults
People in group quarters in 2000:
8 people in homes for the mentally retarded
Fatal accident statistics in 2010:
Fatal accident count: 1
Vehicles involved in fatal accidents: 1
Fatal accidents caused by drunken drivers: 1
Fatalities: 1
Persons involved in fatal accidents: 1
Pedestrians involved in fatal accidents: 0
Home Mortgage Disclosure Act Aggregated Statistics For Year 2009 (Based on 4 partial tracts)
A) FHA, FSA/RHS & VA Home Purchase Loans
B) Conventional Home Purchase Loans
C) Refinancings
D) Home Improvement Loans
F) Non-occupant Loans on < 5 Family Dwellings (A B C & D)
G) Loans On Manufactured Home Dwelling (A B C & D)
Number
Average Value
Number
Average Value
Number
Average Value
Number
Average Value
Number
Average Value
Number
Average Value
LOANS ORIGINATED
14
$81,801
10
$80,596
32
$77,887
19
$18,332
1
$29,950
4
$86,720
APPLICATIONS APPROVED, NOT ACCEPTED
1
$92,250
0
$0
3
$81,340
1
$146,120
0
$0
0
$0
APPLICATIONS DENIED
2
$86,440
4
$82,878
16
$79,766
18
$14,911
0
$0
4
$74,015
APPLICATIONS WITHDRAWN
2
$126,845
1
$161,620
8
$84,302
0
$0
0
$0
2
$108,485
FILES CLOSED FOR INCOMPLETENESS
1
$87,820
0
$0
0
$0
0
$0
0
$0
0
$0
Aggregated Statistics For Year 2008 (Based on 4 partial tracts)
A) FHA, FSA/RHS & VA Home Purchase Loans
B) Conventional Home Purchase Loans
C) Refinancings
D) Home Improvement Loans
F) Non-occupant Loans on < 5 Family Dwellings (A B C & D)
G) Loans On Manufactured Home Dwelling (A B C & D)
Number
Average Value
Number
Average Value
Number
Average Value
Number
Average Value
Number
Average Value
Number
Average Value
LOANS ORIGINATED
14
$71,819
20
$75,332
21
$69,346
36
$17,394
2
$153,505
6
$53,162
APPLICATIONS APPROVED, NOT ACCEPTED
0
$0
1
$45,760
9
$80,811
2
$11,865
0
$0
2
$54,980
APPLICATIONS DENIED
3
$69,780
9
$61,019
32
$94,262
28
$24,680
1
$35,020
12
$49,557
APPLICATIONS WITHDRAWN
1
$74,670
1
$226,440
19
$106,321
3
$20,393
0
$0
0
$0
FILES CLOSED FOR INCOMPLETENESS
0
$0
0
$0
3
$87,417
0
$0
0
$0
0
$0
Aggregated Statistics For Year 2007 (Based on 4 partial tracts)
A) FHA, FSA/RHS & VA Home Purchase Loans
B) Conventional Home Purchase Loans
C) Refinancings
D) Home Improvement Loans
F) Non-occupant Loans on < 5 Family Dwellings (A B C & D)
G) Loans On Manufactured Home Dwelling (A B C & D)
Number
Average Value
Number
Average Value
Number
Average Value
Number
Average Value
Number
Average Value
Number
Average Value
LOANS ORIGINATED
6
$86,323
21
$73,760
40
$64,537
34
$21,971
6
$54,737
6
$52,757
APPLICATIONS APPROVED, NOT ACCEPTED
1
$39,110
1
$80,580
8
$72,650
2
$35,640
0
$0
0
$0
APPLICATIONS DENIED
4
$70,848
15
$56,207
60
$73,966
45
$24,574
4
$54,888
20
$52,710
APPLICATIONS WITHDRAWN
1
$46,490
4
$88,338
34
$80,268
4
$25,865
1
$11,070
1
$28,270
FILES CLOSED FOR INCOMPLETENESS
0
$0
0
$0
3
$65,667
0
$0
0
$0
0
$0
Aggregated Statistics For Year 2006 (Based on 4 partial tracts)
A) FHA, FSA/RHS & VA Home Purchase Loans
B) Conventional Home Purchase Loans
C) Refinancings
D) Home Improvement Loans
F) Non-occupant Loans on < 5 Family Dwellings (A B C & D)
G) Loans On Manufactured Home Dwelling (A B C & D)
Number
Average Value
Number
Average Value
Number
Average Value
Number
Average Value
Number
Average Value
Number
Average Value
LOANS ORIGINATED
6
$77,710
27
$69,794
40
$67,122
38
$24,591
6
$60,158
7
$41,310
APPLICATIONS APPROVED, NOT ACCEPTED
0
$0
4
$69,245
12
$73,033
3
$38,773
0
$0
2
$63,435
APPLICATIONS DENIED
3
$71,040
9
$65,820
81
$75,543
43
$31,669
2
$41,500
15
$54,470
APPLICATIONS WITHDRAWN
1
$70,900
5
$76,108
34
$78,830
5
$37,784
0
$0
3
$88,560
FILES CLOSED FOR INCOMPLETENESS
0
$0
3
$72,973
9
$121,626
0
$0
0
$0
0
$0
Aggregated Statistics For Year 2005 (Based on 4 partial tracts)
A) FHA, FSA/RHS & VA Home Purchase Loans
B) Conventional Home Purchase Loans
C) Refinancings
D) Home Improvement Loans
F) Non-occupant Loans on < 5 Family Dwellings (A B C & D)
G) Loans On Manufactured Home Dwelling (A B C & D)
Number
Average Value
Number
Average Value
Number
Average Value
Number
Average Value
Number
Average Value
Number
Average Value
LOANS ORIGINATED
7
$76,471
28
$72,929
41
$61,242
46
$22,323
7
$35,443
12
$44,198
APPLICATIONS APPROVED, NOT ACCEPTED
1
$101,010
5
$63,500
19
$79,388
1
$17,400
0
$0
2
$84,350
APPLICATIONS DENIED
3
$58,323
17
$66,698
98
$74,965
35
$31,766
4
$39,360
13
$47,437
APPLICATIONS WITHDRAWN
1
$28,780
9
$71,437
41
$75,933
4
$68,245
0
$0
6
$48,718
FILES CLOSED FOR INCOMPLETENESS
0
$0
2
$96,985
9
$95,100
0
$0
0
$0
0
$0
Aggregated Statistics For Year 2004 (Based on 4 partial tracts)
A) FHA, FSA/RHS & VA Home Purchase Loans
B) Conventional Home Purchase Loans
C) Refinancings
D) Home Improvement Loans
F) Non-occupant Loans on < 5 Family Dwellings (A B C & D)
G) Loans On Manufactured Home Dwelling (A B C & D)
Number
Average Value
Number
Average Value
Number
Average Value
Number
Average Value
Number
Average Value
Number
Average Value
LOANS ORIGINATED
7
$71,366
26
$74,607
47
$68,060
38
$14,804
2
$56,525
8
$56,062
APPLICATIONS APPROVED, NOT ACCEPTED
0
$0
3
$69,037
12
$78,424
2
$22,570
0
$0
1
$80,360
APPLICATIONS DENIED
3
$58,237
18
$50,806
80
$67,010
33
$26,544
2
$59,315
22
$38,572
APPLICATIONS WITHDRAWN
0
$0
7
$60,499
61
$69,300
8
$43,822
0
$0
8
$64,262
FILES CLOSED FOR INCOMPLETENESS
0
$0
2
$27,790
8
$76,065
2
$23,620
0
$0
0
$0
Aggregated Statistics For Year 2003 (Based on 4 partial tracts)
A) FHA, FSA/RHS & VA Home Purchase Loans
B) Conventional Home Purchase Loans
C) Refinancings
D) Home Improvement Loans
F) Non-occupant Loans on < 5 Family Dwellings (A B C & D)
Number
Average Value
Number
Average Value
Number
Average Value
Number
Average Value
Number
Average Value
LOANS ORIGINATED
8
$73,870
16
$59,162
80
$60,737
29
$13,851
4
$39,795
APPLICATIONS APPROVED, NOT ACCEPTED
1
$40,590
7
$72,919
13
$60,015
3
$13,917
1
$39,110
APPLICATIONS DENIED
1
$38,600
11
$59,652
65
$65,782
28
$11,710
0
$0
APPLICATIONS WITHDRAWN
0
$0
2
$51,055
53
$70,203
4
$23,832
0
$0
FILES CLOSED FOR INCOMPLETENESS
0
$0
0
$0
5
$72,036
0
$0
0
$0
Aggregated Statistics For Year 2002 (Based on 4 partial tracts)
A) FHA, FSA/RHS & VA Home Purchase Loans
B) Conventional Home Purchase Loans
C) Refinancings
D) Home Improvement Loans
F) Non-occupant Loans on < 5 Family Dwellings (A B C & D)
Number
Average Value
Number
Average Value
Number
Average Value
Number
Average Value
Number
Average Value
LOANS ORIGINATED
11
$62,173
20
$60,317
61
$62,186
30
$9,525
1
$56,090
APPLICATIONS APPROVED, NOT ACCEPTED
1
$104,800
5
$57,300
18
$59,306
6
$20,542
0
$0
APPLICATIONS DENIED
3
$46,817
10
$43,063
57
$58,259
19
$14,287
4
$29,892
APPLICATIONS WITHDRAWN
2
$40,660
6
$47,993
39
$70,567
3
$23,733
3
$47,233
FILES CLOSED FOR INCOMPLETENESS
1
$26,570
0
$0
2
$81,165
0
$0
0
$0
Aggregated Statistics For Year 2001 (Based on 4 partial tracts)
A) FHA, FSA/RHS & VA Home Purchase Loans
B) Conventional Home Purchase Loans
C) Refinancings
D) Home Improvement Loans
F) Non-occupant Loans on < 5 Family Dwellings (A B C & D)
Number
Average Value
Number
Average Value
Number
Average Value
Number
Average Value
Number
Average Value
LOANS ORIGINATED
7
$65,694
21
$55,331
49
$55,532
35
$8,192
3
$28,823
APPLICATIONS APPROVED, NOT ACCEPTED
0
$0
13
$67,411
12
$74,822
6
$7,875
1
$14,760
APPLICATIONS DENIED
3
$55,647
21
$50,489
67
$53,874
22
$11,528
5
$39,242
APPLICATIONS WITHDRAWN
2
$47,190
1
$104,230
45
$66,634
5
$23,052
0
$0
FILES CLOSED FOR INCOMPLETENESS
0
$0
0
$0
7
$47,379
0
$0
0
$0
Aggregated Statistics For Year 2000 (Based on 4 partial tracts)
A) FHA, FSA/RHS & VA Home Purchase Loans
B) Conventional Home Purchase Loans
C) Refinancings
D) Home Improvement Loans
F) Non-occupant Loans on < 5 Family Dwellings (A B C & D)
Number
Average Value
Number
Average Value
Number
Average Value
Number
Average Value
Number
Average Value
LOANS ORIGINATED
9
$65,971
28
$62,907
38
$45,902
57
$10,456
4
$57,998
APPLICATIONS APPROVED, NOT ACCEPTED
0
$0
14
$68,618
9
$51,344
17
$18,068
2
$47,820
APPLICATIONS DENIED
0
$0
21
$56,170
65
$51,348
26
$15,566
2
$81,935
APPLICATIONS WITHDRAWN
0
$0
4
$42,575
28
$73,799
3
$8,997
2
$67,955
FILES CLOSED FOR INCOMPLETENESS
0
$0
0
$0
6
$63,135
0
$0
0
$0
Aggregated Statistics For Year 1999 (Based on 2 partial tracts)
A) FHA, FSA/RHS & VA Home Purchase Loans
B) Conventional Home Purchase Loans
C) Refinancings
D) Home Improvement Loans
F) Non-occupant Loans on < 5 Family Dwellings (A B C & D)
Detailed PMIC statistics for the following Tracts:0216.00
, 0217.00
2002 - 2018 National Fire Incident Reporting System (NFIRS) incidents
Based on the data from the years 2002 - 2018 the average number of fires per year is 9. The highest number of reported fires - 24 took place in 2013, and the least - 0 in 2005. The data has a declining trend.
When looking into fire subcategories, the most reports belonged to: Structure Fires (53.7%), and Outside Fires (29.3%).
Fire incident types reported to NFIRS in Zip Code 13146


 Nearest zip codes: 13117, 13140, 14542, 14433, 13034, 13143.


 Based on the data from the years 2002 - 2018 the average number of fires per year is 9. The highest number of reported fires - 24 took place in 2013, and the least - 0 in 2005. The data has a declining trend.
 When looking into fire subcategories, the most reports belonged to: Structure Fires (53.7%), and Outside Fires (29.3%).