Estimated zip code population in 2022: 1,888 Zip code population in 2010: 1,684 Zip code population in 2000: 1,655
Houses and condos: 881 Renter-occupied apartments: 173
% of renters here:
23%
State:
46%
March 2022 cost of living index in zip code 13304: 96.0 (near average, U.S. average is 100)
Land area: 17.4 sq. mi. Water area: 0.2 sq. mi.
Population density: 109 people per square mile
(very low).
OSM Map
General Map
Google Map
MSN Map
OSM Map
General Map
Google Map
MSN Map
OSM Map
General Map
Google Map
MSN Map
OSM Map
General Map
Google Map
MSN Map
Please wait while loading the map...
Real estate property taxes paid for housing units in 2022:
This zip code:
1.9% ($4,704)
New York:
1.5% ($6,180)
Median real estate property taxes paid for housing units with mortgages in 2022: $5,598 (1.8%) Median real estate property taxes paid for housing units with no mortgage in 2022: $3,170 (2.0%)
Business Search- 14 Million verified businesses
Males: 918
(48.6%)
Females: 970
(51.4%)
For population 25 years and over in 13304:
High school or higher: 96.5%
Bachelor's degree or higher: 41.5%
Graduate or professional degree: 7.9%
Unemployed: 0.6%
Mean travel time to work (commute): 25.3 minutes
For population 15 years and over in 13304:
Never married: 29.9%
Now married: 59.6%
Separated: 0.6%
Widowed: 5.2%
Divorced: 4.7%
Zip code 13304 compared to state average:
Median house value below state average.
Unemployed percentage significantly below state average.
Black race population percentage significantly below state average.
Hispanic race population percentage significantly below state average.
Foreign-born population percentage significantly below state average.
Estimated median house/condo value in 2022: $254,250
13304:
$254,250
New York:
$400,400
According to our research of New York and other state lists, there were 2 registered sex offenders living in 13304 zip code as of May 28, 2024. The ratio of all residents to sex offenders in zip code 13304 is 852 to 1. The ratio of registered sex offenders to all residents in this zip code is near the state average.
Median resident age:
This zip code:
40.1 years
New York median age:
40.0 years
Average household size:
This zip code:
2.4 people
New York:
2.5 people
Averages for the 2020 tax year for zip code 13304, filed in 2021:
Average Adjusted Gross Income (AGI) in 2020: $82,233 (Individual Income Tax Returns)
Here:
$82,233
State:
$90,930
Salary/wage: $61,622 (reported on 75.8% of returns)
Here:
$61,622
State:
$72,104
(% of AGI for various income ranges: 1126.7% for AGIs below $25k, 3677.7% for AGIs $25k-50k, 6198.0% for AGIs $50k-75k, 8493.3% for AGIs $75k-100k, 14728.2% for AGIs $100k-200k)
Taxable interest for individuals: $1,082 (reported on 51.6% of returns)
This zip code:
$1,082
New York:
$3,075
(% of AGI for various income ranges: 24.0% for AGIs below $25k, 28.5% for AGIs $25k-50k, 38.0% for AGIs $50k-75k, 53.3% for AGIs $75k-100k, 166.4% for AGIs $100k-200k)
Ordinary dividends: $9,639 (reported on 29.5% of returns)
Here:
$9,639
State:
$11,095
(% of AGI for various income ranges: 50.0% for AGIs below $25k, 64.6% for AGIs $25k-50k, 162.0% for AGIs $50k-75k, 320.0% for AGIs $75k-100k, 658.2% for AGIs $100k-200k)
Net capital gain/loss in AGI: +$15,896 (reported on 27.4% of returns)
Here:
+$15,896
State:
+$44,925
(% of AGI for various income ranges: 34.7% for AGIs below $25k, 82.3% for AGIs $25k-50k, 185.0% for AGIs $50k-75k, 340.0% for AGIs $75k-100k, 778.2% for AGIs $100k-200k)
Profit/loss from business: +$12,227 (reported on 15.8% of returns)
Here:
+$12,227
State:
+$14,940
(% of AGI for various income ranges: 67.3% for AGIs below $25k, 223.1% for AGIs $25k-50k, 603.3% for AGIs $75k-100k, 982.7% for AGIs $100k-200k)
Taxable individual retirement arrangement distribution: $22,254 (reported on 13.7% of returns)
13304:
$22,254
New York:
$19,609
(% of AGI for various income ranges: 156.0% for AGIs below $25k, 894.0% for AGIs $50k-75k, 1604.5% for AGIs $100k-200k)
Total itemized deductions: $31,600 (reported on 7.4% of returns)
Here:
$31,600
State:
$39,326
(% of AGI for various income ranges: 616.0% for AGIs $50k-75k, 1450.9% for AGIs $100k-200k)
Charity contributions: $10,375 (reported on 4.2% of returns)
Here:
$10,375
State:
$15,420
(% of AGI for various income ranges: 377.3% for AGIs $100k-200k)
Taxes paid: $9,383 (reported on 6.3% of returns)
13304:
$9,383
State:
$9,183
(% of AGI for various income ranges: 174.0% for AGIs $50k-75k, 353.6% for AGIs $100k-200k)
Earned income credit: $2,250 (reported on 8.4% of returns)
Here:
$2,250
State:
$2,138
(% of AGI for various income ranges: 71.3% for AGIs below $25k, 56.2% for AGIs $25k-50k)
Percentage of individuals using paid preparers for their 2020 taxes: 93.7%
Here:
94%
State:
95%
(% for various income ranges: 92.0% for AGIs below $25k, 94.7% for AGIs $25k-50k, 93.3% for AGIs $50k-75k, 100.0% for AGIs $75k-100k, 94.7% for AGIs $100k-200k, 85.7% for AGIs over 200k)
Averages for the 2012 tax year for zip code 13304, filed in 2013:
Average Adjusted Gross Income (AGI) in 2012: $63,067 (Individual Income Tax Returns)
Here:
$63,067
State:
$77,088
Salary/wage: $53,871 (reported on 81.5% of returns)
Here:
$53,871
State:
$60,593
(% of AGI for various income ranges: 70.8% for AGIs below $25k, 78.8% for AGIs $25k-50k, 67.4% for AGIs $50k-75k, 68.5% for AGIs $75k-100k, 76.0% for AGIs $100k-200k, 53.1% for AGIs over 200k)
Taxable interest for individuals: $656 (reported on 48.9% of returns)
This zip code:
$656
New York:
$3,125
(% of AGI for various income ranges: 1.0% for AGIs below $25k, 0.3% for AGIs $25k-50k, 0.3% for AGIs $50k-75k, 0.5% for AGIs $75k-100k, 0.7% for AGIs $100k-200k, 0.3% for AGIs over 200k)
Ordinary dividends: $4,179 (reported on 30.4% of returns)
Here:
$4,179
State:
$10,299
(% of AGI for various income ranges: 3.0% for AGIs below $25k, 1.6% for AGIs $25k-50k, 1.3% for AGIs $50k-75k, 0.9% for AGIs $75k-100k, 2.0% for AGIs $100k-200k, 3.6% for AGIs over 200k)
Net capital gain/loss in AGI: +$2,785 (reported on 21.7% of returns)
Here:
+$2,785
State:
+$42,474
(% of AGI for various income ranges: 1.5% for AGIs below $25k, 0.5% for AGIs $25k-50k, 0.2% for AGIs $50k-75k, 1.3% for AGIs $75k-100k, 0.2% for AGIs $100k-200k, 2.8% for AGIs over 200k)
Profit/loss from business: +$15,179 (reported on 15.2% of returns)
Here:
+$15,179
State:
+$16,168
(% of AGI for various income ranges: 4.2% for AGIs below $25k, 4.3% for AGIs $25k-50k, 0.9% for AGIs $50k-75k, 3.5% for AGIs $75k-100k, 6.4% for AGIs $100k-200k)
Taxable individual retirement arrangement distribution: $13,367 (reported on 13.0% of returns)
13304:
$13,367
New York:
$17,621
(% of AGI for various income ranges: 6.0% for AGIs below $25k, 7.6% for AGIs $50k-75k, 4.0% for AGIs $100k-200k)
Total itemized deductions: $20,862 (19% of AGI, reported on 37.0% of returns)
Here:
$20,862
State:
$34,985
Here:
18.6% of AGI
State:
21.3% of AGI
(% of AGI for various income ranges: 11.9% for AGIs $25k-50k, 10.1% for AGIs $50k-75k, 12.1% for AGIs $75k-100k, 14.6% for AGIs $100k-200k, 14.0% for AGIs over 200k)
Charity contributions: $2,169 (reported on 31.5% of returns)
Here:
$2,169
State:
$5,572
(% of AGI for various income ranges: 0.7% for AGIs $25k-50k, 0.7% for AGIs $50k-75k, 0.9% for AGIs $75k-100k, 1.6% for AGIs $100k-200k, 1.3% for AGIs over 200k)
Taxes paid: $11,129 (reported on 37.0% of returns)
13304:
$11,129
State:
$18,656
(% of AGI for various income ranges: 4.3% for AGIs $25k-50k, 4.7% for AGIs $50k-75k, 6.0% for AGIs $75k-100k, 8.4% for AGIs $100k-200k, 8.7% for AGIs over 200k)
Earned income credit: $1,967 (reported on 9.8% of returns)
Here:
$1,967
State:
$2,230
(% of AGI for various income ranges: 3.6% for AGIs below $25k, 0.7% for AGIs $25k-50k)
Percentage of individuals using paid preparers for their 2012 taxes: 60.9%
Here:
61%
State:
66%
(% for various income ranges: 51.6% for AGIs below $25k, 57.9% for AGIs $25k-50k, 61.5% for AGIs $50k-75k, 72.7% for AGIs $75k-100k, 66.7% for AGIs $100k-200k, 100.0% for AGIs over 200k)
Averages for the 2004 tax year for zip code 13304, filed in 2005:
Average Adjusted Gross Income (AGI) in 2004: $51,968 (Individual Income Tax Returns)
Here:
$51,968
State:
$59,519
Salary/wage: $45,251 (reported on 84.1% of returns)
Here:
$45,251
State:
$50,673
(% of AGI for various income ranges: 104.9% for AGIs below $10k, 68.8% for AGIs $10k-25k, 78.2% for AGIs $25k-50k, 78.9% for AGIs $50k-75k, 81.1% for AGIs $75k-100k, 64.6% for AGIs over 100k)
Taxable interest for individuals: $971 (reported on 64.9% of returns)
This zip code:
$971
New York:
$2,377
(% of AGI for various income ranges: 4.9% for AGIs below $10k, 1.8% for AGIs $10k-25k, 0.9% for AGIs $25k-50k, 0.5% for AGIs $50k-75k, 0.9% for AGIs $75k-100k, 1.5% for AGIs over 100k)
Taxable dividends: $3,138 (reported on 37.8% of returns)
Here:
$3,138
State:
$5,394
(% of AGI for various income ranges: 4.2% for AGIs below $10k, 3.1% for AGIs $10k-25k, 1.0% for AGIs $25k-50k, 1.7% for AGIs $50k-75k, 2.0% for AGIs $75k-100k, 3.0% for AGIs over 100k)
Net capital gain/loss: +$5,851 (reported on 27.7% of returns)
Here:
+$5,851
State:
+$23,581
(% of AGI for various income ranges: -2.2% for AGIs below $10k, 2.6% for AGIs $10k-25k, 1.2% for AGIs $25k-50k, 1.3% for AGIs $50k-75k, 0.4% for AGIs $75k-100k, 6.2% for AGIs over 100k)
Profit/loss from business: +$13,662 (reported on 16.1% of returns)
Here:
+$13,662
State:
+$13,809
(% of AGI for various income ranges: 2.8% for AGIs below $10k, 7.0% for AGIs $10k-25k, 0.3% for AGIs $25k-50k, 4.0% for AGIs $50k-75k, 2.2% for AGIs $75k-100k, 6.4% for AGIs over 100k)
Self-employed pension: $11,538 (reported on 1.4% of returns)
Here:
$11,538
New York:
$19,016
Total itemized deductions: $17,693 (18% of AGI, reported on 34.8% of returns)
Here:
$17,693
State:
$25,864
Here:
18.1% of AGI
State:
21.9% of AGI
(% of AGI for various income ranges: 6.0% for AGIs $10k-25k, 6.8% for AGIs $25k-50k, 13.8% for AGIs $50k-75k, 13.2% for AGIs $75k-100k, 13.8% for AGIs over 100k)
Charity contributions deductions: $2,644 (3% of AGI, reported on 32.8% of returns)
Here:
$2,644
State:
$4,439
Here:
2.6% of AGI
State:
3.6% of AGI
(% of AGI for various income ranges: 0.8% for AGIs $10k-25k, 0.6% for AGIs $25k-50k, 1.7% for AGIs $50k-75k, 2.4% for AGIs $75k-100k, 1.9% for AGIs over 100k)
Total tax: $7,608 (reported on 81.4% of returns)
13304:
$7,608
State:
$11,730
(% of AGI for various income ranges: 2.5% for AGIs below $10k, 4.8% for AGIs $10k-25k, 7.4% for AGIs $25k-50k, 9.0% for AGIs $50k-75k, 9.9% for AGIs $75k-100k, 17.5% for AGIs over 100k)
Earned income credit: $1,500 (reported on 8.4% of returns)
Here:
$1,500
State:
$1,757
Percentage of individuals using paid preparers for their 2004 taxes: 62.3%
Here:
62%
State:
67%
(% for various income ranges: 47.5% for AGIs below $10k, 63.3% for AGIs $10k-25k, 66.0% for AGIs $25k-50k, 64.0% for AGIs $50k-75k, 62.3% for AGIs $75k-100k, 73.9% for AGIs over 100k)
Household received Food Stamps/SNAP in the past 12 months: 81 Household did not receive Food Stamps/SNAP in the past 12 months: 682
Women who had a birth in the past 12 months: 35 (23 now married, 12 unmarried) Women who did not have a birth in the past 12 months: 414 (205 now married, 206 unmarried)
Housing units in zip code 13304 with a mortgage: 270 (69 second mortgage, 70 both second mortgage and home equity loan) Median monthly owner costs for units with a mortgage: $2,021 Median monthly owner costs for units without a mortgage: $610
Residents with income below the poverty level in 2022:
This zip code:
9.7%
Whole state:
14.3%
Residents with income below 50% of the poverty level in 2022:
This zip code:
8.8%
Whole state:
6.8%
Median number of rooms in houses and condos:
Here:
6.8
State:
6.3
Median number of rooms in apartments:
Here:
5.3
State:
3.8
Notable locations in this zip code not listed on our city pages
Notable locations in zip code 13304: Barneveld Station (A), Trenton Falls Station (B), Barneveld Free Library (C), Barneveld Fire Department (D). Display/hide their locations on the map
Streams, rivers, and creeks: Trout Brook (A), Drumlin Brook (B), Crooked Brook (C), Cincinnati Creek (D), Steuben Creek (E), Shepards Brook (F). Display/hide their locations on the map
In group quarters: 34 (-1 institutionalized population)
Size of family households: 192 2-persons, 191 3-persons, 100 4-persons, 17 5-persons, 33 6-persons, 18 7-or-more-persons
Size of nonfamily households: 207 1-person
405 married couples with children.
85 single-parent households (85 men).
98.1% of residents of 13304 zip code speak English at home.
0.4% of residents speak Spanish at home (100% very well).
0.8% of residents speak other Indo-European language at home (100% very well).
0.5% of residents speak Asian or Pacific Island language at home (100% very well).
Foreign born population: 15 (0.8%) (45.0% of them are naturalized citizens)
This zip code:
0.8%
Whole state:
22.7%
100%Japan
24%European
15%American
11%Polish
9%English
7%Irish
6%German
6%Scottish
Year of entry for the foreign-born population
02010 or later
122000 to 2009
21990 to 1999
0Before 1990
Facilities with environmental interests located in this zip code:
DIVERONICA BROTHERS (MAPLEDALE RD RR CROSSING in BARNEVELD, NY)
Large Quantity Generators, more that 1000 kg of hazardous waste/month (Resource Conservation and Recovery Act (tracking hazardous waste))
ECKERD PHARMACY #5977 (8052 STATE RTE 12 in BARNEVELD, NY)
Small Quantity Generators, between 100 kg and 1000 kg of hazardous waste/month (Resource Conservation and Recovery Act (tracking hazardous waste)) Organizations: ECKERD DRUG STORE #5977 (CONTACT/OPERATOR)
, ORION DEVELOPMENT RA LII LLC (CONTACT/OWNER)
ED BLASK FORD INC (RTE 12 BOX 297 in BARNEVELD, NY)
(Resource Conservation and Recovery Act (tracking hazardous waste))
BONFARE 51120 (RTE 12 in BARNEVEID, NY)
(Resource Conservation and Recovery Act (tracking hazardous waste))
68.9%Fuel oil, kerosene, etc.
18.7%Bottled, tank, or LP gas
5.6%Electricity
3.5%Wood
2.1%Utility gas
1.6%Other fuel
Population in 1990: 1,383. Population change in the 1990s: +272 (+19.7%).
Place of birth for U.S.-born residents:
This state: 1,553
Northeast: 48
Midwest: 88
South: 94
West: 87
72% of the 13304 zip code residents lived in the same house 5 years ago. Out of people who lived in different houses, 77% lived in this county. Out of people who lived in different counties, 50% lived in New York.
93% of the 13304 zip code residents lived in the same house 1 year ago. Out of people who lived in different houses, 71% moved from different county within same state. Out of people who lived in different houses, 27% moved from different state. Out of people who lived in different houses, 5% moved from abroad.
Private vs. public school enrollment:
Students in private schools in grades 1 to 8 (elementary and middle school):
Here:
0.0%
New York:
15.6%
Students in private schools in grades 9 to 12 (high school):
Here:
0.0%
New York:
15.0%
Students in private undergraduate colleges:
Here:
0.0%
New York:
39.2%
Occupation by median earnings in the past 12 months ($)
147,586Architecture and engineering occupations
102,228Law enforcement workers including supervisors
88,608Management occupations
78,060Health diagnosing and treating practitioners and other technical occupations
50,540Education, training, and library occupations
49,738Office and administrative support occupations
Top industries in this zip code by the number of employees in 2005:
Health Care and Social Assistance: Offices of Physicians (except Mental Health Specialists) (10-19 employees: 2 establishments)
Accommodation and Food Services: Limited-Service Restaurants (10-19: 1, 5-9: 1)
Health Care and Social Assistance: Offices of Dentists (10-19: 1, 1-4: 1)
Health Care and Social Assistance: All Other Outpatient Care Centers (10-19: 1)
Accommodation and Food Services: Full-Service Restaurants (10-19: 1)
People in group quarters in 2010:
24 people in group homes intended for adults
People in group quarters in 2000:
18 people in homes for the mentally retarded
Home Mortgage Disclosure Act Aggregated Statistics For Year 2009 (Based on 4 partial tracts)
A) FHA, FSA/RHS & VA Home Purchase Loans
B) Conventional Home Purchase Loans
C) Refinancings
D) Home Improvement Loans
F) Non-occupant Loans on < 5 Family Dwellings (A B C & D)
G) Loans On Manufactured Home Dwelling (A B C & D)
Number
Average Value
Number
Average Value
Number
Average Value
Number
Average Value
Number
Average Value
Number
Average Value
LOANS ORIGINATED
6
$127,600
11
$140,195
34
$121,975
13
$26,477
2
$105,710
5
$72,118
APPLICATIONS APPROVED, NOT ACCEPTED
0
$0
1
$66,790
1
$152,760
0
$0
0
$0
0
$0
APPLICATIONS DENIED
2
$127,850
1
$181,480
10
$142,538
5
$42,806
0
$0
2
$96,955
APPLICATIONS WITHDRAWN
0
$0
0
$0
4
$107,722
0
$0
0
$0
0
$0
FILES CLOSED FOR INCOMPLETENESS
0
$0
0
$0
1
$171,460
1
$39,150
0
$0
0
$0
Aggregated Statistics For Year 2008 (Based on 4 partial tracts)
A) FHA, FSA/RHS & VA Home Purchase Loans
B) Conventional Home Purchase Loans
C) Refinancings
D) Home Improvement Loans
F) Non-occupant Loans on < 5 Family Dwellings (A B C & D)
G) Loans On Manufactured Home Dwelling (A B C & D)
Number
Average Value
Number
Average Value
Number
Average Value
Number
Average Value
Number
Average Value
Number
Average Value
LOANS ORIGINATED
4
$114,345
9
$163,026
26
$104,895
12
$38,865
2
$78,260
3
$77,563
APPLICATIONS APPROVED, NOT ACCEPTED
0
$0
3
$104,843
5
$156,556
2
$10,825
0
$0
1
$55,760
APPLICATIONS DENIED
1
$188,440
4
$110,230
17
$125,159
12
$21,652
1
$85,390
3
$89,063
APPLICATIONS WITHDRAWN
0
$0
0
$0
8
$188,109
1
$93,400
0
$0
0
$0
FILES CLOSED FOR INCOMPLETENESS
0
$0
0
$0
1
$124,360
1
$35,050
0
$0
0
$0
Aggregated Statistics For Year 2007 (Based on 4 partial tracts)
A) FHA, FSA/RHS & VA Home Purchase Loans
B) Conventional Home Purchase Loans
C) Refinancings
D) Home Improvement Loans
F) Non-occupant Loans on < 5 Family Dwellings (A B C & D)
G) Loans On Manufactured Home Dwelling (A B C & D)
Number
Average Value
Number
Average Value
Number
Average Value
Number
Average Value
Number
Average Value
Number
Average Value
LOANS ORIGINATED
3
$106,253
20
$112,582
28
$100,402
19
$36,809
0
$0
4
$62,995
APPLICATIONS APPROVED, NOT ACCEPTED
0
$0
3
$89,200
3
$134,117
2
$114,990
1
$49,740
1
$45,140
APPLICATIONS DENIED
0
$0
5
$69,554
23
$106,845
15
$22,749
1
$60,650
3
$60,790
APPLICATIONS WITHDRAWN
0
$0
2
$112,935
9
$103,970
2
$70,625
0
$0
0
$0
FILES CLOSED FOR INCOMPLETENESS
0
$0
0
$0
3
$136,897
0
$0
0
$0
0
$0
Aggregated Statistics For Year 2006 (Based on 4 partial tracts)
A) FHA, FSA/RHS & VA Home Purchase Loans
B) Conventional Home Purchase Loans
C) Refinancings
D) Home Improvement Loans
F) Non-occupant Loans on < 5 Family Dwellings (A B C & D)
G) Loans On Manufactured Home Dwelling (A B C & D)
Number
Average Value
Number
Average Value
Number
Average Value
Number
Average Value
Number
Average Value
Number
Average Value
LOANS ORIGINATED
2
$88,010
21
$129,469
36
$82,631
23
$33,811
3
$38,230
2
$28,505
APPLICATIONS APPROVED, NOT ACCEPTED
0
$0
6
$96,773
7
$124,759
2
$27,405
0
$0
0
$0
APPLICATIONS DENIED
0
$0
3
$103,467
24
$103,658
12
$33,468
1
$97,960
1
$51,440
APPLICATIONS WITHDRAWN
0
$0
3
$117,770
14
$99,763
3
$64,817
0
$0
0
$0
FILES CLOSED FOR INCOMPLETENESS
0
$0
1
$193,000
7
$147,537
0
$0
0
$0
0
$0
Aggregated Statistics For Year 2005 (Based on 4 partial tracts)
A) FHA, FSA/RHS & VA Home Purchase Loans
B) Conventional Home Purchase Loans
C) Refinancings
D) Home Improvement Loans
F) Non-occupant Loans on < 5 Family Dwellings (A B C & D)
G) Loans On Manufactured Home Dwelling (A B C & D)
Number
Average Value
Number
Average Value
Number
Average Value
Number
Average Value
Number
Average Value
Number
Average Value
LOANS ORIGINATED
1
$167,390
28
$117,159
27
$96,737
17
$38,177
3
$49,590
3
$47,033
APPLICATIONS APPROVED, NOT ACCEPTED
0
$0
3
$100,257
4
$69,235
3
$28,487
0
$0
1
$73,240
APPLICATIONS DENIED
1
$48,360
5
$104,310
25
$114,082
11
$25,382
2
$13,590
3
$47,903
APPLICATIONS WITHDRAWN
0
$0
2
$72,020
25
$105,121
2
$96,005
0
$0
1
$108,310
FILES CLOSED FOR INCOMPLETENESS
0
$0
1
$147,450
3
$119,893
0
$0
0
$0
0
$0
Aggregated Statistics For Year 2004 (Based on 4 partial tracts)
A) FHA, FSA/RHS & VA Home Purchase Loans
B) Conventional Home Purchase Loans
C) Refinancings
D) Home Improvement Loans
F) Non-occupant Loans on < 5 Family Dwellings (A B C & D)
G) Loans On Manufactured Home Dwelling (A B C & D)
Number
Average Value
Number
Average Value
Number
Average Value
Number
Average Value
Number
Average Value
Number
Average Value
LOANS ORIGINATED
4
$108,928
28
$107,215
36
$83,989
16
$33,982
1
$76,920
3
$49,093
APPLICATIONS APPROVED, NOT ACCEPTED
0
$0
3
$66,127
5
$112,510
1
$73,350
0
$0
2
$43,295
APPLICATIONS DENIED
0
$0
7
$67,256
19
$79,756
9
$35,446
1
$85,940
4
$32,782
APPLICATIONS WITHDRAWN
0
$0
2
$68,550
23
$86,067
3
$52,037
1
$45,050
1
$70,470
FILES CLOSED FOR INCOMPLETENESS
0
$0
1
$45,140
3
$66,020
0
$0
0
$0
0
$0
Aggregated Statistics For Year 2003 (Based on 4 partial tracts)
A) FHA, FSA/RHS & VA Home Purchase Loans
B) Conventional Home Purchase Loans
C) Refinancings
D) Home Improvement Loans
F) Non-occupant Loans on < 5 Family Dwellings (A B C & D)
Number
Average Value
Number
Average Value
Number
Average Value
Number
Average Value
Number
Average Value
LOANS ORIGINATED
5
$94,178
23
$121,146
87
$89,500
11
$22,876
1
$81,070
APPLICATIONS APPROVED, NOT ACCEPTED
0
$0
3
$110,497
6
$90,055
0
$0
0
$0
APPLICATIONS DENIED
0
$0
2
$73,875
27
$80,684
6
$32,635
0
$0
APPLICATIONS WITHDRAWN
0
$0
1
$167,400
19
$89,432
1
$26,850
0
$0
FILES CLOSED FOR INCOMPLETENESS
0
$0
1
$134,130
3
$99,860
0
$0
0
$0
Aggregated Statistics For Year 2002 (Based on 4 partial tracts)
A) FHA, FSA/RHS & VA Home Purchase Loans
B) Conventional Home Purchase Loans
C) Refinancings
D) Home Improvement Loans
F) Non-occupant Loans on < 5 Family Dwellings (A B C & D)
Number
Average Value
Number
Average Value
Number
Average Value
Number
Average Value
Number
Average Value
LOANS ORIGINATED
5
$63,684
24
$101,590
62
$82,865
14
$21,839
2
$56,225
APPLICATIONS APPROVED, NOT ACCEPTED
0
$0
4
$83,418
8
$86,291
1
$18,050
0
$0
APPLICATIONS DENIED
1
$69,640
11
$56,794
33
$61,638
4
$9,672
1
$63,100
APPLICATIONS WITHDRAWN
0
$0
1
$128,510
21
$75,266
4
$27,588
0
$0
FILES CLOSED FOR INCOMPLETENESS
0
$0
0
$0
3
$66,050
1
$58,960
0
$0
Aggregated Statistics For Year 2001 (Based on 4 partial tracts)
A) FHA, FSA/RHS & VA Home Purchase Loans
B) Conventional Home Purchase Loans
C) Refinancings
D) Home Improvement Loans
F) Non-occupant Loans on < 5 Family Dwellings (A B C & D)
Number
Average Value
Number
Average Value
Number
Average Value
Number
Average Value
Number
Average Value
LOANS ORIGINATED
5
$72,220
18
$80,099
41
$72,929
18
$22,802
1
$73,010
APPLICATIONS APPROVED, NOT ACCEPTED
0
$0
6
$69,443
6
$67,078
2
$37,130
0
$0
APPLICATIONS DENIED
0
$0
2
$55,560
13
$41,936
8
$19,750
1
$59,180
APPLICATIONS WITHDRAWN
0
$0
1
$175,250
14
$65,931
5
$17,506
0
$0
FILES CLOSED FOR INCOMPLETENESS
0
$0
0
$0
2
$65,240
0
$0
1
$40,160
Aggregated Statistics For Year 2000 (Based on 4 partial tracts)
A) FHA, FSA/RHS & VA Home Purchase Loans
B) Conventional Home Purchase Loans
C) Refinancings
D) Home Improvement Loans
F) Non-occupant Loans on < 5 Family Dwellings (A B C & D)
Number
Average Value
Number
Average Value
Number
Average Value
Number
Average Value
Number
Average Value
LOANS ORIGINATED
5
$61,826
24
$77,715
18
$69,034
17
$23,399
1
$50,820
APPLICATIONS APPROVED, NOT ACCEPTED
0
$0
2
$48,825
2
$39,310
4
$18,130
0
$0
APPLICATIONS DENIED
0
$0
10
$48,696
11
$70,061
7
$26,631
1
$45,600
APPLICATIONS WITHDRAWN
0
$0
0
$0
9
$53,919
1
$31,080
0
$0
FILES CLOSED FOR INCOMPLETENESS
0
$0
1
$50,670
2
$67,250
0
$0
0
$0
Aggregated Statistics For Year 1999 (Based on 2 partial tracts)
Detailed PMIC statistics for the following Tracts:0239.02
, 0240.00
2002 - 2018 National Fire Incident Reporting System (NFIRS) incidents
According to the data from the years 2002 - 2018 the average number of fires per year is 10. The highest number of fires - 18 took place in 2006, and the least - 1 in 2002. The data has a rising trend.
When looking into fire subcategories, the most reports belonged to: Structure Fires (66.1%), and Outside Fires (16.9%).
Fire incident types reported to NFIRS in Zip Code 13304

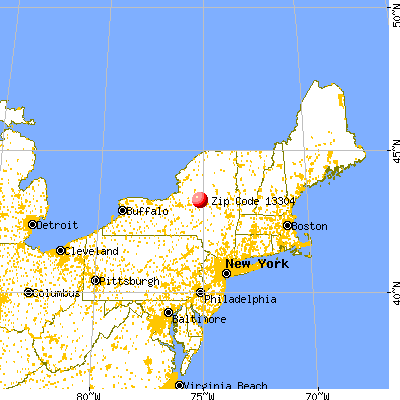


 Nearest zip codes: 13435, 13352, 13431, 13502, 13438, 13354.


 According to the data from the years 2002 - 2018 the average number of fires per year is 10. The highest number of fires - 18 took place in 2006, and the least - 1 in 2002. The data has a rising trend.
 When looking into fire subcategories, the most reports belonged to: Structure Fires (66.1%), and Outside Fires (16.9%).