Estimated zip code population in 2022: 1,055 Zip code population in 2010: 1,076 Zip code population in 2000: 1,104
Houses and condos: 580 Renter-occupied apartments: 53
% of renters here:
13%
State:
46%
March 2022 cost of living index in zip code 13322: 95.1 (less than average, U.S. average is 100)
Land area: 12.1 sq. mi. Water area: 0.1 sq. mi.
Population density: 87 people per square mile
(very low).
OSM Map
General Map
Google Map
MSN Map
OSM Map
General Map
Google Map
MSN Map
OSM Map
General Map
Google Map
MSN Map
OSM Map
General Map
Google Map
MSN Map
Please wait while loading the map...
Real estate property taxes paid for housing units in 2022:
This zip code:
1.8% ($3,825)
New York:
1.5% ($6,180)
Median real estate property taxes paid for housing units with mortgages in 2022: $3,745 (1.8%) Median real estate property taxes paid for housing units with no mortgage in 2022: $3,963 (1.9%)
Averages for the 2020 tax year for zip code 13322, filed in 2021:
Average Adjusted Gross Income (AGI) in 2020: $58,158 (Individual Income Tax Returns)
Here:
$58,158
State:
$90,930
Salary/wage: $52,282 (reported on 81.8% of returns)
Here:
$52,282
State:
$72,104
(% of AGI for various income ranges: 1136.0% for AGIs below $25k, 3660.0% for AGIs $25k-50k, 6214.3% for AGIs $50k-75k, 9005.0% for AGIs $75k-100k, 20094.0% for AGIs $100k-200k)
Taxable interest for individuals: $365 (reported on 41.8% of returns)
This zip code:
$365
New York:
$3,075
(% of AGI for various income ranges: 21.0% for AGIs below $25k, 5.8% for AGIs $25k-50k, 12.9% for AGIs $50k-75k, 20.0% for AGIs $75k-100k, 78.0% for AGIs $100k-200k)
Ordinary dividends: $1,400 (reported on 18.2% of returns)
Here:
$1,400
State:
$11,095
(% of AGI for various income ranges: 36.7% for AGIs $25k-50k, 50.0% for AGIs $50k-75k, 122.0% for AGIs $100k-200k)
Net capital gain/loss in AGI: +$3,100 (reported on 14.5% of returns)
Here:
+$3,100
State:
+$44,925
(% of AGI for various income ranges: 52.5% for AGIs $25k-50k, 370.0% for AGIs $100k-200k)
Profit/loss from business: +$6,657 (reported on 12.7% of returns)
Here:
+$6,657
State:
+$14,940
(% of AGI for various income ranges: 249.2% for AGIs $25k-50k, 417.5% for AGIs $75k-100k)
Taxable individual retirement arrangement distribution: $11,825 (reported on 7.3% of returns)
13322:
$11,825
New York:
$19,609
(% of AGI for various income ranges: 675.7% for AGIs $50k-75k)
Earned income credit: $2,175 (reported on 14.5% of returns)
Here:
$2,175
State:
$2,138
(% of AGI for various income ranges: 99.0% for AGIs below $25k, 62.5% for AGIs $25k-50k)
Percentage of individuals using paid preparers for their 2020 taxes: 94.5%
Here:
95%
State:
95%
(% for various income ranges: 93.8% for AGIs below $25k, 100.0% for AGIs $25k-50k, 88.9% for AGIs $50k-75k, 83.3% for AGIs $75k-100k, 100.0% for AGIs $100k-200k)
Averages for the 2012 tax year for zip code 13322, filed in 2013:
Average Adjusted Gross Income (AGI) in 2012: $47,700 (Individual Income Tax Returns)
Here:
$47,700
State:
$77,088
Salary/wage: $41,762 (reported on 84.2% of returns)
Here:
$41,762
State:
$60,593
(% of AGI for various income ranges: 72.7% for AGIs below $25k, 80.8% for AGIs $25k-50k, 80.4% for AGIs $50k-75k, 76.1% for AGIs $75k-100k, 64.8% for AGIs $100k-200k)
Taxable interest for individuals: $388 (reported on 43.9% of returns)
This zip code:
$388
New York:
$3,125
(% of AGI for various income ranges: 0.4% for AGIs below $25k, 0.6% for AGIs $25k-50k, 0.1% for AGIs $50k-75k, 0.5% for AGIs $75k-100k, 0.3% for AGIs $100k-200k)
Ordinary dividends: $1,500 (reported on 22.8% of returns)
Here:
$1,500
State:
$10,299
(% of AGI for various income ranges: 1.0% for AGIs below $25k, 1.5% for AGIs $25k-50k, 0.4% for AGIs $50k-75k, 1.0% for AGIs $75k-100k, 0.3% for AGIs $100k-200k)
Profit/loss from business: +$6,443 (reported on 12.3% of returns)
Here:
+$6,443
State:
+$16,168
Taxable individual retirement arrangement distribution: $6,725 (reported on 7.0% of returns)
13322:
$6,725
New York:
$17,621
Total itemized deductions: $18,846 (19% of AGI, reported on 22.8% of returns)
Here:
$18,846
State:
$34,985
Here:
18.6% of AGI
State:
21.3% of AGI
(% of AGI for various income ranges: 9.8% for AGIs below $25k, 8.3% for AGIs $50k-75k, 9.6% for AGIs $75k-100k, 13.8% for AGIs $100k-200k)
Charity contributions: $2,364 (reported on 19.3% of returns)
Here:
$2,364
State:
$5,572
Taxes paid: $9,892 (reported on 22.8% of returns)
13322:
$9,892
State:
$18,656
(% of AGI for various income ranges: 3.9% for AGIs below $25k, 3.8% for AGIs $50k-75k, 5.0% for AGIs $75k-100k, 8.0% for AGIs $100k-200k)
Earned income credit: $1,618 (reported on 19.3% of returns)
Here:
$1,618
State:
$2,230
(% of AGI for various income ranges: 4.5% for AGIs below $25k, 1.1% for AGIs $25k-50k)
Percentage of individuals using paid preparers for their 2012 taxes: 54.4%
Here:
54%
State:
66%
(% for various income ranges: 50.0% for AGIs below $25k, 50.0% for AGIs $25k-50k, 60.0% for AGIs $50k-75k, 60.0% for AGIs $75k-100k, 66.7% for AGIs $100k-200k)
Averages for the 2004 tax year for zip code 13322, filed in 2005:
Average Adjusted Gross Income (AGI) in 2004: $35,444 (Individual Income Tax Returns)
Here:
$35,444
State:
$59,519
Salary/wage: $32,742 (reported on 86.8% of returns)
Here:
$32,742
State:
$50,673
(% of AGI for various income ranges: 87.9% for AGIs below $10k, 74.2% for AGIs $10k-25k, 88.6% for AGIs $25k-50k, 84.4% for AGIs $50k-75k, 90.8% for AGIs $75k-100k, 57.9% for AGIs over 100k)
Taxable interest for individuals: $453 (reported on 47.8% of returns)
This zip code:
$453
New York:
$2,377
(% of AGI for various income ranges: 2.3% for AGIs below $10k, 1.5% for AGIs $10k-25k, 0.3% for AGIs $25k-50k, 0.3% for AGIs $50k-75k, 0.2% for AGIs $75k-100k, 1.0% for AGIs over 100k)
Taxable dividends: $1,000 (reported on 24.0% of returns)
Here:
$1,000
State:
$5,394
(% of AGI for various income ranges: 3.8% for AGIs below $10k, 0.6% for AGIs $10k-25k, 0.5% for AGIs $25k-50k, 0.1% for AGIs $50k-75k, 0.3% for AGIs $75k-100k, 1.3% for AGIs over 100k)
Profit/loss from business: +$8,902 (reported on 9.1% of returns)
Here:
+$8,902
State:
+$13,809
Total itemized deductions: $15,798 (21% of AGI, reported on 20.4% of returns)
Here:
$15,798
State:
$25,864
Here:
21.2% of AGI
State:
21.9% of AGI
(% of AGI for various income ranges: 8.1% for AGIs $25k-50k, 8.1% for AGIs $50k-75k, 15.6% for AGIs $75k-100k, 14.3% for AGIs over 100k)
Charity contributions deductions: $2,477 (3% of AGI, reported on 19.1% of returns)
Here:
$2,477
State:
$4,439
Here:
3.2% of AGI
State:
3.6% of AGI
(% of AGI for various income ranges: 1.2% for AGIs $25k-50k, 1.1% for AGIs $50k-75k, 2.0% for AGIs $75k-100k, 2.3% for AGIs over 100k)
Total tax: $4,243 (reported on 73.7% of returns)
13322:
$4,243
State:
$11,730
(% of AGI for various income ranges: 2.3% for AGIs below $10k, 4.0% for AGIs $10k-25k, 6.2% for AGIs $25k-50k, 7.9% for AGIs $50k-75k, 8.8% for AGIs $75k-100k, 17.7% for AGIs over 100k)
Earned income credit: $1,729 (reported on 12.5% of returns)
Here:
$1,729
State:
$1,757
Percentage of individuals using paid preparers for their 2004 taxes: 57.6%
Here:
58%
State:
67%
(% for various income ranges: 56.2% for AGIs below $10k, 53.0% for AGIs $10k-25k, 57.6% for AGIs $25k-50k, 64.2% for AGIs $50k-75k, 55.2% for AGIs $75k-100k, 70.4% for AGIs over 100k)
Likely homosexual households (counted as self-reported same-sex unmarried-partner households)
Lesbian couples: 0.9% of all households
Gay men: 0.0% of all households
Household received Food Stamps/SNAP in the past 12 months: 28 Household did not receive Food Stamps/SNAP in the past 12 months: 368
Women who had a birth in the past 12 months: 13 (13 now married, 0 unmarried) Women who did not have a birth in the past 12 months: 194 (109 now married, 83 unmarried)
Housing units in zip code 13322 with a mortgage: 189 (20 second mortgage, 7 both second mortgage and home equity loan) Houses without a mortgage: 14
Median monthly owner costs for units with a mortgage: $1,664 Median monthly owner costs for units without a mortgage: $765
Residents with income below the poverty level in 2022:
This zip code:
4.0%
Whole state:
14.3%
Residents with income below 50% of the poverty level in 2022:
This zip code:
3.1%
Whole state:
6.8%
Median number of rooms in houses and condos:
Here:
6.7
State:
6.3
Median number of rooms in apartments:
Here:
6.5
State:
3.8
Notable locations in this zip code not listed on our city pages
Size of family households: 169 2-persons, 51 3-persons, 68 4-persons, 20 5-persons, 8 6-persons, 2 7-or-more-persons
Size of nonfamily households: 43 1-person, 31 2-persons, 3 4-persons
163 married couples with children.
55 single-parent households (48 men, 7 women).
98.3% of residents of 13322 zip code speak English at home.
1.5% of residents speak Spanish at home (100% very well).
0.2% of residents speak other Indo-European language at home (100% very well).
Foreign born population: 5 (0.6%) (67.8% of them are naturalized citizens)
This zip code:
0.6%
Whole state:
22.7%
80%Serbia
17%German
13%Irish
9%Italian
7%English
6%Welsh
6%French Canadian
5%Polish
Year of entry for the foreign-born population
02010 or later
02000 to 2009
01990 to 1999
5Before 1990
Facilities with environmental interests located in this zip code:
HOMOGENEOUS METALS (2395 MAIN STREET in CLAYVILLE, NY)
AIR MINOR (AIRS/AFS) STATE MASTER (New York facility tracking) - AIR PROGRAM, FLOODPLAINS, National Pollutant Discharge Elimination System Permit, AIR PROGRAM, National Pollutant Discharge Elimination System Permit, National Pollutant Discharge Elimination System Permit CRITERIA AND HAZARDOUS AIR POLLUTANT INVENTORY (Inventory of air pollution sources) PERFORMANCE TRACK (National Environmental Performance Track) Small Quantity Generators, between 100 kg and 1000 kg of hazardous waste/month (Resource Conservation and Recovery Act (tracking hazardous waste)) TRI REPORTER (Tracking of toxic chemicals releasing facilities) Business SIC classification: PRIMARY METAL PRODUCTS; NONCLASSIFIABLE ESTABLISHMENTS Organizations: HOMOGENEOUS METALS INC (LEGALLY RESPONSIBLE PARTY)
Housing units lacking complete plumbing facilities: 1.4% Housing units lacking complete kitchen facilities: 0.6%
38.8%Utility gas
28.0%Fuel oil, kerosene, etc.
19.5%Bottled, tank, or LP gas
9.8%Wood
3.9%Electricity
0.8%Coal or coke
Population in 1990: 641. Population change in the 1990s: +463 (+72.2%).
Place of birth for U.S.-born residents:
This state: 911
Northeast: 94
Midwest: 6
South: 28
West: 5
73% of the 13322 zip code residents lived in the same house 5 years ago. Out of people who lived in different houses, 59% lived in this county. Out of people who lived in different counties, 50% lived in New York.
92% of the 13322 zip code residents lived in the same house 1 year ago. Out of people who lived in different houses, 38% moved from this county. Out of people who lived in different houses, 52% moved from different county within same state. Out of people who lived in different houses, 8% moved from different state.
Private vs. public school enrollment:
Students in private schools in grades 1 to 8 (elementary and middle school): 2
Here:
1.8%
New York:
15.6%
Students in private schools in grades 9 to 12 (high school):
Here:
0.0%
New York:
15.0%
Students in private undergraduate colleges:
Here:
0.0%
New York:
39.2%
Occupation by median earnings in the past 12 months ($)
95,375Health diagnosing and treating practitioners and other technical occupations
86,276Business and financial operations occupations
74,566Health technologists and technicians
64,849Installation, maintenance, and repair occupations
60,902Computer and mathematical occupations
50,203Architecture and engineering occupations
Companies with federal contracts located in this zip code:
HOMOGENEOUS METALS, INC (2395 MAIN ST in CLAYVILLE, NY)
$54,000 with NASA for Additive Metal Materials. Signed on 2000-02-15. Completion date: 2000-05-15.
Top industries in this zip code by the number of employees in 2005:
Construction: Highway, Street, and Bridge Construction (10-19 employees: 1 establishment, 1-4 employees: 1 establishment)
Other Services (except Public Administration): Commercial and Industrial Machinery and Equipment (except Automotive and Electronic) Repair and Maintenance (5-9: 1)
Mining: Crushed and Broken Limestone Mining and Quarrying (5-9: 1)
Accommodation and Food Services: Caterers (5-9: 1)
Management of Companies and Enterprises: Corporate, Subsidiary, and Regional Managing Offices (5-9: 1)
Finance and Insurance: Insurance Agencies and Brokerages (1-4: 2)
Arts, Entertainment, and Recreation: Golf Courses and Country Clubs (1-4: 2)
Home Mortgage Disclosure Act Aggregated Statistics For Year 2009 (Based on 2 partial tracts)
A) FHA, FSA/RHS & VA Home Purchase Loans
B) Conventional Home Purchase Loans
C) Refinancings
D) Home Improvement Loans
Number
Average Value
Number
Average Value
Number
Average Value
Number
Average Value
LOANS ORIGINATED
2
$93,060
1
$187,780
15
$127,104
4
$23,205
APPLICATIONS APPROVED, NOT ACCEPTED
0
$0
0
$0
1
$84,510
0
$0
APPLICATIONS DENIED
1
$130,330
0
$0
5
$134,084
3
$13,373
APPLICATIONS WITHDRAWN
0
$0
0
$0
4
$92,705
0
$0
FILES CLOSED FOR INCOMPLETENESS
0
$0
0
$0
0
$0
0
$0
Aggregated Statistics For Year 2008 (Based on 2 partial tracts)
A) FHA, FSA/RHS & VA Home Purchase Loans
B) Conventional Home Purchase Loans
C) Refinancings
D) Home Improvement Loans
G) Loans On Manufactured Home Dwelling (A B C & D)
Number
Average Value
Number
Average Value
Number
Average Value
Number
Average Value
Number
Average Value
LOANS ORIGINATED
2
$96,505
6
$119,412
8
$97,038
4
$22,850
1
$76,210
APPLICATIONS APPROVED, NOT ACCEPTED
0
$0
1
$31,100
1
$134,130
1
$64,570
0
$0
APPLICATIONS DENIED
0
$0
1
$43,920
7
$126,263
2
$22,195
0
$0
APPLICATIONS WITHDRAWN
0
$0
0
$0
3
$121,310
0
$0
0
$0
FILES CLOSED FOR INCOMPLETENESS
0
$0
0
$0
1
$181,850
0
$0
0
$0
Aggregated Statistics For Year 2007 (Based on 2 partial tracts)
A) FHA, FSA/RHS & VA Home Purchase Loans
B) Conventional Home Purchase Loans
C) Refinancings
D) Home Improvement Loans
F) Non-occupant Loans on < 5 Family Dwellings (A B C & D)
Number
Average Value
Number
Average Value
Number
Average Value
Number
Average Value
Number
Average Value
LOANS ORIGINATED
3
$84,277
9
$122,182
13
$96,439
6
$43,998
1
$83,560
APPLICATIONS APPROVED, NOT ACCEPTED
0
$0
0
$0
1
$108,020
0
$0
0
$0
APPLICATIONS DENIED
0
$0
2
$73,120
10
$104,171
3
$43,050
1
$57,690
APPLICATIONS WITHDRAWN
0
$0
1
$188,260
3
$137,297
1
$72,880
0
$0
FILES CLOSED FOR INCOMPLETENESS
0
$0
1
$58,880
2
$137,455
0
$0
0
$0
Aggregated Statistics For Year 2006 (Based on 2 partial tracts)
A) FHA, FSA/RHS & VA Home Purchase Loans
B) Conventional Home Purchase Loans
C) Refinancings
D) Home Improvement Loans
F) Non-occupant Loans on < 5 Family Dwellings (A B C & D)
G) Loans On Manufactured Home Dwelling (A B C & D)
Number
Average Value
Number
Average Value
Number
Average Value
Number
Average Value
Number
Average Value
Number
Average Value
LOANS ORIGINATED
2
$68,610
8
$109,560
15
$81,761
8
$37,688
1
$125,580
0
$0
APPLICATIONS APPROVED, NOT ACCEPTED
0
$0
1
$200,370
1
$154,070
0
$0
0
$0
0
$0
APPLICATIONS DENIED
0
$0
4
$105,702
12
$109,936
5
$41,166
0
$0
1
$68,130
APPLICATIONS WITHDRAWN
0
$0
1
$137,690
6
$107,383
0
$0
1
$79,290
0
$0
FILES CLOSED FOR INCOMPLETENESS
0
$0
1
$78,580
2
$63,150
0
$0
0
$0
0
$0
Aggregated Statistics For Year 2005 (Based on 2 partial tracts)
A) FHA, FSA/RHS & VA Home Purchase Loans
B) Conventional Home Purchase Loans
C) Refinancings
D) Home Improvement Loans
F) Non-occupant Loans on < 5 Family Dwellings (A B C & D)
G) Loans On Manufactured Home Dwelling (A B C & D)
Number
Average Value
Number
Average Value
Number
Average Value
Number
Average Value
Number
Average Value
Number
Average Value
LOANS ORIGINATED
2
$96,030
9
$109,468
16
$88,328
3
$43,840
1
$65,050
0
$0
APPLICATIONS APPROVED, NOT ACCEPTED
0
$0
1
$32,520
2
$79,410
1
$31,340
0
$0
0
$0
APPLICATIONS DENIED
0
$0
4
$82,615
14
$89,466
4
$44,395
0
$0
2
$50,920
APPLICATIONS WITHDRAWN
0
$0
1
$111,340
11
$104,736
2
$68,610
0
$0
0
$0
FILES CLOSED FOR INCOMPLETENESS
0
$0
0
$0
2
$99,350
1
$35,370
0
$0
0
$0
Aggregated Statistics For Year 2004 (Based on 2 partial tracts)
A) FHA, FSA/RHS & VA Home Purchase Loans
B) Conventional Home Purchase Loans
C) Refinancings
D) Home Improvement Loans
F) Non-occupant Loans on < 5 Family Dwellings (A B C & D)
Number
Average Value
Number
Average Value
Number
Average Value
Number
Average Value
Number
Average Value
LOANS ORIGINATED
2
$79,765
8
$117,068
17
$91,301
7
$24,826
1
$138,640
APPLICATIONS APPROVED, NOT ACCEPTED
0
$0
0
$0
1
$87,840
1
$37,030
0
$0
APPLICATIONS DENIED
0
$0
1
$89,970
10
$91,636
5
$27,112
0
$0
APPLICATIONS WITHDRAWN
0
$0
1
$94,010
12
$118,818
0
$0
0
$0
FILES CLOSED FOR INCOMPLETENESS
0
$0
0
$0
1
$90,450
0
$0
0
$0
Aggregated Statistics For Year 2003 (Based on 2 partial tracts)
A) FHA, FSA/RHS & VA Home Purchase Loans
B) Conventional Home Purchase Loans
C) Refinancings
D) Home Improvement Loans
F) Non-occupant Loans on < 5 Family Dwellings (A B C & D)
Number
Average Value
Number
Average Value
Number
Average Value
Number
Average Value
Number
Average Value
LOANS ORIGINATED
3
$76,443
9
$110,074
33
$85,011
4
$34,422
1
$42,020
APPLICATIONS APPROVED, NOT ACCEPTED
0
$0
1
$51,990
3
$100,340
0
$0
0
$0
APPLICATIONS DENIED
0
$0
2
$44,155
13
$73,302
1
$41,540
1
$25,880
APPLICATIONS WITHDRAWN
0
$0
0
$0
9
$102,768
0
$0
0
$0
FILES CLOSED FOR INCOMPLETENESS
0
$0
1
$52,940
1
$77,150
0
$0
0
$0
Aggregated Statistics For Year 2002 (Based on 2 partial tracts)
A) FHA, FSA/RHS & VA Home Purchase Loans
B) Conventional Home Purchase Loans
C) Refinancings
D) Home Improvement Loans
F) Non-occupant Loans on < 5 Family Dwellings (A B C & D)
Number
Average Value
Number
Average Value
Number
Average Value
Number
Average Value
Number
Average Value
LOANS ORIGINATED
1
$99,710
11
$96,061
23
$72,944
6
$25,402
1
$65,760
APPLICATIONS APPROVED, NOT ACCEPTED
0
$0
1
$53,890
3
$63,307
1
$27,060
0
$0
APPLICATIONS DENIED
0
$0
1
$60,300
10
$83,422
3
$13,293
0
$0
APPLICATIONS WITHDRAWN
0
$0
1
$61,490
9
$77,498
0
$0
0
$0
FILES CLOSED FOR INCOMPLETENESS
0
$0
0
$0
0
$0
0
$0
0
$0
Aggregated Statistics For Year 2001 (Based on 2 partial tracts)
A) FHA, FSA/RHS & VA Home Purchase Loans
B) Conventional Home Purchase Loans
C) Refinancings
D) Home Improvement Loans
Number
Average Value
Number
Average Value
Number
Average Value
Number
Average Value
LOANS ORIGINATED
2
$83,920
6
$78,975
14
$68,795
5
$16,190
APPLICATIONS APPROVED, NOT ACCEPTED
0
$0
0
$0
2
$63,860
2
$24,095
APPLICATIONS DENIED
0
$0
1
$55,790
9
$67,818
4
$13,948
APPLICATIONS WITHDRAWN
0
$0
1
$44,160
6
$75,335
1
$38,700
FILES CLOSED FOR INCOMPLETENESS
0
$0
0
$0
1
$58,640
0
$0
Aggregated Statistics For Year 2000 (Based on 2 partial tracts)
A) FHA, FSA/RHS & VA Home Purchase Loans
B) Conventional Home Purchase Loans
C) Refinancings
D) Home Improvement Loans
Number
Average Value
Number
Average Value
Number
Average Value
Number
Average Value
LOANS ORIGINATED
2
$84,750
8
$83,001
6
$55,947
5
$34,044
APPLICATIONS APPROVED, NOT ACCEPTED
0
$0
1
$57,930
1
$50,570
0
$0
APPLICATIONS DENIED
0
$0
3
$43,050
5
$52,512
3
$16,300
APPLICATIONS WITHDRAWN
0
$0
0
$0
3
$45,977
1
$20,650
FILES CLOSED FOR INCOMPLETENESS
0
$0
0
$0
1
$87,130
0
$0
Aggregated Statistics For Year 1999 (Based on 1 partial tract)

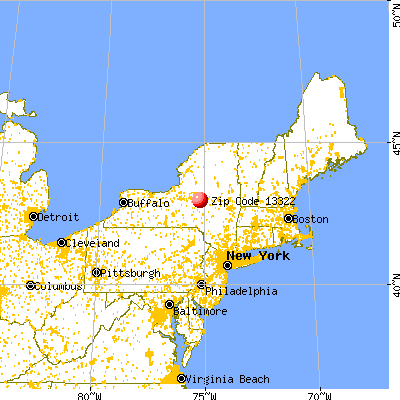


 Nearest zip codes: 13318, 13456, 13491, 13319, 13313, 13357.


