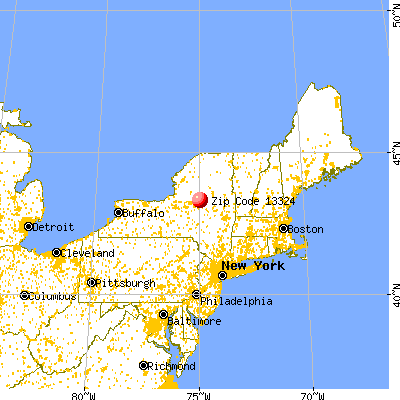
Estimated zip code population in 2022: 1,626 Zip code population in 2010: 2,149 Zip code population in 2000: 1,989
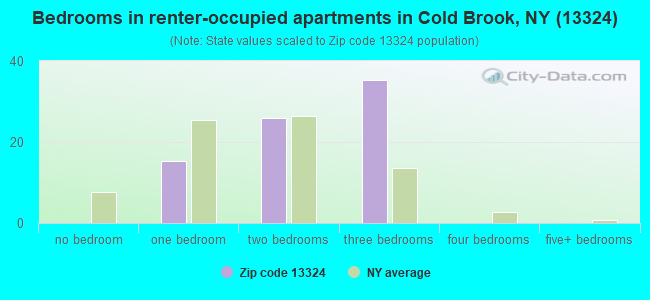
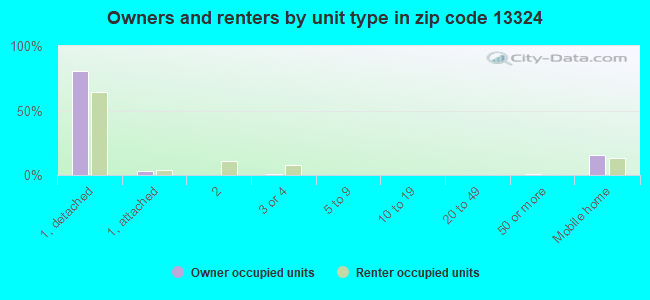
Houses and condos: 1,409 Renter-occupied apartments: 77
% of renters here:
10%
State:
46%
March 2022 cost of living index in zip code 13324: 93.8 (less than average, U.S. average is 100)
Land area: 119.3 sq. mi. Water area: 4.4 sq. mi.
Population density: 14 people per square mile
(very low).
OSM Map
General Map
Google Map
MSN Map
OSM Map
General Map
Google Map
MSN Map
OSM Map
General Map
Google Map
MSN Map
OSM Map
General Map
Google Map
MSN Map
Please wait while loading the map...
Real estate property taxes paid for housing units in 2022:
This zip code:
1.5% ($2,058)
New York:
1.5% ($6,180)
Median real estate property taxes paid for housing units with mortgages in 2022: $2,396 (1.5%) Median real estate property taxes paid for housing units with no mortgage in 2022: $1,815 (1.4%)
Business Search- 14 Million verified businesses
Males: 879
(54.0%)
Females: 747
(46.0%)
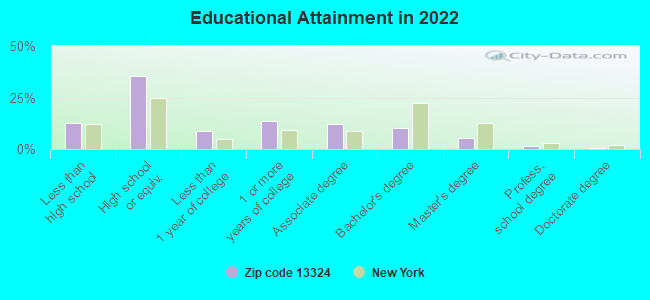
For population 25 years and over in 13324:
High school or higher: 86.2%
Bachelor's degree or higher: 17.6%
Graduate or professional degree: 7.6%
Unemployed: 4.4%
Mean travel time to work (commute): 34.0 minutes
For population 15 years and over in 13324:
Never married: 24.9%
Now married: 58.6%
Separated: 1.2%
Widowed: 4.5%
Divorced: 10.8%
Zip code 13324 compared to state average:
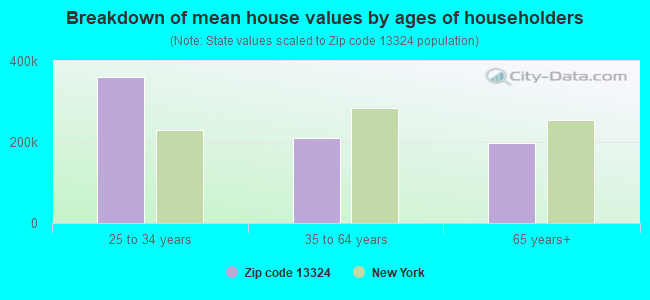
Median house value significantly below state average.
Black race population percentage significantly below state average.
Hispanic race population percentage significantly below state average.
Median age significantly above state average.
Foreign-born population percentage significantly below state average.
Renting percentage significantly below state average.
Length of stay since moving in below state average.
Number of college students below state average.
Percentage of population with a bachelor's degree or higher below state average.
Averages for the 2020 tax year for zip code 13324, filed in 2021:
Average Adjusted Gross Income (AGI) in 2020: $54,520 (Individual Income Tax Returns)
Here:
$54,520
State:
$90,930
Salary/wage: $47,038 (reported on 78.6% of returns)
Here:
$47,038
State:
$72,104
(% of AGI for various income ranges: 1058.0% for AGIs below $25k, 3670.0% for AGIs $25k-50k, 6048.2% for AGIs $50k-75k, 8305.7% for AGIs $75k-100k, 19898.6% for AGIs $100k-200k)
Taxable interest for individuals: $507 (reported on 28.6% of returns)
This zip code:
$507
New York:
$3,075
(% of AGI for various income ranges: 26.0% for AGIs below $25k, 12.9% for AGIs $25k-50k, 5.5% for AGIs $50k-75k, 20.0% for AGIs $75k-100k, 61.4% for AGIs $100k-200k)
Ordinary dividends: $1,840 (reported on 15.3% of returns)
Here:
$1,840
State:
$11,095
(% of AGI for various income ranges: 73.5% for AGIs below $25k, 12.9% for AGIs $25k-50k, 35.5% for AGIs $50k-75k, 90.0% for AGIs $100k-200k)
Net capital gain/loss in AGI: +$5,000 (reported on 10.2% of returns)
Here:
+$5,000
State:
+$44,925
(% of AGI for various income ranges: 12.0% for AGIs below $25k, 15.2% for AGIs $25k-50k, 150.0% for AGIs $50k-75k, 398.6% for AGIs $100k-200k)
Profit/loss from business: +$4,458 (reported on 12.2% of returns)
Here:
+$4,458
State:
+$14,940
(% of AGI for various income ranges: 102.0% for AGIs below $25k, 93.3% for AGIs $25k-50k, 192.9% for AGIs $75k-100k)
Taxable individual retirement arrangement distribution: $17,038 (reported on 8.2% of returns)
13324:
$17,038
New York:
$19,609
(% of AGI for various income ranges: 91.5% for AGIs below $25k, 181.9% for AGIs $25k-50k, 1140.0% for AGIs $75k-100k)
Total itemized deductions: $15,800 (reported on 3.1% of returns)
Here:
$15,800
State:
$39,326
(% of AGI for various income ranges: 430.9% for AGIs $50k-75k)
Taxes paid: $6,733 (reported on 3.1% of returns)
13324:
$6,733
State:
$9,183
(% of AGI for various income ranges: 288.6% for AGIs $75k-100k)
Earned income credit: $2,064 (reported on 14.3% of returns)
Here:
$2,064
State:
$2,138
(% of AGI for various income ranges: 85.0% for AGIs below $25k, 56.7% for AGIs $25k-50k)
Percentage of individuals using paid preparers for their 2020 taxes: 93.9%
Here:
94%
State:
95%
(% for various income ranges: 93.3% for AGIs below $25k, 96.4% for AGIs $25k-50k, 93.8% for AGIs $50k-75k, 90.0% for AGIs $75k-100k, 92.9% for AGIs $100k-200k)
Averages for the 2012 tax year for zip code 13324, filed in 2013:
Average Adjusted Gross Income (AGI) in 2012: $41,919 (Individual Income Tax Returns)
Here:
$41,919
State:
$77,088
Salary/wage: $38,372 (reported on 84.1% of returns)
Here:
$38,372
State:
$60,593
(% of AGI for various income ranges: 72.6% for AGIs below $25k, 78.8% for AGIs $25k-50k, 79.9% for AGIs $50k-75k, 70.4% for AGIs $75k-100k, 80.3% for AGIs $100k-200k)
Taxable interest for individuals: $315 (reported on 30.7% of returns)
This zip code:
$315
New York:
$3,125
(% of AGI for various income ranges: 0.5% for AGIs below $25k, 0.4% for AGIs $25k-50k, 0.1% for AGIs $50k-75k, 0.2% for AGIs $75k-100k)
Ordinary dividends: $1,800 (reported on 13.6% of returns)
Here:
$1,800
State:
$10,299
(% of AGI for various income ranges: 2.1% for AGIs below $25k, 0.3% for AGIs $25k-50k, 0.3% for AGIs $50k-75k, 0.8% for AGIs $75k-100k, 0.3% for AGIs $100k-200k)
Profit/loss from business: +$5,350 (reported on 13.6% of returns)
Here:
+$5,350
State:
+$16,168
(% of AGI for various income ranges: 6.4% for AGIs below $25k, 2.3% for AGIs $25k-50k, 1.7% for AGIs $50k-75k)
Taxable individual retirement arrangement distribution: $10,780 (reported on 5.7% of returns)
13324:
$10,780
New York:
$17,621
Total itemized deductions: $17,119 (21% of AGI, reported on 18.2% of returns)
Here:
$17,119
State:
$34,985
Here:
21.0% of AGI
State:
21.3% of AGI
(% of AGI for various income ranges: 5.9% for AGIs $25k-50k, 5.2% for AGIs $50k-75k, 10.2% for AGIs $75k-100k, 13.7% for AGIs $100k-200k)
Charity contributions: $1,318 (reported on 12.5% of returns)
Here:
$1,318
State:
$5,572
(% of AGI for various income ranges: 0.5% for AGIs $25k-50k, 0.4% for AGIs $75k-100k, 0.9% for AGIs $100k-200k)
Taxes paid: $6,969 (reported on 18.2% of returns)
13324:
$6,969
State:
$18,656
(% of AGI for various income ranges: 1.5% for AGIs $25k-50k, 2.0% for AGIs $50k-75k, 4.0% for AGIs $75k-100k, 7.0% for AGIs $100k-200k)
Earned income credit: $2,065 (reported on 19.3% of returns)
Here:
$2,065
State:
$2,230
(% of AGI for various income ranges: 5.8% for AGIs below $25k, 1.1% for AGIs $25k-50k)
Percentage of individuals using paid preparers for their 2012 taxes: 56.8%
Here:
57%
State:
66%
(% for various income ranges: 51.5% for AGIs below $25k, 53.8% for AGIs $25k-50k, 60.0% for AGIs $50k-75k, 75.0% for AGIs $75k-100k, 66.7% for AGIs $100k-200k)
Averages for the 2004 tax year for zip code 13324, filed in 2005:
Average Adjusted Gross Income (AGI) in 2004: $33,502 (Individual Income Tax Returns)
Here:
$33,502
State:
$59,519
Salary/wage: $31,787 (reported on 89.3% of returns)
Here:
$31,787
State:
$50,673
(% of AGI for various income ranges: 100.7% for AGIs below $10k, 77.9% for AGIs $10k-25k, 86.9% for AGIs $25k-50k, 84.9% for AGIs $50k-75k, 86.6% for AGIs $75k-100k, 80.0% for AGIs over 100k)
Taxable interest for individuals: $392 (reported on 35.7% of returns)
This zip code:
$392
New York:
$2,377
(% of AGI for various income ranges: 3.1% for AGIs below $10k, 0.5% for AGIs $10k-25k, 0.3% for AGIs $25k-50k, 0.5% for AGIs $50k-75k, 0.2% for AGIs $75k-100k, 0.2% for AGIs over 100k)
Taxable dividends: $280 (reported on 17.3% of returns)
Here:
$280
State:
$5,394
(% of AGI for various income ranges: 1.3% for AGIs below $10k, 0.1% for AGIs $10k-25k, 0.1% for AGIs $25k-50k, 0.1% for AGIs $50k-75k, 0.1% for AGIs $75k-100k, 0.1% for AGIs over 100k)
Net capital gain/loss: +$374 (reported on 10.5% of returns)
Here:
+$374
State:
+$23,581
(% of AGI for various income ranges: -2.7% for AGIs below $10k, 0.3% for AGIs $10k-25k, 0.1% for AGIs $25k-50k, 0.1% for AGIs $50k-75k, 0.9% for AGIs over 100k)
Profit/loss from business: +$2,743 (reported on 13.0% of returns)
Here:
+$2,743
State:
+$13,809
(% of AGI for various income ranges: -5.3% for AGIs below $10k, 5.0% for AGIs $10k-25k, 0.7% for AGIs $25k-50k, 1.2% for AGIs $50k-75k)
IRA payment deduction: $2,941 (reported on 2.0% of returns)
13324:
$2,941
New York:
$3,115
Total itemized deductions: $13,240 (20% of AGI, reported on 20.2% of returns)
Here:
$13,240
State:
$25,864
Here:
20.4% of AGI
State:
21.9% of AGI
(% of AGI for various income ranges: 4.4% for AGIs $10k-25k, 5.8% for AGIs $25k-50k, 9.8% for AGIs $50k-75k, 11.2% for AGIs $75k-100k, 11.8% for AGIs over 100k)
Charity contributions deductions: $1,510 (2% of AGI, reported on 17.9% of returns)
Here:
$1,510
State:
$4,439
Here:
2.3% of AGI
State:
3.6% of AGI
(% of AGI for various income ranges: 0.3% for AGIs $10k-25k, 0.5% for AGIs $25k-50k, 1.2% for AGIs $50k-75k, 1.2% for AGIs $75k-100k, 1.2% for AGIs over 100k)
Total tax: $3,993 (reported on 69.6% of returns)
13324:
$3,993
State:
$11,730
(% of AGI for various income ranges: 2.4% for AGIs below $10k, 4.1% for AGIs $10k-25k, 6.4% for AGIs $25k-50k, 8.5% for AGIs $50k-75k, 10.3% for AGIs $75k-100k, 16.8% for AGIs over 100k)
Earned income credit: $1,686 (reported on 21.7% of returns)
Here:
$1,686
State:
$1,757
Percentage of individuals using paid preparers for their 2004 taxes: 62.5%
Here:
62%
State:
67%
(% for various income ranges: 53.5% for AGIs below $10k, 70.0% for AGIs $10k-25k, 59.8% for AGIs $25k-50k, 67.2% for AGIs $50k-75k, 54.0% for AGIs $75k-100k, 82.6% for AGIs over 100k)
Household received Food Stamps/SNAP in the past 12 months: 96 Household did not receive Food Stamps/SNAP in the past 12 months: 650
Women who had a birth in the past 12 months: 25 (20 now married, 5 unmarried) Women who did not have a birth in the past 12 months: 196 (101 now married, 93 unmarried)
Housing units in zip code 13324 with a mortgage: 290 (56 second mortgage, 57 both second mortgage and home equity loan) Houses without a mortgage: 26
Median monthly owner costs for units with a mortgage: $1,199 Median monthly owner costs for units without a mortgage: $451
Residents with income below the poverty level in 2022:
This zip code:
10.1%
Whole state:
14.3%
Residents with income below 50% of the poverty level in 2022:
This zip code:
5.0%
Whole state:
6.8%
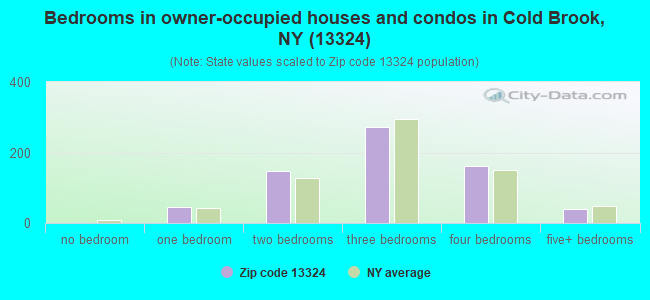
Median number of rooms in houses and condos:
Here:
6.4
State:
6.3
Median number of rooms in apartments:
Here:
5.1
State:
3.8
Notable locations in this zip code not listed on our city pages
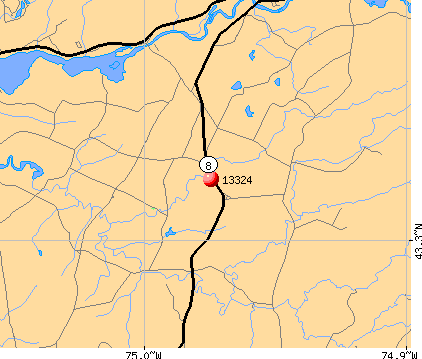
Notable locations in zip code 13324: Wilmurt (A), Pardeeville Corners (B), Woodin Corners (C), Wilmurt Corners (D), Poland Volunteer Fire Company Station 2 (E). Display/hide their locations on the map
Cemeteries: Hurricane Cemetery (1), Smith Cemetery (2), Cold Brook Cemetery (3), Ohio Cemetery (4), Brondstatter Cemetery (5), Faiview Cemetery (6), Century Cemetery (7). Display/hide their locations on the map
Lakes, reservoirs, and swamps: Mad Tom Lake (A), Mill Creek Lake (B), Spectacle Lake (C), Swan Lake (D), Lake Tamarack (E), Tom Kettle Lake (F), White Lead Lake (G), Atwood Lake (H). Display/hide their locations on the map
Streams, rivers, and creeks: Buttermilk Brook (A), Paul Brook (B), Wilt Brook (C), Fox Brook (D), Taynter Brook (E), South Branch West Canada Creek (F), Fourmile Brook (G), Concklin Brook (H), Remus Brook (I). Display/hide their locations on the map
Size of family households: 346 2-persons, 69 3-persons, 49 4-persons, 27 5-persons, 1 6-persons
Size of nonfamily households: 187 1-person, 57 2-persons, 15 3-persons
124 married couples with children.
70 single-parent households (24 men, 46 women).
97.6% of residents of 13324 zip code speak English at home.
0.4% of residents speak Spanish at home (100% very well).
2.3% of residents speak other Indo-European language at home (100% very well).
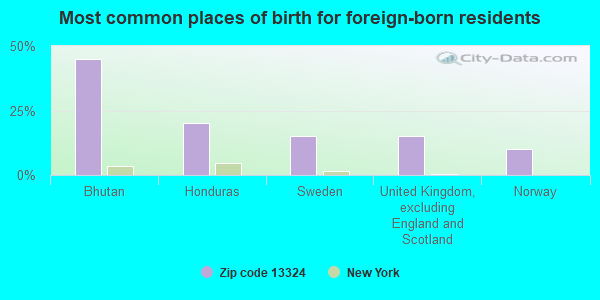
Foreign born population: 21 (1.3%) (86.3% of them are naturalized citizens)
This zip code:
1.3%
Whole state:
22.7%
45%Bhutan
20%Honduras
15%Sweden
15%United Kingdom, excluding England and Scotland
10%Norway
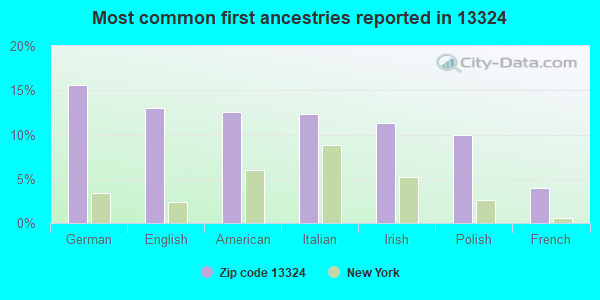
16%German
13%English
12%American
12%Italian
11%Irish
10%Polish
4%French
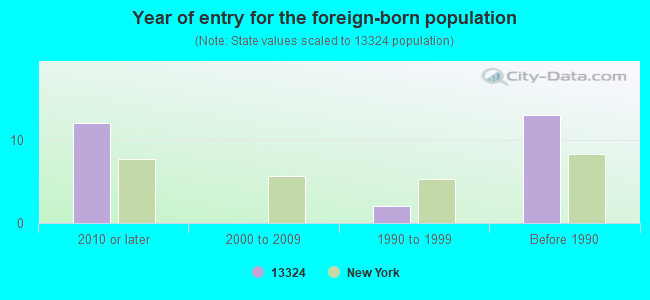
Year of entry for the foreign-born population
122010 or later
02000 to 2009
21990 to 1999
13Before 1990
Housing units lacking complete plumbing facilities: 14.2% Housing units lacking complete kitchen facilities: 3.6%
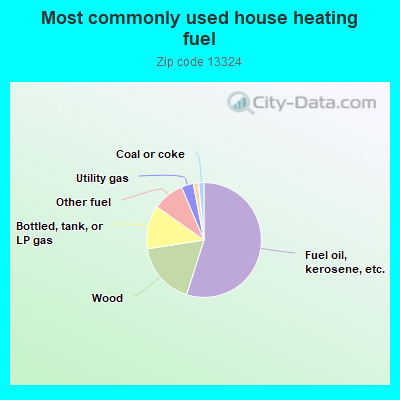
55.2%Fuel oil, kerosene, etc.
17.7%Wood
12.3%Bottled, tank, or LP gas
8.9%Other fuel
3.4%Utility gas
1.5%Electricity
1.5%Coal or coke
Population in 1990: 1,853. Population change in the 1990s: +136 (+7.3%).
Place of birth for U.S.-born residents:
This state: 1,347
Northeast: 99
Midwest: 56
South: 52
West: 41
75% of the 13324 zip code residents lived in the same house 5 years ago. Out of people who lived in different houses, 53% lived in this county. Out of people who lived in different counties, 50% lived in New York.
95% of the 13324 zip code residents lived in the same house 1 year ago. Out of people who lived in different houses, 63% moved from this county. Out of people who lived in different houses, 27% moved from different county within same state. Out of people who lived in different houses, 5% moved from different state.
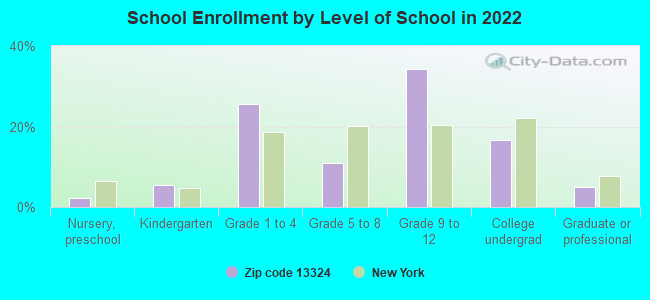
Private vs. public school enrollment:
Students in private schools in grades 1 to 8 (elementary and middle school): 5
Here:
6.1%
New York:
15.6%
Students in private schools in grades 9 to 12 (high school):
Here:
0.0%
New York:
15.0%
Students in private undergraduate colleges:
Here:
0.0%
New York:
39.2%
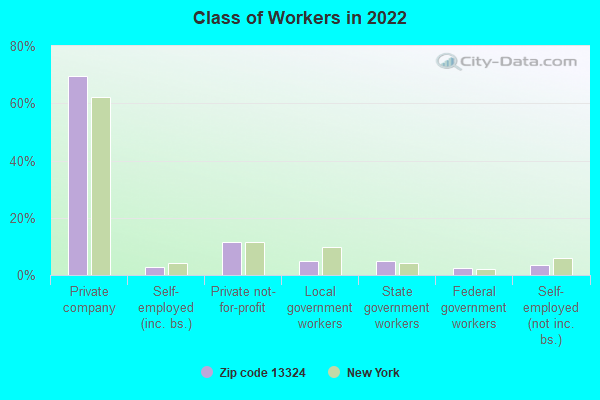
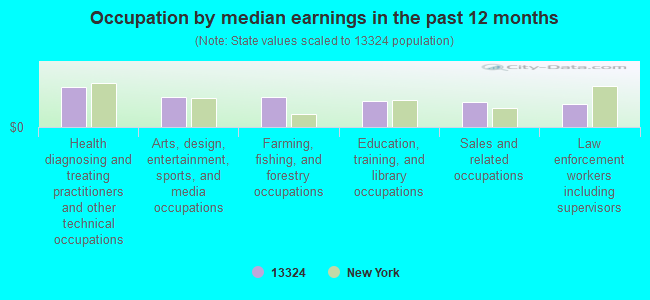
Occupation by median earnings in the past 12 months ($)
97,387Health diagnosing and treating practitioners and other technical occupations
74,367Arts, design, entertainment, sports, and media occupations
73,768Farming, fishing, and forestry occupations
63,922Education, training, and library occupations
60,235Sales and related occupations
56,289Law enforcement workers including supervisors
Top industries in this zip code by the number of employees in 2005:
Other Services (except Public Administration): Labor Unions and Similar Labor Organizations (5-9 employees: 1 establishment)
Construction: Plumbing, Heating, and Air-Conditioning Contractors (1-4: 2)
Construction: New Single-Family Housing Construction (except Operative Builders) (1-4: 1)
Health Care and Social Assistance: Vocational Rehabilitation Services (1-4: 1)
Construction: All Other Specialty Trade Contractors (1-4: 1)
Administrative and Support and Waste Management and Remediation Services: Other Services to Buildings and Dwellings (1-4: 1)
Accommodation and Food Services: RV (Recreational Vehicle) Parks and Campgrounds (1-4: 1)
Fatal accident statistics in 2011:
Fatal accident count: 1
Vehicles involved in fatal accidents: 1
Fatal accidents caused by drunken drivers: 0
Fatalities: 1
Persons involved in fatal accidents: 1
Pedestrians involved in fatal accidents: 0
Home Mortgage Disclosure Act Aggregated Statistics For Year 2009 (Based on 4 partial tracts)
A) FHA, FSA/RHS & VA Home Purchase Loans
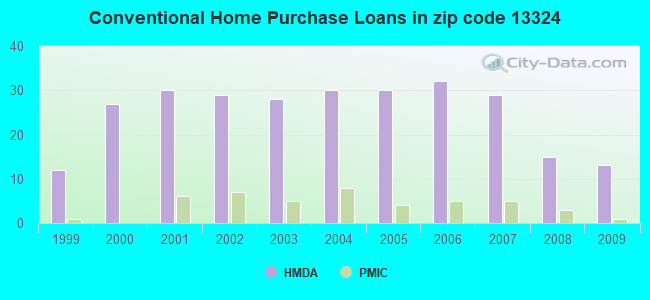
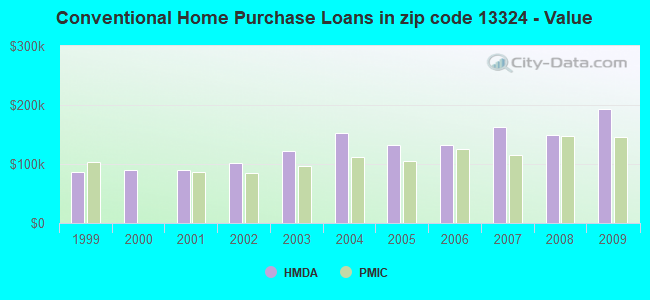
B) Conventional Home Purchase Loans
C) Refinancings
D) Home Improvement Loans
F) Non-occupant Loans on < 5 Family Dwellings (A B C & D)
G) Loans On Manufactured Home Dwelling (A B C & D)
Number
Average Value
Number
Average Value
Number
Average Value
Number
Average Value
Number
Average Value
Number
Average Value
LOANS ORIGINATED
4
$116,308
13
$193,058
32
$160,679
11
$58,317
16
$270,239
3
$49,487
APPLICATIONS APPROVED, NOT ACCEPTED
1
$50,150
1
$342,120
4
$155,110
1
$4,620
2
$242,400
0
$0
APPLICATIONS DENIED
0
$0
3
$170,983
14
$143,014
8
$18,439
3
$198,380
4
$54,198
APPLICATIONS WITHDRAWN
0
$0
1
$34,320
9
$150,237
0
$0
2
$204,360
0
$0
FILES CLOSED FOR INCOMPLETENESS
0
$0
0
$0
1
$168,160
0
$0
0
$0
0
$0
Aggregated Statistics For Year 2008 (Based on 4 partial tracts)
A) FHA, FSA/RHS & VA Home Purchase Loans
B) Conventional Home Purchase Loans
C) Refinancings
D) Home Improvement Loans
F) Non-occupant Loans on < 5 Family Dwellings (A B C & D)
G) Loans On Manufactured Home Dwelling (A B C & D)
Number
Average Value
Number
Average Value
Number
Average Value
Number
Average Value
Number
Average Value
Number
Average Value
LOANS ORIGINATED
4
$97,070
15
$148,783
30
$128,702
18
$60,562
11
$244,740
5
$54,164
APPLICATIONS APPROVED, NOT ACCEPTED
0
$0
3
$267,290
4
$189,052
1
$45,890
2
$407,400
1
$77,840
APPLICATIONS DENIED
2
$75,400
7
$115,257
23
$145,427
13
$52,745
5
$183,104
3
$65,267
APPLICATIONS WITHDRAWN
0
$0
1
$258,680
7
$138,491
2
$81,580
2
$288,180
0
$0
FILES CLOSED FOR INCOMPLETENESS
1
$101,960
1
$292,560
4
$140,898
0
$0
0
$0
1
$99,590
Aggregated Statistics For Year 2007 (Based on 4 partial tracts)
A) FHA, FSA/RHS & VA Home Purchase Loans
B) Conventional Home Purchase Loans
C) Refinancings
D) Home Improvement Loans
F) Non-occupant Loans on < 5 Family Dwellings (A B C & D)
G) Loans On Manufactured Home Dwelling (A B C & D)
Number
Average Value
Number
Average Value
Number
Average Value
Number
Average Value
Number
Average Value
Number
Average Value
LOANS ORIGINATED
3
$83,187
29
$163,025
31
$117,375
27
$48,233
19
$222,636
6
$63,485
APPLICATIONS APPROVED, NOT ACCEPTED
0
$0
4
$114,568
5
$100,876
2
$109,470
1
$236,170
3
$64,417
APPLICATIONS DENIED
0
$0
9
$85,101
26
$179,618
14
$74,041
5
$161,152
6
$59,523
APPLICATIONS WITHDRAWN
0
$0
1
$114,620
15
$95,249
3
$139,367
1
$137,280
1
$61,690
FILES CLOSED FOR INCOMPLETENESS
0
$0
1
$165,600
4
$260,735
0
$0
0
$0
0
$0
Aggregated Statistics For Year 2006 (Based on 4 partial tracts)
A) FHA, FSA/RHS & VA Home Purchase Loans
B) Conventional Home Purchase Loans
C) Refinancings
D) Home Improvement Loans
F) Non-occupant Loans on < 5 Family Dwellings (A B C & D)
G) Loans On Manufactured Home Dwelling (A B C & D)
Number
Average Value
Number
Average Value
Number
Average Value
Number
Average Value
Number
Average Value
Number
Average Value
LOANS ORIGINATED
3
$107,653
32
$132,753
40
$113,754
23
$48,033
22
$166,047
6
$56,240
APPLICATIONS APPROVED, NOT ACCEPTED
0
$0
5
$119,194
5
$147,008
1
$44,860
3
$149,737
1
$70,090
APPLICATIONS DENIED
1
$106,560
7
$146,681
32
$124,111
15
$35,813
4
$134,158
6
$68,133
APPLICATIONS WITHDRAWN
0
$0
4
$109,138
19
$117,678
3
$47,590
2
$139,800
1
$77,490
FILES CLOSED FOR INCOMPLETENESS
0
$0
2
$108,985
6
$115,950
0
$0
1
$120,000
0
$0
Aggregated Statistics For Year 2005 (Based on 4 partial tracts)
A) FHA, FSA/RHS & VA Home Purchase Loans
B) Conventional Home Purchase Loans
C) Refinancings
D) Home Improvement Loans
F) Non-occupant Loans on < 5 Family Dwellings (A B C & D)
G) Loans On Manufactured Home Dwelling (A B C & D)
Number
Average Value
Number
Average Value
Number
Average Value
Number
Average Value
Number
Average Value
Number
Average Value
LOANS ORIGINATED
3
$71,570
30
$131,713
45
$111,789
25
$42,329
19
$168,182
6
$56,133
APPLICATIONS APPROVED, NOT ACCEPTED
0
$0
6
$84,427
8
$106,835
2
$54,900
2
$159,205
3
$72,737
APPLICATIONS DENIED
1
$35,220
9
$133,581
32
$86,963
14
$42,247
4
$161,930
6
$45,782
APPLICATIONS WITHDRAWN
0
$0
5
$167,802
24
$110,313
3
$104,323
2
$196,160
3
$56,963
FILES CLOSED FOR INCOMPLETENESS
0
$0
1
$59,040
8
$133,112
0
$0
1
$137,040
0
$0
Aggregated Statistics For Year 2004 (Based on 4 partial tracts)
A) FHA, FSA/RHS & VA Home Purchase Loans
B) Conventional Home Purchase Loans
C) Refinancings
D) Home Improvement Loans
F) Non-occupant Loans on < 5 Family Dwellings (A B C & D)
G) Loans On Manufactured Home Dwelling (A B C & D)
Number
Average Value
Number
Average Value
Number
Average Value
Number
Average Value
Number
Average Value
Number
Average Value
LOANS ORIGINATED
1
$124,760
30
$151,940
41
$104,626
21
$35,473
22
$170,983
3
$47,447
APPLICATIONS APPROVED, NOT ACCEPTED
0
$0
4
$118,378
8
$117,121
2
$18,515
3
$174,160
2
$40,835
APPLICATIONS DENIED
0
$0
6
$102,177
25
$81,013
10
$36,644
5
$128,522
4
$38,735
APPLICATIONS WITHDRAWN
0
$0
3
$125,023
23
$98,070
3
$46,227
2
$248,330
1
$69,630
FILES CLOSED FOR INCOMPLETENESS
0
$0
3
$100,193
4
$119,995
1
$29,250
1
$110,160
0
$0
Aggregated Statistics For Year 2003 (Based on 4 partial tracts)
A) FHA, FSA/RHS & VA Home Purchase Loans
B) Conventional Home Purchase Loans
C) Refinancings
D) Home Improvement Loans
F) Non-occupant Loans on < 5 Family Dwellings (A B C & D)
Number
Average Value
Number
Average Value
Number
Average Value
Number
Average Value
Number
Average Value
LOANS ORIGINATED
3
$84,840
28
$122,722
74
$91,828
15
$22,969
23
$146,566
APPLICATIONS APPROVED, NOT ACCEPTED
0
$0
1
$181,200
9
$80,998
1
$22,700
2
$186,240
APPLICATIONS DENIED
0
$0
7
$98,280
26
$72,386
4
$15,295
3
$139,977
APPLICATIONS WITHDRAWN
0
$0
3
$96,990
25
$76,400
3
$36,693
3
$86,853
FILES CLOSED FOR INCOMPLETENESS
0
$0
0
$0
3
$136,953
0
$0
0
$0
Aggregated Statistics For Year 2002 (Based on 4 partial tracts)
A) FHA, FSA/RHS & VA Home Purchase Loans
B) Conventional Home Purchase Loans
C) Refinancings
D) Home Improvement Loans
F) Non-occupant Loans on < 5 Family Dwellings (A B C & D)
Number
Average Value
Number
Average Value
Number
Average Value
Number
Average Value
Number
Average Value
LOANS ORIGINATED
2
$56,735
29
$102,226
51
$83,892
17
$21,736
15
$134,836
APPLICATIONS APPROVED, NOT ACCEPTED
0
$0
4
$99,675
6
$87,480
1
$20,240
2
$121,800
APPLICATIONS DENIED
2
$68,045
8
$77,691
20
$63,392
7
$14,406
3
$85,817
APPLICATIONS WITHDRAWN
0
$0
2
$113,910
20
$73,064
1
$19,940
2
$141,925
FILES CLOSED FOR INCOMPLETENESS
0
$0
1
$91,670
2
$55,645
0
$0
0
$0
Aggregated Statistics For Year 2001 (Based on 4 partial tracts)
A) FHA, FSA/RHS & VA Home Purchase Loans
B) Conventional Home Purchase Loans
C) Refinancings
D) Home Improvement Loans
F) Non-occupant Loans on < 5 Family Dwellings (A B C & D)
Number
Average Value
Number
Average Value
Number
Average Value
Number
Average Value
Number
Average Value
LOANS ORIGINATED
3
$64,493
30
$89,095
40
$79,160
16
$11,324
16
$116,220
APPLICATIONS APPROVED, NOT ACCEPTED
0
$0
6
$49,282
4
$77,968
1
$27,750
1
$101,280
APPLICATIONS DENIED
0
$0
11
$52,777
18
$61,564
7
$21,186
2
$72,170
APPLICATIONS WITHDRAWN
0
$0
3
$54,913
17
$56,564
3
$34,550
1
$83,280
FILES CLOSED FOR INCOMPLETENESS
0
$0
0
$0
3
$70,333
0
$0
0
$0
Aggregated Statistics For Year 2000 (Based on 4 partial tracts)
A) FHA, FSA/RHS & VA Home Purchase Loans
B) Conventional Home Purchase Loans
C) Refinancings
D) Home Improvement Loans
F) Non-occupant Loans on < 5 Family Dwellings (A B C & D)
Number
Average Value
Number
Average Value
Number
Average Value
Number
Average Value
Number
Average Value
LOANS ORIGINATED
3
$50,857
27
$90,316
22
$58,643
20
$21,614
15
$97,021
APPLICATIONS APPROVED, NOT ACCEPTED
0
$0
4
$84,765
3
$47,840
3
$19,847
1
$177,500
APPLICATIONS DENIED
1
$28,420
10
$45,616
13
$49,603
7
$21,720
2
$73,715
APPLICATIONS WITHDRAWN
0
$0
2
$38,830
7
$46,861
1
$7,870
1
$30,960
FILES CLOSED FOR INCOMPLETENESS
0
$0
0
$0
1
$60,970
0
$0
0
$0
Aggregated Statistics For Year 1999 (Based on 2 partial tracts)
A) FHA, FSA/RHS & VA Home Purchase Loans
B) Conventional Home Purchase Loans
C) Refinancings
D) Home Improvement Loans
F) Non-occupant Loans on < 5 Family Dwellings (A B C & D)
Detailed PMIC statistics for the following Tracts:0114.00
, 0115.00
2002 - 2018 National Fire Incident Reporting System (NFIRS) incidents
According to the data from the years 2002 - 2018 the average number of fires per year is 10. The highest number of fires - 18 took place in 2002, and the least - 4 in 2009. The data has a dropping trend.
When looking into fire subcategories, the most incidents belonged to: Structure Fires (57.5%), and Outside Fires (24.7%).
Fire incident types reported to NFIRS in Zip Code 13324


 Nearest zip codes: 13416, 13352, 13431, 13435, 13438, 13406.


 According to the data from the years 2002 - 2018 the average number of fires per year is 10. The highest number of fires - 18 took place in 2002, and the least - 4 in 2009. The data has a dropping trend.
 When looking into fire subcategories, the most incidents belonged to: Structure Fires (57.5%), and Outside Fires (24.7%).