Estimated zip code population in 2022: 650 Zip code population in 2010: 824 Zip code population in 2000: 724
Houses and condos: 345 Renter-occupied apartments: 46
% of renters here:
18%
State:
46%
March 2022 cost of living index in zip code 13361: 93.9 (less than average, U.S. average is 100)
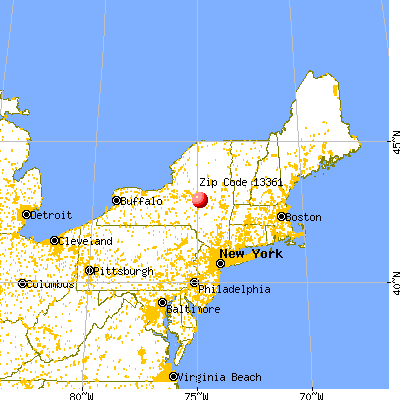
Land area: 28.3 sq. mi. Water area: 0.0 sq. mi.
Population density: 23 people per square mile
(very low).
OSM Map
General Map
Google Map
MSN Map
OSM Map
General Map
Google Map
MSN Map
OSM Map
General Map
Google Map
MSN Map
OSM Map
General Map
Google Map
MSN Map
Please wait while loading the map...
Real estate property taxes paid for housing units in 2022:
This zip code:
1.8% ($3,105)
New York:
1.5% ($6,180)
Median real estate property taxes paid for housing units with mortgages in 2022: $4,232 (2.0%) Median real estate property taxes paid for housing units with no mortgage in 2022: $2,286 (1.5%)
Business Search- 14 Million verified businesses
Males: 321
(49.5%)
Females: 328
(50.5%)
For population 25 years and over in 13361:
High school or higher: 87.3%
Bachelor's degree or higher: 35.3%
Graduate or professional degree: 16.4%
Unemployed: 1.7%
Mean travel time to work (commute): 31.2 minutes
For population 15 years and over in 13361:
Never married: 28.8%
Now married: 56.5%
Separated: 0.0%
Widowed: 4.4%
Divorced: 10.2%
Zip code 13361 compared to state average:
Median house value significantly below state average.
Unemployed percentage significantly below state average.
Black race population percentage significantly below state average.
Hispanic race population percentage significantly below state average.
Median age above state average.
Foreign-born population percentage significantly below state average.
Renting percentage significantly below state average.
Length of stay since moving in significantly above state average.
Estimated median house/condo value in 2022: $168,771
13361:
$168,771
New York:
$400,400
Median resident age:
This zip code:
46.2 years
New York median age:
40.0 years
Average household size:
This zip code:
2.6 people
New York:
2.5 people
Averages for the 2020 tax year for zip code 13361, filed in 2021:
Average Adjusted Gross Income (AGI) in 2020: $54,404 (Individual Income Tax Returns)
Here:
$54,404
State:
$90,930
Salary/wage: $49,050 (reported on 71.4% of returns)
Here:
$49,050
State:
$72,104
(% of AGI for various income ranges: 1168.0% for AGIs below $25k, 2902.0% for AGIs $25k-50k, 7716.7% for AGIs $50k-75k, 4797.5% for AGIs $75k-100k)
Taxable interest for individuals: $262 (reported on 28.6% of returns)
This zip code:
$262
New York:
$3,075
(% of AGI for various income ranges: 32.0% for AGIs $25k-50k, 12.5% for AGIs $75k-100k)
Ordinary dividends: $1,700 (reported on 14.3% of returns)
Here:
$1,700
State:
$11,095
(% of AGI for various income ranges: 40.0% for AGIs below $25k, 160.0% for AGIs $50k-75k)
Net capital gain/loss in AGI: +$10,120 (reported on 17.9% of returns)
Here:
+$10,120
State:
+$44,925
(% of AGI for various income ranges: 72.0% for AGIs below $25k, 1566.7% for AGIs $50k-75k)
Profit/loss from business: +$10,383 (reported on 21.4% of returns)
Here:
+$10,383
State:
+$14,940
(% of AGI for various income ranges: 926.0% for AGIs below $25k, 533.3% for AGIs $50k-75k)
Earned income credit: $1,820 (reported on 17.9% of returns)
Here:
$1,820
State:
$2,138
(% of AGI for various income ranges: 182.0% for AGIs below $25k)
Percentage of individuals using paid preparers for their 2020 taxes: 96.4%
Here:
96%
State:
95%
(% for various income ranges: 88.9% for AGIs below $25k, 100.0% for AGIs $25k-50k, 100.0% for AGIs $50k-75k, 100.0% for AGIs $75k-100k, 100.0% for AGIs $100k-200k)
Averages for the 2012 tax year for zip code 13361, filed in 2013:
Average Adjusted Gross Income (AGI) in 2012: $36,993 (Individual Income Tax Returns)
Here:
$36,993
State:
$77,088
Salary/wage: $37,565 (reported on 74.1% of returns)
Here:
$37,565
State:
$60,593
(% of AGI for various income ranges: 62.4% for AGIs below $25k, 69.7% for AGIs $25k-50k, 72.2% for AGIs $50k-75k, 85.4% for AGIs $75k-100k)
Taxable interest for individuals: $157 (reported on 25.9% of returns)
This zip code:
$157
New York:
$3,125
(% of AGI for various income ranges: 0.3% for AGIs below $25k, 0.2% for AGIs $25k-50k)
Ordinary dividends: $700 (reported on 14.8% of returns)
Here:
$700
State:
$10,299
Net capital gain/loss in AGI: +$2,200 (reported on 11.1% of returns)
Here:
+$2,200
State:
+$42,474
Profit/loss from business: +$12,925 (reported on 14.8% of returns)
Here:
+$12,925
State:
+$16,168
Total itemized deductions: $19,220 (25% of AGI, reported on 18.5% of returns)
Here:
$19,220
State:
$34,985
Here:
25.2% of AGI
State:
21.3% of AGI
Charity contributions: $2,050 (reported on 7.4% of returns)
Here:
$2,050
State:
$5,572
Taxes paid: $6,540 (reported on 18.5% of returns)
13361:
$6,540
State:
$18,656
Earned income credit: $2,240 (reported on 18.5% of returns)
Here:
$2,240
State:
$2,230
(% of AGI for various income ranges: 7.3% for AGIs below $25k)
Percentage of individuals using paid preparers for their 2012 taxes: 55.6%
Here:
56%
State:
66%
(% for various income ranges: 58.3% for AGIs below $25k, 57.1% for AGIs $25k-50k, 50.0% for AGIs $50k-75k, 50.0% for AGIs $75k-100k)
Averages for the 2004 tax year for zip code 13361, filed in 2005:
Average Adjusted Gross Income (AGI) in 2004: $29,390 (Individual Income Tax Returns)
Here:
$29,390
State:
$59,519
Salary/wage: $28,701 (reported on 81.7% of returns)
Here:
$28,701
State:
$50,673
(% of AGI for various income ranges: 106.4% for AGIs below $10k, 59.8% for AGIs $10k-25k, 75.6% for AGIs $25k-50k, 91.8% for AGIs $50k-75k, 83.1% for AGIs $75k-100k)
Taxable interest for individuals: $769 (reported on 37.8% of returns)
This zip code:
$769
New York:
$2,377
(% of AGI for various income ranges: 2.9% for AGIs below $10k, 1.0% for AGIs $10k-25k, 1.9% for AGIs $25k-50k, 0.3% for AGIs $50k-75k)
Taxable dividends: $763 (reported on 15.8% of returns)
Here:
$763
State:
$5,394
Net capital gain/loss: +$5,816 (reported on 15.8% of returns)
Here:
+$5,816
State:
+$23,581
Profit/loss from business: +$6,550 (reported on 16.6% of returns)
Here:
+$6,550
State:
+$13,809
Profit/loss from farming: +$308 (reported on 10.8% of returns)
Here:
+$308
State:
-$2,666
IRA payment deduction: $1,300 (reported on 4.1% of returns)
13361:
$1,300
New York:
$3,115
Total itemized deductions: $13,593 (26% of AGI, reported on 11.2% of returns)
Here:
$13,593
State:
$25,864
Here:
25.8% of AGI
State:
21.9% of AGI
Charity contributions deductions: $1,526 (3% of AGI, reported on 7.9% of returns)
Here:
$1,526
State:
$4,439
Here:
2.7% of AGI
State:
3.6% of AGI
Total tax: $2,536 (reported on 69.7% of returns)
13361:
$2,536
State:
$11,730
(% of AGI for various income ranges: 1.8% for AGIs below $10k, 4.0% for AGIs $10k-25k, 5.5% for AGIs $25k-50k, 6.5% for AGIs $50k-75k, 9.0% for AGIs $75k-100k)
Earned income credit: $1,528 (reported on 14.9% of returns)
Here:
$1,528
State:
$1,757
Percentage of individuals using paid preparers for their 2004 taxes: 59.8%
Here:
60%
State:
67%
(% for various income ranges: 50.0% for AGIs below $10k, 53.7% for AGIs $10k-25k, 68.1% for AGIs $25k-50k, 91.4% for AGIs $50k-75k)
Household received Food Stamps/SNAP in the past 12 months: 20 Household did not receive Food Stamps/SNAP in the past 12 months: 230
Women who had a birth in the past 12 months: 26 (26 now married, 0 unmarried) Women who did not have a birth in the past 12 months: 117 (38 now married, 78 unmarried)
Housing units in zip code 13361 with a mortgage: 100 (7 second mortgage, 4 both second mortgage and home equity loan) Houses without a mortgage: 7
Median monthly owner costs for units with a mortgage: $1,563 Median monthly owner costs for units without a mortgage: $573
Residents with income below the poverty level in 2022:
This zip code:
14.3%
Whole state:
14.3%
Residents with income below 50% of the poverty level in 2022:
This zip code:
6.9%
Whole state:
6.8%
Median number of rooms in houses and condos:
Here:
6.5
State:
6.3
Median number of rooms in apartments:
Here:
6.0
State:
3.8
Notable locations in this zip code not listed on our city pages
Size of family households: 90 2-persons, 34 3-persons, 39 4-persons, 11 5-persons, 2 6-persons
Size of nonfamily households: 46 1-person, 24 2-persons, 3 3-persons
78 married couples with children.
15 single-parent households (15 men).
83.9% of residents of 13361 zip code speak English at home.
2.0% of residents speak Spanish at home (83% very well, 17% well).
13.2% of residents speak other Indo-European language at home (48% very well, 51% well, 1% not well).
Foreign born population: 25 (3.9%) (35.8% of them are naturalized citizens)
This zip code:
3.9%
Whole state:
22.7%
24%Dominica
20%Chile
12%Guyana
8%Belarus
8%Serbia
4%Sweden
4%United Kingdom, excluding England and Scotland
30%English
14%Pennsylvania German
12%American
9%German
6%Polish
6%Swiss
5%Irish
Year of entry for the foreign-born population
92010 or later
02000 to 2009
141990 to 1999
6Before 1990
Facilities with environmental interests located in this zip code:
HANSON - JORDANVILLE QUARRY (COUNTY RD #155 in JORDANVILLE, NY)
AIR SYNTHETIC MINOR (AIRS/AFS) STATE MASTER (New York facility tracking) - MINE OPERATING PERMIT, AIR PROGRAM, National Pollutant Discharge Elimination System Permit, SECTION 404 PERMITTING, 401 CERTIFICATION, MINE OPERATING PERMIT, National Pollutant Discharge Elimination System Permit Business SIC and NAICS classification: CRUSHED AND BROKEN LIMESTONE Organizations: HANSON AGGREGATES NEW YORK INC (LEGALLY RESPONSIBLE PARTY)
, EASTERN ROCK PRODUCTS INC (LEGALLY RESPONSIBLE PARTY)
Alternative names: EASTERN ROCK PROD, HANSON - JORDONVILLE QUARRY
HANSON JORDANVILLE (KINGDOM RD 5 MI N ST RTE 167 in JORDANVILLE, NY)
(Resource Conservation and Recovery Act (tracking hazardous waste)) Organizations: HANSON AGGREGATES NY INC (CONTACT/OWNER)
Housing units lacking complete plumbing facilities: 7.0% Housing units lacking complete kitchen facilities: 5.4%
33.1%Fuel oil, kerosene, etc.
29.4%Wood
17.2%Bottled, tank, or LP gas
9.8%Coal or coke
4.5%Other fuel
3.7%Utility gas
3.7%Electricity
Population in 1990: 395. Population change in the 1990s: +329 (+83.3%).
Place of birth for U.S.-born residents:
This state: 419
Northeast: 76
Midwest: 44
South: 70
West: 7
70% of the 13361 zip code residents lived in the same house 5 years ago. Out of people who lived in different houses, 55% lived in this county. Out of people who lived in different counties, 50% lived in New York.
91% of the 13361 zip code residents lived in the same house 1 year ago. Out of people who lived in different houses, 12% moved from this county. Out of people who lived in different houses, 48% moved from different county within same state. Out of people who lived in different houses, 40% moved from different state.
Private vs. public school enrollment:
Students in private schools in grades 1 to 8 (elementary and middle school): 9
Here:
43.6%
New York:
15.6%
Students in private schools in grades 9 to 12 (high school): 10
Here:
22.8%
New York:
15.0%
Students in private undergraduate colleges: 1
Here:
14.1%
New York:
39.2%
Occupation by median earnings in the past 12 months ($)
58,151Office and administrative support occupations
54,550Management occupations
54,050Business and financial operations occupations
45,709Sales and related occupations
43,974Installation, maintenance, and repair occupations
27,479Education, training, and library occupations
Top industries in this zip code by the number of employees in 2005:
Other Services (except Public Administration): Religious Organizations (10-19 employees: 1 establishment)
Mining: Crushed and Broken Limestone Mining and Quarrying (10-19: 1)
Professional, Scientific, and Technical Services: Administrative Management and General Management Consulting Services (1-4: 1)
Construction: New Housing Operative Builders (1-4: 1)
Finance and Insurance: Direct Property and Casualty Insurance Carriers (1-4: 1)
Information: Libraries and Archives (1-4: 1)
People in group quarters in 2010:
28 people in other noninstitutional facilities
20 people in college/university student housing
Home Mortgage Disclosure Act Aggregated Statistics For Year 2009 (Based on 2 partial tracts)
A) FHA, FSA/RHS & VA Home Purchase Loans
B) Conventional Home Purchase Loans
C) Refinancings
D) Home Improvement Loans
F) Non-occupant Loans on < 5 Family Dwellings (A B C & D)
G) Loans On Manufactured Home Dwelling (A B C & D)
Number
Average Value
Number
Average Value
Number
Average Value
Number
Average Value
Number
Average Value
Number
Average Value
LOANS ORIGINATED
2
$89,265
4
$95,378
10
$89,081
4
$21,205
1
$72,600
1
$102,970
APPLICATIONS APPROVED, NOT ACCEPTED
0
$0
0
$0
1
$92,970
0
$0
0
$0
0
$0
APPLICATIONS DENIED
1
$58,520
0
$0
9
$133,756
3
$13,580
0
$0
1
$73,340
APPLICATIONS WITHDRAWN
0
$0
0
$0
7
$112,707
1
$106,300
0
$0
0
$0
FILES CLOSED FOR INCOMPLETENESS
0
$0
0
$0
1
$144,830
0
$0
0
$0
0
$0
Aggregated Statistics For Year 2008 (Based on 2 partial tracts)
A) FHA, FSA/RHS & VA Home Purchase Loans
B) Conventional Home Purchase Loans
C) Refinancings
D) Home Improvement Loans
F) Non-occupant Loans on < 5 Family Dwellings (A B C & D)
G) Loans On Manufactured Home Dwelling (A B C & D)
Number
Average Value
Number
Average Value
Number
Average Value
Number
Average Value
Number
Average Value
Number
Average Value
LOANS ORIGINATED
1
$75,190
4
$98,340
12
$86,766
7
$36,299
1
$46,670
2
$47,040
APPLICATIONS APPROVED, NOT ACCEPTED
0
$0
1
$111,120
3
$133,097
1
$61,490
0
$0
1
$111,120
APPLICATIONS DENIED
0
$0
1
$78,900
14
$122,074
6
$21,298
1
$54,820
2
$55,930
APPLICATIONS WITHDRAWN
0
$0
0
$0
5
$122,380
1
$16,670
0
$0
0
$0
FILES CLOSED FOR INCOMPLETENESS
0
$0
0
$0
1
$177,790
0
$0
0
$0
0
$0
Aggregated Statistics For Year 2007 (Based on 2 partial tracts)
B) Conventional Home Purchase Loans
C) Refinancings
D) Home Improvement Loans
F) Non-occupant Loans on < 5 Family Dwellings (A B C & D)
G) Loans On Manufactured Home Dwelling (A B C & D)
Number
Average Value
Number
Average Value
Number
Average Value
Number
Average Value
Number
Average Value
LOANS ORIGINATED
6
$110,873
16
$83,919
8
$30,558
0
$0
3
$52,227
APPLICATIONS APPROVED, NOT ACCEPTED
1
$92,230
3
$66,920
2
$49,820
0
$0
1
$34,820
APPLICATIONS DENIED
2
$87,970
17
$118,615
10
$30,780
1
$94,820
4
$70,282
APPLICATIONS WITHDRAWN
1
$93,710
6
$136,925
0
$0
0
$0
0
$0
FILES CLOSED FOR INCOMPLETENESS
0
$0
1
$110,750
0
$0
0
$0
0
$0
Aggregated Statistics For Year 2006 (Based on 2 partial tracts)
A) FHA, FSA/RHS & VA Home Purchase Loans
B) Conventional Home Purchase Loans
C) Refinancings
D) Home Improvement Loans
G) Loans On Manufactured Home Dwelling (A B C & D)
Number
Average Value
Number
Average Value
Number
Average Value
Number
Average Value
Number
Average Value
LOANS ORIGINATED
1
$115,560
6
$95,563
18
$60,622
9
$26,833
2
$59,265
APPLICATIONS APPROVED, NOT ACCEPTED
0
$0
2
$74,820
2
$62,040
1
$47,410
1
$40,370
APPLICATIONS DENIED
0
$0
3
$61,487
14
$105,961
11
$30,238
3
$51,240
APPLICATIONS WITHDRAWN
0
$0
1
$117,420
9
$114,166
2
$60,190
0
$0
FILES CLOSED FOR INCOMPLETENESS
0
$0
0
$0
1
$179,640
1
$38,890
0
$0
Aggregated Statistics For Year 2005 (Based on 2 partial tracts)
A) FHA, FSA/RHS & VA Home Purchase Loans
B) Conventional Home Purchase Loans
C) Refinancings
D) Home Improvement Loans
F) Non-occupant Loans on < 5 Family Dwellings (A B C & D)
G) Loans On Manufactured Home Dwelling (A B C & D)
Number
Average Value
Number
Average Value
Number
Average Value
Number
Average Value
Number
Average Value
Number
Average Value
LOANS ORIGINATED
1
$135,200
7
$76,726
15
$68,401
9
$32,472
1
$77,040
4
$58,800
APPLICATIONS APPROVED, NOT ACCEPTED
0
$0
2
$101,305
4
$60,838
2
$17,780
0
$0
1
$68,150
APPLICATIONS DENIED
0
$0
4
$70,190
17
$90,378
8
$30,280
2
$70,560
3
$53,337
APPLICATIONS WITHDRAWN
0
$0
1
$94,450
11
$102,062
1
$175,570
1
$140,750
0
$0
FILES CLOSED FOR INCOMPLETENESS
0
$0
0
$0
1
$94,450
0
$0
0
$0
0
$0
Aggregated Statistics For Year 2004 (Based on 2 partial tracts)
A) FHA, FSA/RHS & VA Home Purchase Loans
B) Conventional Home Purchase Loans
C) Refinancings
D) Home Improvement Loans
F) Non-occupant Loans on < 5 Family Dwellings (A B C & D)
G) Loans On Manufactured Home Dwelling (A B C & D)
Number
Average Value
Number
Average Value
Number
Average Value
Number
Average Value
Number
Average Value
Number
Average Value
LOANS ORIGINATED
1
$108,900
7
$78,790
9
$82,064
8
$23,659
1
$37,410
3
$25,680
APPLICATIONS APPROVED, NOT ACCEPTED
0
$0
1
$167,420
2
$67,230
0
$0
0
$0
0
$0
APPLICATIONS DENIED
0
$0
2
$58,895
13
$91,973
8
$18,104
0
$0
4
$50,098
APPLICATIONS WITHDRAWN
0
$0
0
$0
12
$83,217
1
$37,040
0
$0
1
$27,780
FILES CLOSED FOR INCOMPLETENESS
0
$0
1
$68,150
1
$73,340
1
$23,710
0
$0
0
$0
Aggregated Statistics For Year 2003 (Based on 2 partial tracts)
A) FHA, FSA/RHS & VA Home Purchase Loans
B) Conventional Home Purchase Loans
C) Refinancings
D) Home Improvement Loans
F) Non-occupant Loans on < 5 Family Dwellings (A B C & D)
Number
Average Value
Number
Average Value
Number
Average Value
Number
Average Value
Number
Average Value
LOANS ORIGINATED
1
$100,010
8
$79,080
26
$70,632
3
$21,483
1
$125,570
APPLICATIONS APPROVED, NOT ACCEPTED
0
$0
2
$60,375
7
$89,001
0
$0
0
$0
APPLICATIONS DENIED
0
$0
6
$56,857
22
$71,201
3
$33,090
0
$0
APPLICATIONS WITHDRAWN
0
$0
0
$0
10
$74,562
0
$0
0
$0
FILES CLOSED FOR INCOMPLETENESS
0
$0
1
$41,480
1
$127,790
0
$0
0
$0
Aggregated Statistics For Year 2002 (Based on 2 partial tracts)
A) FHA, FSA/RHS & VA Home Purchase Loans
B) Conventional Home Purchase Loans
C) Refinancings
D) Home Improvement Loans
F) Non-occupant Loans on < 5 Family Dwellings (A B C & D)
Number
Average Value
Number
Average Value
Number
Average Value
Number
Average Value
Number
Average Value
LOANS ORIGINATED
1
$54,820
4
$73,988
24
$53,600
7
$14,234
0
$0
APPLICATIONS APPROVED, NOT ACCEPTED
0
$0
0
$0
6
$62,598
1
$15,930
0
$0
APPLICATIONS DENIED
0
$0
2
$26,855
17
$62,663
4
$8,428
1
$40,370
APPLICATIONS WITHDRAWN
0
$0
0
$0
9
$59,634
1
$19,630
0
$0
FILES CLOSED FOR INCOMPLETENESS
0
$0
1
$48,890
1
$103,340
0
$0
0
$0
Aggregated Statistics For Year 2001 (Based on 2 partial tracts)
B) Conventional Home Purchase Loans
C) Refinancings
D) Home Improvement Loans
F) Non-occupant Loans on < 5 Family Dwellings (A B C & D)
Number
Average Value
Number
Average Value
Number
Average Value
Number
Average Value
LOANS ORIGINATED
7
$51,327
16
$54,472
9
$14,733
1
$3,330
APPLICATIONS APPROVED, NOT ACCEPTED
1
$41,480
2
$51,485
1
$34,080
0
$0
APPLICATIONS DENIED
2
$71,115
16
$57,528
7
$24,923
1
$23,710
APPLICATIONS WITHDRAWN
1
$20,000
11
$68,726
0
$0
0
$0
FILES CLOSED FOR INCOMPLETENESS
0
$0
1
$110,010
0
$0
0
$0
Aggregated Statistics For Year 2000 (Based on 2 partial tracts)
A) FHA, FSA/RHS & VA Home Purchase Loans
B) Conventional Home Purchase Loans
C) Refinancings
D) Home Improvement Loans
Number
Average Value
Number
Average Value
Number
Average Value
Number
Average Value
LOANS ORIGINATED
1
$58,890
8
$66,440
11
$51,721
4
$27,965
APPLICATIONS APPROVED, NOT ACCEPTED
0
$0
1
$41,480
3
$37,903
1
$28,150
APPLICATIONS DENIED
0
$0
3
$34,200
9
$62,886
6
$23,273
APPLICATIONS WITHDRAWN
0
$0
1
$24,450
4
$63,802
0
$0
FILES CLOSED FOR INCOMPLETENESS
0
$0
0
$0
2
$55,560
0
$0
Aggregated Statistics For Year 1999 (Based on 1 partial tract)


+$308
-$2,666
 Nearest zip codes: 13475, 13468, 13333, 13407, 13439, 13320.


