Estimated zip code population in 2022: 2,237 Zip code population in 2010: 2,725 Zip code population in 2000: 2,744
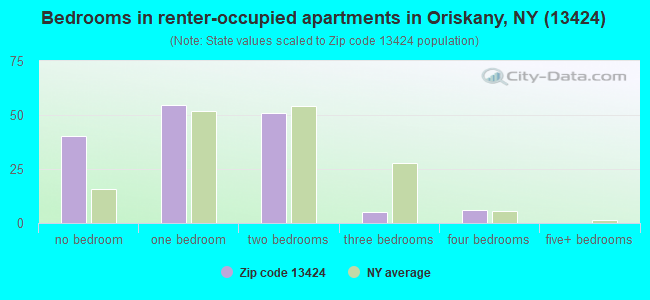
Houses and condos: 1,002 Renter-occupied apartments: 154
% of renters here:
16%
State:
46%
March 2022 cost of living index in zip code 13424: 100.2 (near average, U.S. average is 100)
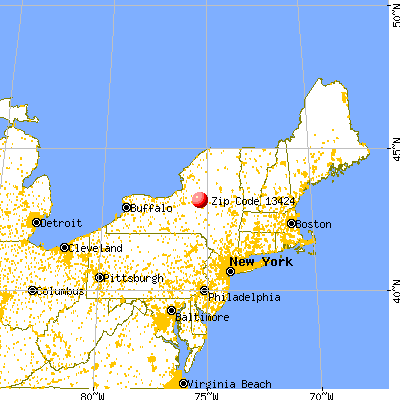
Land area: 11.1 sq. mi. Water area: 0.0 sq. mi.
Population density: 201 people per square mile
(very low).
OSM Map
General Map
Google Map
MSN Map
OSM Map
General Map
Google Map
MSN Map
OSM Map
General Map
Google Map
MSN Map
OSM Map
General Map
Google Map
MSN Map
Please wait while loading the map...
Real estate property taxes paid for housing units in 2022:
This zip code:
2.4% ($4,398)
New York:
1.5% ($6,180)
Median real estate property taxes paid for housing units with mortgages in 2022: $5,022 (2.6%) Median real estate property taxes paid for housing units with no mortgage in 2022: $3,567 (2.1%)
Business Search- 14 Million verified businesses
Males: 1,250
(55.9%)
Females: 987
(44.1%)
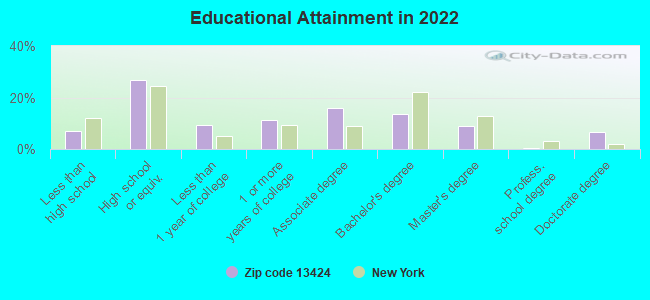
For population 25 years and over in 13424:
High school or higher: 92.3%
Bachelor's degree or higher: 29.5%
Graduate or professional degree: 16.1%
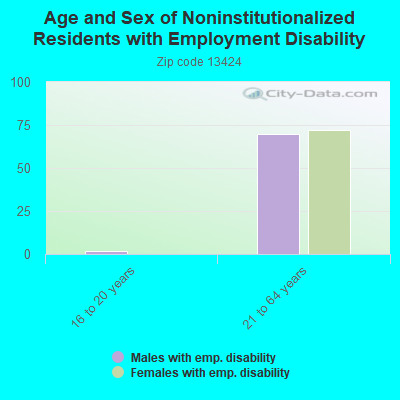
Unemployed: 1.2%
Mean travel time to work (commute): 17.5 minutes
For population 15 years and over in 13424:
Never married: 31.9%
Now married: 51.8%
Separated: 0.6%
Widowed: 6.4%
Divorced: 9.2%
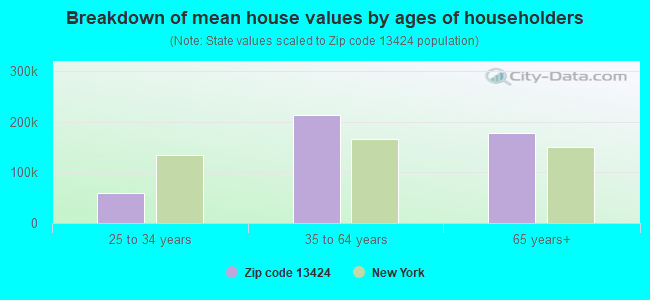
Zip code 13424 compared to state average:
Median house value below state average.
Unemployed percentage significantly below state average.
Black race population percentage significantly below state average.
Hispanic race population percentage significantly below state average.
Foreign-born population percentage significantly below state average.
Renting percentage significantly below state average.
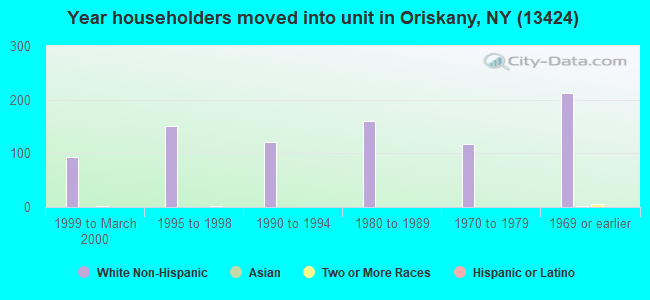
Length of stay since moving in significantly above state average.
Averages for the 2020 tax year for zip code 13424, filed in 2021:
Average Adjusted Gross Income (AGI) in 2020: $61,121 (Individual Income Tax Returns)
Here:
$61,121
State:
$90,930
Salary/wage: $52,473 (reported on 80.7% of returns)
Here:
$52,473
State:
$72,104
(% of AGI for various income ranges: 1165.8% for AGIs below $25k, 3532.8% for AGIs $25k-50k, 6085.3% for AGIs $50k-75k, 8097.5% for AGIs $75k-100k, 15753.6% for AGIs $100k-200k)
Taxable interest for individuals: $869 (reported on 44.7% of returns)
This zip code:
$869
New York:
$3,075
(% of AGI for various income ranges: 16.3% for AGIs below $25k, 12.8% for AGIs $25k-50k, 77.3% for AGIs $50k-75k, 50.0% for AGIs $75k-100k, 203.6% for AGIs $100k-200k)
Ordinary dividends: $2,854 (reported on 22.8% of returns)
Here:
$2,854
State:
$11,095
(% of AGI for various income ranges: 12.6% for AGIs below $25k, 43.2% for AGIs $25k-50k, 70.7% for AGIs $50k-75k, 103.8% for AGIs $75k-100k, 382.7% for AGIs $100k-200k)
Net capital gain/loss in AGI: +$6,720 (reported on 17.5% of returns)
Here:
+$6,720
State:
+$44,925
(% of AGI for various income ranges: 16.8% for AGIs below $25k, 32.0% for AGIs $25k-50k, 58.0% for AGIs $50k-75k, 83.8% for AGIs $75k-100k, 980.0% for AGIs $100k-200k)
Profit/loss from business: +$6,336 (reported on 9.6% of returns)
Here:
+$6,336
State:
+$14,940
(% of AGI for various income ranges: 62.1% for AGIs below $25k, 30.4% for AGIs $25k-50k, 45.3% for AGIs $50k-75k, 395.5% for AGIs $100k-200k)
Taxable individual retirement arrangement distribution: $12,338 (reported on 11.4% of returns)
13424:
$12,338
New York:
$19,609
(% of AGI for various income ranges: 94.2% for AGIs below $25k, 94.0% for AGIs $25k-50k, 432.7% for AGIs $50k-75k, 491.8% for AGIs $100k-200k)
Total itemized deductions: $23,233 (reported on 2.6% of returns)
Here:
$23,233
State:
$39,326
(% of AGI for various income ranges: 871.2% for AGIs $75k-100k)
Charity contributions: $3,050 (reported on 1.8% of returns)
Here:
$3,050
State:
$15,420
(% of AGI for various income ranges: 24.4% for AGIs $25k-50k)
Taxes paid: $8,833 (reported on 2.6% of returns)
13424:
$8,833
State:
$9,183
(% of AGI for various income ranges: 331.2% for AGIs $75k-100k)
Earned income credit: $1,925 (reported on 10.5% of returns)
Here:
$1,925
State:
$2,138
(% of AGI for various income ranges: 58.9% for AGIs below $25k, 47.6% for AGIs $25k-50k)
Percentage of individuals using paid preparers for their 2020 taxes: 93.9%
Here:
94%
State:
95%
(% for various income ranges: 86.7% for AGIs below $25k, 96.8% for AGIs $25k-50k, 95.2% for AGIs $50k-75k, 100.0% for AGIs $75k-100k, 94.7% for AGIs $100k-200k, 100.0% for AGIs over 200k)
Averages for the 2012 tax year for zip code 13424, filed in 2013:
Average Adjusted Gross Income (AGI) in 2012: $51,417 (Individual Income Tax Returns)
Here:
$51,417
State:
$77,088
Salary/wage: $44,338 (reported on 83.5% of returns)
Here:
$44,338
State:
$60,593
(% of AGI for various income ranges: 73.3% for AGIs below $25k, 75.2% for AGIs $25k-50k, 72.9% for AGIs $50k-75k, 75.3% for AGIs $75k-100k, 68.2% for AGIs $100k-200k)
Taxable interest for individuals: $630 (reported on 48.6% of returns)
This zip code:
$630
New York:
$3,125
(% of AGI for various income ranges: 0.8% for AGIs below $25k, 1.1% for AGIs $25k-50k, 0.4% for AGIs $50k-75k, 0.4% for AGIs $75k-100k, 0.5% for AGIs $100k-200k)
Ordinary dividends: $2,315 (reported on 24.8% of returns)
Here:
$2,315
State:
$10,299
(% of AGI for various income ranges: 1.4% for AGIs below $25k, 1.2% for AGIs $25k-50k, 0.8% for AGIs $50k-75k, 1.4% for AGIs $75k-100k, 1.1% for AGIs $100k-200k)
Net capital gain/loss in AGI: +$1,767 (reported on 13.8% of returns)
Here:
+$1,767
State:
+$42,474
(% of AGI for various income ranges: 0.1% for AGIs $75k-100k, 1.4% for AGIs $100k-200k)
Profit/loss from business: +$8,575 (reported on 11.0% of returns)
Here:
+$8,575
State:
+$16,168
(% of AGI for various income ranges: 3.5% for AGIs $25k-50k, 1.1% for AGIs $50k-75k, 5.9% for AGIs $75k-100k)
Taxable individual retirement arrangement distribution: $10,992 (reported on 11.0% of returns)
13424:
$10,992
New York:
$17,621
(% of AGI for various income ranges: 3.9% for AGIs below $25k, 2.2% for AGIs $25k-50k, 2.9% for AGIs $50k-75k, 6.4% for AGIs $75k-100k)
Total itemized deductions: $19,459 (22% of AGI, reported on 29.4% of returns)
Here:
$19,459
State:
$34,985
Here:
21.6% of AGI
State:
21.3% of AGI
(% of AGI for various income ranges: 11.7% for AGIs below $25k, 8.4% for AGIs $25k-50k, 8.3% for AGIs $50k-75k, 12.4% for AGIs $75k-100k, 13.2% for AGIs $100k-200k)
Charity contributions: $2,262 (reported on 23.9% of returns)
Here:
$2,262
State:
$5,572
(% of AGI for various income ranges: 1.3% for AGIs $25k-50k, 0.9% for AGIs $50k-75k, 1.0% for AGIs $75k-100k, 1.3% for AGIs $100k-200k)
Taxes paid: $9,181 (reported on 28.4% of returns)
13424:
$9,181
State:
$18,656
(% of AGI for various income ranges: 2.2% for AGIs below $25k, 2.6% for AGIs $25k-50k, 3.6% for AGIs $50k-75k, 5.9% for AGIs $75k-100k, 7.3% for AGIs $100k-200k)
Earned income credit: $2,083 (reported on 11.0% of returns)
Here:
$2,083
State:
$2,230
(% of AGI for various income ranges: 3.7% for AGIs below $25k, 0.7% for AGIs $25k-50k)
Percentage of individuals using paid preparers for their 2012 taxes: 48.6%
Here:
49%
State:
66%
(% for various income ranges: 40.5% for AGIs below $25k, 46.4% for AGIs $25k-50k, 50.0% for AGIs $50k-75k, 54.5% for AGIs $75k-100k, 66.7% for AGIs $100k-200k)
Averages for the 2004 tax year for zip code 13424, filed in 2005:
Average Adjusted Gross Income (AGI) in 2004: $38,228 (Individual Income Tax Returns)
Here:
$38,228
State:
$59,519
Salary/wage: $34,523 (reported on 84.0% of returns)
Here:
$34,523
State:
$50,673
(% of AGI for various income ranges: 210.8% for AGIs below $10k, 72.4% for AGIs $10k-25k, 81.3% for AGIs $25k-50k, 80.1% for AGIs $50k-75k, 77.7% for AGIs $75k-100k, 57.2% for AGIs over 100k)
Taxable interest for individuals: $793 (reported on 57.0% of returns)
This zip code:
$793
New York:
$2,377
(% of AGI for various income ranges: 9.3% for AGIs below $10k, 2.5% for AGIs $10k-25k, 1.2% for AGIs $25k-50k, 0.8% for AGIs $50k-75k, 0.8% for AGIs $75k-100k, 0.9% for AGIs over 100k)
Taxable dividends: $1,418 (reported on 28.3% of returns)
Here:
$1,418
State:
$5,394
(% of AGI for various income ranges: 3.1% for AGIs below $10k, 1.9% for AGIs $10k-25k, 0.9% for AGIs $25k-50k, 0.7% for AGIs $50k-75k, 0.6% for AGIs $75k-100k, 1.7% for AGIs over 100k)
Net capital gain/loss: +$1,052 (reported on 17.2% of returns)
Here:
+$1,052
State:
+$23,581
(% of AGI for various income ranges: 2.6% for AGIs below $10k, -0.6% for AGIs $10k-25k, 0.6% for AGIs $25k-50k, 0.4% for AGIs $50k-75k, 0.3% for AGIs $75k-100k, 1.2% for AGIs over 100k)
Profit/loss from business: +$4,959 (reported on 10.9% of returns)
Here:
+$4,959
State:
+$13,809
(% of AGI for various income ranges: 2.8% for AGIs below $10k, -0.3% for AGIs $10k-25k, 1.7% for AGIs $25k-50k, 0.6% for AGIs $50k-75k, 0.8% for AGIs $75k-100k, 3.7% for AGIs over 100k)
IRA payment deduction: $2,762 (reported on 1.9% of returns)
13424:
$2,762
New York:
$3,115
Total itemized deductions: $15,253 (21% of AGI, reported on 26.3% of returns)
Here:
$15,253
State:
$25,864
Here:
20.8% of AGI
State:
21.9% of AGI
(% of AGI for various income ranges: 5.8% for AGIs $10k-25k, 8.4% for AGIs $25k-50k, 11.1% for AGIs $50k-75k, 13.5% for AGIs $75k-100k, 12.6% for AGIs over 100k)
Charity contributions deductions: $2,189 (3% of AGI, reported on 24.0% of returns)
Here:
$2,189
State:
$4,439
Here:
2.9% of AGI
State:
3.6% of AGI
(% of AGI for various income ranges: 0.2% for AGIs $10k-25k, 1.0% for AGIs $25k-50k, 1.6% for AGIs $50k-75k, 1.6% for AGIs $75k-100k, 2.1% for AGIs over 100k)
Total tax: $4,901 (reported on 76.3% of returns)
13424:
$4,901
State:
$11,730
(% of AGI for various income ranges: 4.4% for AGIs below $10k, 4.3% for AGIs $10k-25k, 6.7% for AGIs $25k-50k, 8.1% for AGIs $50k-75k, 10.5% for AGIs $75k-100k, 18.6% for AGIs over 100k)
Earned income credit: $1,577 (reported on 10.9% of returns)
Here:
$1,577
State:
$1,757
Percentage of individuals using paid preparers for their 2004 taxes: 57.7%
Here:
58%
State:
67%
(% for various income ranges: 47.2% for AGIs below $10k, 56.2% for AGIs $10k-25k, 58.6% for AGIs $25k-50k, 66.3% for AGIs $50k-75k, 61.2% for AGIs $75k-100k, 68.5% for AGIs over 100k)
Household received Food Stamps/SNAP in the past 12 months: 23 Household did not receive Food Stamps/SNAP in the past 12 months: 901
Women who had a birth in the past 12 months: 15 (10 now married, 5 unmarried) Women who did not have a birth in the past 12 months: 446 (196 now married, 248 unmarried)
Housing units in zip code 13424 with a mortgage: 463 (29 second mortgage, 3 home equity loan, 26 both second mortgage and home equity loan) Houses without a mortgage: 23
Median monthly owner costs for units with a mortgage: $1,520 Median monthly owner costs for units without a mortgage: $615
Residents with income below the poverty level in 2022:
This zip code:
9.2%
Whole state:
14.3%
Residents with income below 50% of the poverty level in 2022:
This zip code:
3.5%
Whole state:
6.8%
Median number of rooms in houses and condos:
Here:
6.4
State:
6.3
Median number of rooms in apartments:
Here:
4.1
State:
3.8
Notable locations in this zip code not listed on our city pages
Notable locations in zip code 13424: Shamrock Golf and Country Club (A), Oriskany Hills Golf Club (B), Eastern Star Nursing Home and Infirmary (C), Oriskany Public Library (D), Oriskany Fire Department (E). Display/hide their locations on the map
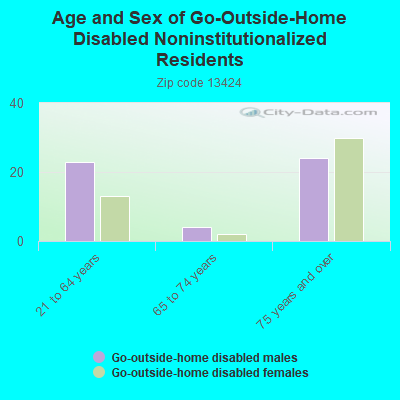
In group quarters: 372 (-1 institutionalized population)
Size of family households: 335 2-persons, 114 3-persons, 97 4-persons, 22 5-persons, 14 6-persons, 2 7-or-more-persons
Size of nonfamily households: 301 1-person, 55 2-persons
295 married couples with children.
34 single-parent households (4 men, 30 women).
89.2% of residents of 13424 zip code speak English at home.
2.8% of residents speak Spanish at home (78% very well, 22% well).
1.8% of residents speak other Indo-European language at home (85% very well, 15% well).
6.1% of residents speak Asian or Pacific Island language at home (93% very well, 7% well).
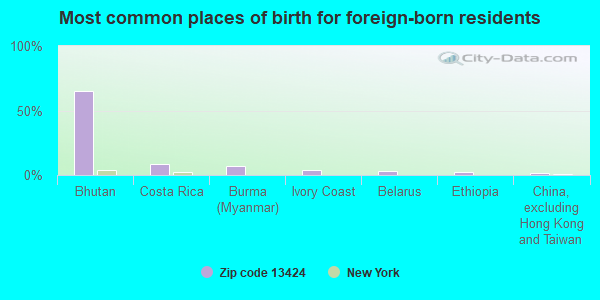
Foreign born population: 152 (6.8%) (21.2% of them are naturalized citizens)
This zip code:
6.8%
Whole state:
22.7%
65%Bhutan
8%Costa Rica
7%Burma (Myanmar)
4%Ivory Coast
3%Belarus
2%Ethiopia
1%China, excluding Hong Kong and Taiwan
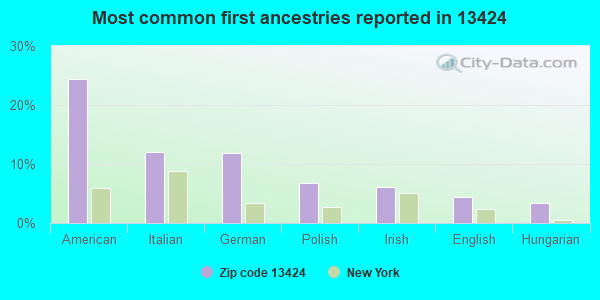
24%American
12%Italian
12%German
7%Polish
6%Irish
4%English
3%Hungarian
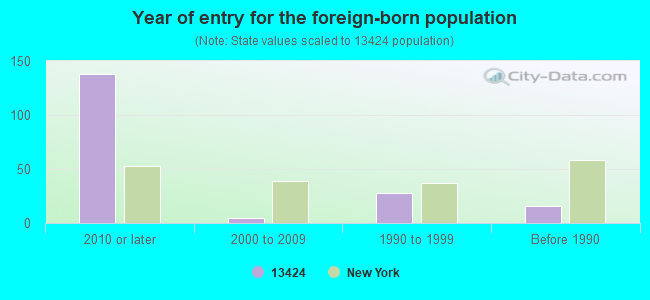
Year of entry for the foreign-born population
1382010 or later
52000 to 2009
281990 to 1999
16Before 1990
Facilities with environmental interests located in this zip code:
INDUSTRIAL OIL TANK SERVICE CO (120 DRY RD in ORISKANY, NY)
STATE MASTER (Maryland Permits tracking) - OIL CONTROL TRANSPORTER (Resource Conservation and Recovery Act (tracking hazardous waste)) Business SIC classification: SCRAP AND WASTE MATERIALS
AERO UNION CORP (BASE RD & AIRPORT ST in ORISKANY, NY)
(Resource Conservation and Recovery Act (tracking hazardous waste))
ALFRED PUBLISHING (123 DRY RD in ORISKANY, NY)
Small Quantity Generators, between 100 kg and 1000 kg of hazardous waste/month (Resource Conservation and Recovery Act (tracking hazardous waste)) - notification Organizations: MORTON MANUS (CONTACT/OWNER)
HMQ CHEMTECH L.L.C. (170 BASE RD. in ORISKANY, NY)
CRITERIA AND HAZARDOUS AIR POLLUTANT INVENTORY (Inventory of air pollution sources) Business SIC classification: ELECTROPLATING, PLATING, POLISHING, ANODIZING, AND COLORING
Housing units lacking complete plumbing facilities: 3.3% Housing units lacking complete kitchen facilities: 7.4%
71.8%Utility gas
12.0%Electricity
8.0%Fuel oil, kerosene, etc.
4.1%Wood
2.3%Other fuel
1.6%Bottled, tank, or LP gas
0.5%No fuel used
Population in 1990: 3,566.
Place of birth for U.S.-born residents:
This state: 1,881
Northeast: 60
Midwest: 44
South: 58
West: 11
64% of the 13424 zip code residents lived in the same house 5 years ago. Out of people who lived in different houses, 70% lived in this county. Out of people who lived in different counties, 50% lived in New York.
86% of the 13424 zip code residents lived in the same house 1 year ago. Out of people who lived in different houses, 48% moved from this county. Out of people who lived in different houses, 48% moved from different county within same state. Out of people who lived in different houses, 3% moved from different state.
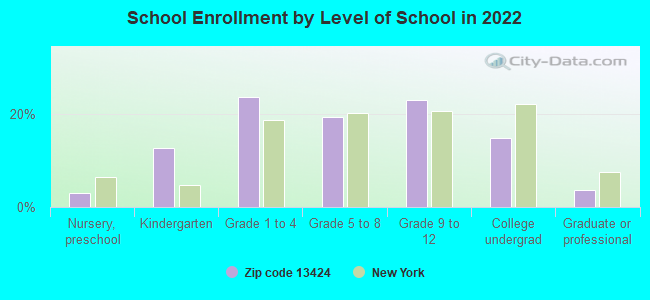
Private vs. public school enrollment:
Students in private schools in grades 1 to 8 (elementary and middle school): 2
Here:
1.5%
New York:
15.6%
Students in private schools in grades 9 to 12 (high school): 4
Here:
6.1%
New York:
15.0%
Students in private undergraduate colleges: 20
Here:
42.0%
New York:
39.2%
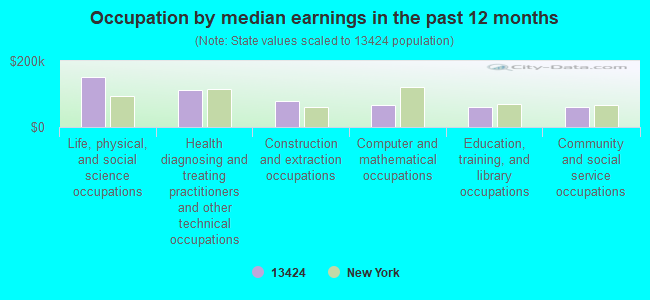
Occupation by median earnings in the past 12 months ($)
152,595Life, physical, and social science occupations
113,001Health diagnosing and treating practitioners and other technical occupations
77,395Construction and extraction occupations
67,596Computer and mathematical occupations
60,843Education, training, and library occupations
59,716Community and social service occupations
Companies with federal contracts located in this zip code (ORISKANY, NY):
STEEL TREATERS INC (50 COUNTRY CLUB DRIVE) : $477,349 in 17 contractsfrom 2003 to 2006
Contracts for Technical Representation Services -- Weapons by Army Signed by year:2000: $0; 2001: $0; 2002: $0; 2003: $245,365; 2004: $232,625; 2005: $140,701; 2006: -$141,342.
Biggest contracts:
$209,950 with Army for Technical Representation Services -- Weapons. Signed on 2003-09-30. Completion date: 2004-09-30.
$195,779, same as above.Signed on 2005-09-27. Completion date: 2005-09-30.
$184,541, same as above.Signed on 2004-09-21. Completion date: 2005-09-30.
$50,000, same as above.Signed on 2006-06-29. Completion date: 2006-09-30.
MID-STATE COMMUNICATIONS & ELE (185 CLEAR RD; small business) : $95,835 in 5 contractsfrom 2000 to 2005
Contracts for Maintenance, Repair or Alteration of Real Property -- Office Buildings, Maintenance, Repair and Rebuilding of Equipment -- Communication, Detection, and Coherent Radiation Equipment, Radio and Television Communication Equipment, Except Airborne, Intercommunication and Public Address Systems, Except Airborne, and moreby Air Force, Army Signed by year:2000: $45,090; 2001: $0; 2002: $0; 2003: $20,500; 2004: $18,905; 2005: $11,340; 2006: $0.
Biggest contracts:
$45,090 with Air Force for Maintenance, Repair or Alteration of Real Property -- Office Buildings. Signed on 2000-09-30. Completion date: 2000-12-10.
$20,500 with Army for Maintenance, Repair and Rebuilding of Equipment -- Communication, Detection, and Coherent Radiation Equipment. Signed on 2003-09-23. Completion date: 2003-12-23.
$11,340 with Air Force for Radio and Television Communication Equipment, Except Airborne. Signed on 2005-09-22. Completion date: 2005-10-03.
$10,485 with Army for Intercommunication and Public Address Systems, Except Airborne. Signed on 2004-08-27. Completion date: 2004-09-10.
TERAHERTZ TECHNOLOGIES, INC (169 CLEAR RD; small business) : $56,600 in 3 contractsfrom 2001 to 2006
$49,000 with NASA for Converters, Electrical, Rotating. Signed on 2001-03-15. Completion date: 2001-05-15.
$4,375 with Army for Pressure, Temperature, and Humidity Measuring and Controlling Instruments. Signed on 2006-04-05. Completion date: 2006-04-14.
$3,225 with Navy for Electrical and Electronic Properties Measuring and Testing Instruments. Signed on 2005-11-10. Completion date: 2005-12-09.
CALDWELL BENNETT INC (6152 COUNTY SEAT RD; small business) : $29,017 in 2 contractsin 2005
$23,517 with Air Force for Cable, Cord, and Wire Assemblies: Communications Equipment. Signed on 2005-09-29. Completion date: 2005-10-28.
$5,500 with Air Force for Wire and Cable, Electrical. Signed on 2005-11-09. Completion date: 2005-12-07.
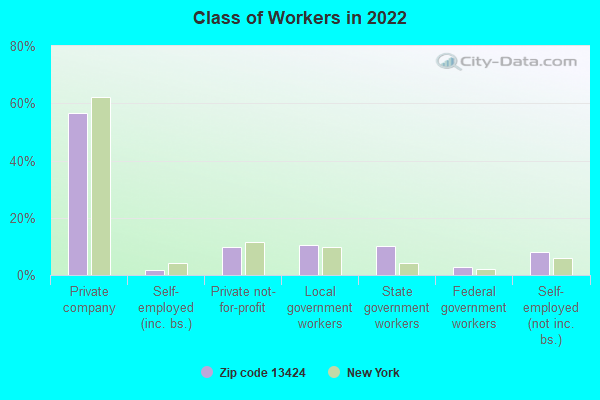
Top industries in this zip code by the number of employees in 2005:
Finance and Insurance: Direct Life Insurance Carriers (500-999 employees: 1 establishment, 20-49 employees: 1 establishment)
Finance and Insurance: Commercial Banking (500-999: 1)
Finance and Insurance: All Other Nondepository Credit Intermediation (100-249: 1)
Professional, Scientific, and Technical Services: Payroll Services (100-249: 1)
Administrative and Support and Waste Management and Remediation Services: Employment Placement Agencies (100-249: 1)
Health Care and Social Assistance: Nursing Care Facilities (100-249: 1)
Finance and Insurance: Direct Property and Casualty Insurance Carriers (50-99: 1, 1-4: 1)
People in group quarters in 2010:
469 people in local jails and other municipal confinement facilities
82 people in nursing facilities/skilled-nursing facilities
People in group quarters in 2000:
421 people in local jails and other confinement facilities (including police lockups)
78 people in nursing homes
Home Mortgage Disclosure Act Aggregated Statistics For Year 2009 (Based on 2 full and 2 partial tracts)
A) FHA, FSA/RHS & VA Home Purchase Loans
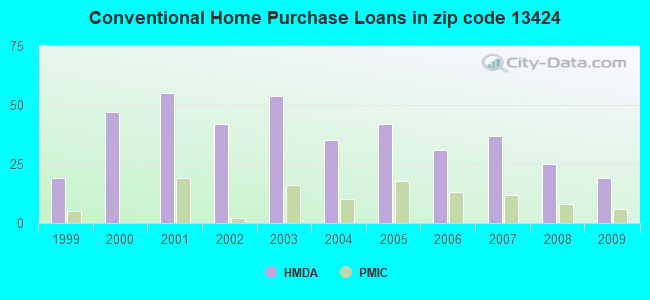
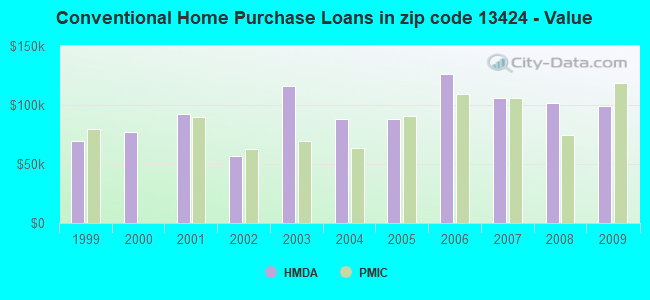
B) Conventional Home Purchase Loans
C) Refinancings
D) Home Improvement Loans
F) Non-occupant Loans on < 5 Family Dwellings (A B C & D)
Number
Average Value
Number
Average Value
Number
Average Value
Number
Average Value
Number
Average Value
LOANS ORIGINATED
16
$89,381
19
$99,491
48
$108,832
21
$44,533
2
$65,820
APPLICATIONS APPROVED, NOT ACCEPTED
0
$0
0
$0
6
$157,080
2
$177,280
0
$0
APPLICATIONS DENIED
0
$0
0
$0
28
$124,648
6
$76,712
0
$0
APPLICATIONS WITHDRAWN
0
$0
0
$0
11
$157,785
0
$0
0
$0
FILES CLOSED FOR INCOMPLETENESS
0
$0
0
$0
6
$45,540
0
$0
0
$0
Aggregated Statistics For Year 2008 (Based on 2 full and 2 partial tracts)
A) FHA, FSA/RHS & VA Home Purchase Loans
B) Conventional Home Purchase Loans
C) Refinancings
D) Home Improvement Loans
F) Non-occupant Loans on < 5 Family Dwellings (A B C & D)
G) Loans On Manufactured Home Dwelling (A B C & D)
Number
Average Value
Number
Average Value
Number
Average Value
Number
Average Value
Number
Average Value
Number
Average Value
LOANS ORIGINATED
8
$81,276
25
$101,558
41
$67,278
10
$65,462
4
$60,835
4
$91,742
APPLICATIONS APPROVED, NOT ACCEPTED
0
$0
0
$0
10
$67,617
2
$13,295
0
$0
0
$0
APPLICATIONS DENIED
4
$104,718
6
$86,100
16
$75,156
29
$25,670
4
$102,722
0
$0
APPLICATIONS WITHDRAWN
4
$84,272
2
$49,865
21
$105,300
2
$8,865
0
$0
2
$67,365
FILES CLOSED FOR INCOMPLETENESS
0
$0
0
$0
0
$0
0
$0
0
$0
0
$0
Aggregated Statistics For Year 2007 (Based on 2 full and 2 partial tracts)
A) FHA, FSA/RHS & VA Home Purchase Loans
B) Conventional Home Purchase Loans
C) Refinancings
D) Home Improvement Loans
F) Non-occupant Loans on < 5 Family Dwellings (A B C & D)
Number
Average Value
Number
Average Value
Number
Average Value
Number
Average Value
Number
Average Value
LOANS ORIGINATED
11
$104,257
37
$106,324
70
$94,810
26
$44,007
4
$60,835
APPLICATIONS APPROVED, NOT ACCEPTED
0
$0
0
$0
2
$121,670
4
$26,928
0
$0
APPLICATIONS DENIED
0
$0
8
$67,816
37
$112,832
17
$36,722
4
$297,695
APPLICATIONS WITHDRAWN
0
$0
2
$52,855
23
$148,397
0
$0
0
$0
FILES CLOSED FOR INCOMPLETENESS
0
$0
0
$0
6
$65,600
0
$0
0
$0
Aggregated Statistics For Year 2006 (Based on 2 full and 2 partial tracts)
A) FHA, FSA/RHS & VA Home Purchase Loans
B) Conventional Home Purchase Loans
C) Refinancings
D) Home Improvement Loans
F) Non-occupant Loans on < 5 Family Dwellings (A B C & D)
G) Loans On Manufactured Home Dwelling (A B C & D)
Number
Average Value
Number
Average Value
Number
Average Value
Number
Average Value
Number
Average Value
Number
Average Value
LOANS ORIGINATED
15
$95,323
31
$125,979
68
$71,313
40
$47,636
6
$34,498
0
$0
APPLICATIONS APPROVED, NOT ACCEPTED
0
$0
2
$41,885
11
$46,879
8
$31,775
0
$0
2
$41,885
APPLICATIONS DENIED
6
$75,420
4
$64,825
73
$83,415
39
$20,179
2
$9,975
0
$0
APPLICATIONS WITHDRAWN
0
$0
8
$31,302
49
$82,036
6
$67,775
4
$24,932
0
$0
FILES CLOSED FOR INCOMPLETENESS
0
$0
0
$0
10
$76,193
0
$0
0
$0
0
$0
Aggregated Statistics For Year 2005 (Based on 2 full and 2 partial tracts)
A) FHA, FSA/RHS & VA Home Purchase Loans
B) Conventional Home Purchase Loans
C) Refinancings
D) Home Improvement Loans
F) Non-occupant Loans on < 5 Family Dwellings (A B C & D)
G) Loans On Manufactured Home Dwelling (A B C & D)
Number
Average Value
Number
Average Value
Number
Average Value
Number
Average Value
Number
Average Value
Number
Average Value
LOANS ORIGINATED
10
$87,363
42
$88,013
60
$79,754
43
$33,628
10
$56,601
0
$0
APPLICATIONS APPROVED, NOT ACCEPTED
0
$0
10
$106,312
12
$63,714
4
$29,308
2
$135,635
2
$39,890
APPLICATIONS DENIED
2
$88,760
4
$42,772
88
$86,468
33
$20,966
2
$4,985
0
$0
APPLICATIONS WITHDRAWN
2
$99,730
6
$96,330
48
$99,593
8
$46,844
2
$47,870
0
$0
FILES CLOSED FOR INCOMPLETENESS
0
$0
0
$0
4
$107,480
0
$0
0
$0
0
$0
Aggregated Statistics For Year 2004 (Based on 2 full and 2 partial tracts)
A) FHA, FSA/RHS & VA Home Purchase Loans
B) Conventional Home Purchase Loans
C) Refinancings
D) Home Improvement Loans
F) Non-occupant Loans on < 5 Family Dwellings (A B C & D)
G) Loans On Manufactured Home Dwelling (A B C & D)
Number
Average Value
Number
Average Value
Number
Average Value
Number
Average Value
Number
Average Value
Number
Average Value
LOANS ORIGINATED
8
$57,981
35
$87,885
55
$78,479
37
$38,441
8
$77,041
2
$59,840
APPLICATIONS APPROVED, NOT ACCEPTED
0
$0
6
$88,095
20
$86,350
2
$4,985
0
$0
2
$137,625
APPLICATIONS DENIED
2
$95,740
8
$73,052
62
$90,106
14
$27,766
4
$42,885
2
$84,770
APPLICATIONS WITHDRAWN
2
$52,855
4
$93,248
46
$86,266
15
$29,342
0
$0
0
$0
FILES CLOSED FOR INCOMPLETENESS
2
$144,610
8
$62,274
2
$71,805
2
$29,920
0
$0
0
$0
Aggregated Statistics For Year 2003 (Based on 2 full and 2 partial tracts)
A) FHA, FSA/RHS & VA Home Purchase Loans
B) Conventional Home Purchase Loans
C) Refinancings
D) Home Improvement Loans
F) Non-occupant Loans on < 5 Family Dwellings (A B C & D)
Number
Average Value
Number
Average Value
Number
Average Value
Number
Average Value
Number
Average Value
LOANS ORIGINATED
22
$77,965
54
$116,192
216
$80,653
15
$27,450
13
$68,018
APPLICATIONS APPROVED, NOT ACCEPTED
0
$0
0
$0
13
$90,483
2
$2,660
0
$0
APPLICATIONS DENIED
2
$70,810
13
$60,074
49
$88,761
15
$17,758
8
$40,555
APPLICATIONS WITHDRAWN
2
$42,885
6
$54,628
51
$80,370
0
$0
0
$0
FILES CLOSED FOR INCOMPLETENESS
0
$0
0
$0
6
$87,430
0
$0
0
$0
Aggregated Statistics For Year 2002 (Based on 2 full and 2 partial tracts)
A) FHA, FSA/RHS & VA Home Purchase Loans
B) Conventional Home Purchase Loans
C) Refinancings
D) Home Improvement Loans
E) Loans on Dwellings For 5+ Families
F) Non-occupant Loans on < 5 Family Dwellings (A B C & D)
Number
Average Value
Number
Average Value
Number
Average Value
Number
Average Value
Number
Average Value
Number
Average Value
LOANS ORIGINATED
19
$75,288
42
$57,168
112
$69,351
32
$23,283
0
$0
0
$0
APPLICATIONS APPROVED, NOT ACCEPTED
2
$30,915
8
$73,880
13
$52,929
0
$0
0
$0
2
$13,295
APPLICATIONS DENIED
0
$0
2
$42,545
51
$69,951
22
$11,524
2
$146,255
0
$0
APPLICATIONS WITHDRAWN
4
$74,850
2
$27,480
33
$90,428
0
$0
0
$0
0
$0
FILES CLOSED FOR INCOMPLETENESS
0
$0
0
$0
8
$57,452
0
$0
0
$0
0
$0
Aggregated Statistics For Year 2001 (Based on 2 full and 2 partial tracts)
A) FHA, FSA/RHS & VA Home Purchase Loans
B) Conventional Home Purchase Loans
C) Refinancings
D) Home Improvement Loans
F) Non-occupant Loans on < 5 Family Dwellings (A B C & D)
Number
Average Value
Number
Average Value
Number
Average Value
Number
Average Value
Number
Average Value
LOANS ORIGINATED
18
$62,197
55
$92,501
94
$65,925
28
$5,778
0
$0
APPLICATIONS APPROVED, NOT ACCEPTED
0
$0
0
$0
6
$41,700
2
$8,865
0
$0
APPLICATIONS DENIED
0
$0
8
$58,979
39
$59,063
8
$12,244
2
$24,935
APPLICATIONS WITHDRAWN
0
$0
2
$54,850
29
$63,030
4
$19,668
0
$0
FILES CLOSED FOR INCOMPLETENESS
0
$0
0
$0
6
$66,487
0
$0
0
$0
Aggregated Statistics For Year 2000 (Based on 2 full and 2 partial tracts)
A) FHA, FSA/RHS & VA Home Purchase Loans
B) Conventional Home Purchase Loans
C) Refinancings
D) Home Improvement Loans
E) Loans on Dwellings For 5+ Families
F) Non-occupant Loans on < 5 Family Dwellings (A B C & D)
Number
Average Value
Number
Average Value
Number
Average Value
Number
Average Value
Number
Average Value
Number
Average Value
LOANS ORIGINATED
25
$70,612
47
$76,755
33
$75,327
36
$26,156
0
$0
2
$53,185
APPLICATIONS APPROVED, NOT ACCEPTED
0
$0
4
$34,905
6
$29,880
5
$26,238
0
$0
2
$29,920
APPLICATIONS DENIED
0
$0
10
$42,971
15
$39,536
17
$25,629
2
$40,890
2
$70,910
APPLICATIONS WITHDRAWN
0
$0
2
$17,730
17
$70,719
0
$0
0
$0
0
$0
FILES CLOSED FOR INCOMPLETENESS
0
$0
0
$0
17
$75,739
2
$13,295
0
$0
0
$0
Aggregated Statistics For Year 1999 (Based on 1 full and 1 partial tracts)
A) FHA, FSA/RHS & VA Home Purchase Loans
B) Conventional Home Purchase Loans
C) Refinancings
D) Home Improvement Loans
F) Non-occupant Loans on < 5 Family Dwellings (A B C & D)
Detailed PMIC statistics for the following Tracts:0231.00
, 0236.00
2002 - 2018 National Fire Incident Reporting System (NFIRS) incidents
Based on the data from the years 2002 - 2018 the average number of fires per year is 10. The highest number of fire incidents - 29 took place in 2017, and the least - 4 in 2002. The data has a rising trend.
When looking into fire subcategories, the most incidents belonged to: Structure Fires (65.5%), and Outside Fires (14.9%).
Fire incident types reported to NFIRS in Zip Code 13424


 Nearest zip codes: 13492, 13321, 13490, 13441, 13417, 13469.


 Based on the data from the years 2002 - 2018 the average number of fires per year is 10. The highest number of fire incidents - 29 took place in 2017, and the least - 4 in 2002. The data has a rising trend.
 When looking into fire subcategories, the most incidents belonged to: Structure Fires (65.5%), and Outside Fires (14.9%).