Estimated zip code population in 2022: 3,107 Zip code population in 2010: 3,083 Zip code population in 2000: 3,179
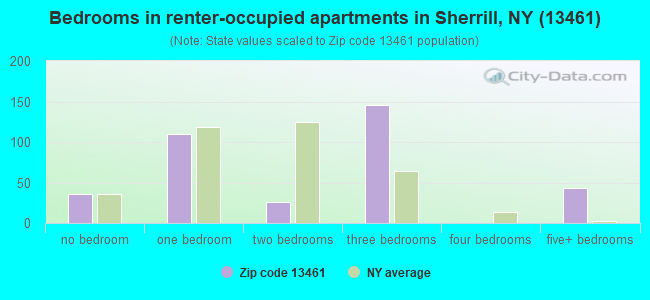
Houses and condos: 1,387 Renter-occupied apartments: 362
% of renters here:
27%
State:
46%
March 2022 cost of living index in zip code 13461: 99.3 (near average, U.S. average is 100)
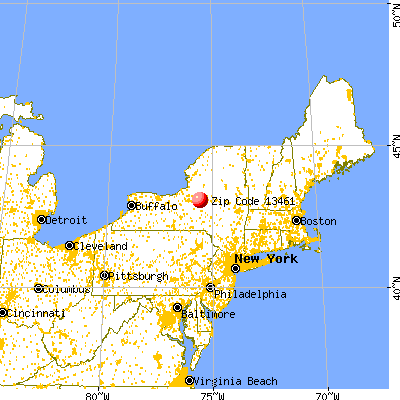
Land area: 2.3 sq. mi. Water area: 0.0 sq. mi.
Population density: 1,340 people per square mile
(low).
OSM Map
General Map
Google Map
MSN Map
OSM Map
General Map
Google Map
MSN Map
OSM Map
General Map
Google Map
MSN Map
OSM Map
General Map
Google Map
MSN Map
Please wait while loading the map...
Real estate property taxes paid for housing units in 2022:
This zip code:
2.0% ($4,049)
New York:
1.5% ($6,180)
Median real estate property taxes paid for housing units with mortgages in 2022: $4,369 (2.2%) Median real estate property taxes paid for housing units with no mortgage in 2022: $3,736 (1.8%)
Business Search- 14 Million verified businesses
Males: 1,535
(49.4%)
Females: 1,572
(50.6%)
For population 25 years and over in 13461:
High school or higher: 96.7%
Bachelor's degree or higher: 39.4%
Graduate or professional degree: 16.7%
Unemployed: 2.7%
Mean travel time to work (commute): 20.8 minutes
For population 15 years and over in 13461:
Never married: 22.2%
Now married: 56.2%
Separated: 2.4%
Widowed: 7.5%
Divorced: 11.8%
Zip code 13461 compared to state average:
Median house value below state average.
Unemployed percentage below state average.
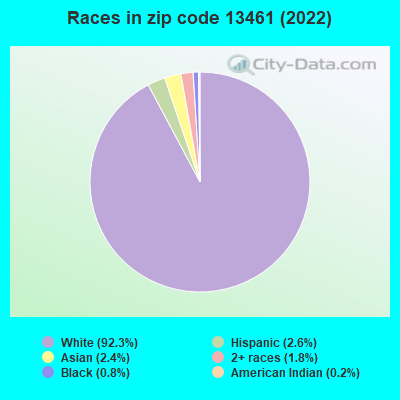
Black race population percentage significantly below state average.
Hispanic race population percentage significantly below state average.
Median age significantly above state average.
Foreign-born population percentage significantly below state average.
Renting percentage below state average.
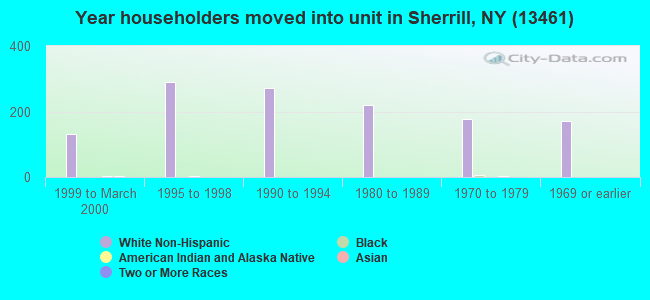
Length of stay since moving in significantly above state average.
Estimated median house/condo value in 2022: $200,773
13461:
$200,773
New York:
$400,400
Median resident age:
This zip code:
48.3 years
New York median age:
40.0 years
Average household size:
This zip code:
2.3 people
New York:
2.5 people
Averages for the 2020 tax year for zip code 13461, filed in 2021:
Average Adjusted Gross Income (AGI) in 2020: $64,990 (Individual Income Tax Returns)
Here:
$64,990
State:
$90,930
Salary/wage: $56,845 (reported on 75.9% of returns)
Here:
$56,845
State:
$72,104
(% of AGI for various income ranges: 1002.7% for AGIs below $25k, 2963.5% for AGIs $25k-50k, 5421.4% for AGIs $50k-75k, 7512.1% for AGIs $75k-100k, 15320.0% for AGIs $100k-200k, 41230.0% for AGIs over 200k)
Taxable interest for individuals: $731 (reported on 48.1% of returns)
This zip code:
$731
New York:
$3,075
(% of AGI for various income ranges: 21.3% for AGIs below $25k, 25.2% for AGIs $25k-50k, 35.2% for AGIs $50k-75k, 75.7% for AGIs $75k-100k, 97.8% for AGIs $100k-200k, 360.0% for AGIs over 200k)
Ordinary dividends: $3,840 (reported on 24.7% of returns)
Here:
$3,840
State:
$11,095
(% of AGI for various income ranges: 26.0% for AGIs below $25k, 31.3% for AGIs $25k-50k, 104.3% for AGIs $50k-75k, 185.7% for AGIs $75k-100k, 266.1% for AGIs $100k-200k, 2015.0% for AGIs over 200k)
Net capital gain/loss in AGI: +$5,810 (reported on 17.9% of returns)
Here:
+$5,810
State:
+$44,925
(% of AGI for various income ranges: 9.0% for AGIs below $25k, 7.7% for AGIs $25k-50k, 107.1% for AGIs $50k-75k, 198.6% for AGIs $75k-100k, 176.1% for AGIs $100k-200k, 4070.0% for AGIs over 200k)
Profit/loss from business: +$7,817 (reported on 11.1% of returns)
Here:
+$7,817
State:
+$14,940
(% of AGI for various income ranges: 56.7% for AGIs below $25k, 59.0% for AGIs $25k-50k, 91.4% for AGIs $50k-75k, 478.9% for AGIs $100k-200k)
Taxable individual retirement arrangement distribution: $12,921 (reported on 14.8% of returns)
13461:
$12,921
New York:
$19,609
(% of AGI for various income ranges: 128.7% for AGIs below $25k, 159.4% for AGIs $25k-50k, 265.7% for AGIs $50k-75k, 317.9% for AGIs $75k-100k, 676.7% for AGIs $100k-200k)
Total itemized deductions: $22,067 (reported on 3.7% of returns)
Here:
$22,067
State:
$39,326
(% of AGI for various income ranges: 384.3% for AGIs $50k-75k, 287.2% for AGIs $100k-200k)
Charity contributions: $4,600 (reported on 2.5% of returns)
Here:
$4,600
State:
$15,420
(% of AGI for various income ranges: 131.4% for AGIs $75k-100k)
Taxes paid: $7,983 (reported on 3.7% of returns)
13461:
$7,983
State:
$9,183
(% of AGI for various income ranges: 115.2% for AGIs $50k-75k, 131.7% for AGIs $100k-200k)
Earned income credit: $2,071 (reported on 8.6% of returns)
Here:
$2,071
State:
$2,138
(% of AGI for various income ranges: 47.0% for AGIs below $25k, 48.1% for AGIs $25k-50k)
Percentage of individuals using paid preparers for their 2020 taxes: 95.1%
Here:
95%
State:
95%
(% for various income ranges: 93.2% for AGIs below $25k, 94.6% for AGIs $25k-50k, 93.1% for AGIs $50k-75k, 100.0% for AGIs $75k-100k, 96.6% for AGIs $100k-200k, 100.0% for AGIs over 200k)
Averages for the 2012 tax year for zip code 13461, filed in 2013:
Average Adjusted Gross Income (AGI) in 2012: $55,178 (Individual Income Tax Returns)
Here:
$55,178
State:
$77,088
Salary/wage: $48,667 (reported on 80.2% of returns)
Here:
$48,667
State:
$60,593
(% of AGI for various income ranges: 67.0% for AGIs below $25k, 71.7% for AGIs $25k-50k, 73.7% for AGIs $50k-75k, 76.4% for AGIs $75k-100k, 74.8% for AGIs $100k-200k, 49.7% for AGIs over 200k)
Taxable interest for individuals: $752 (reported on 52.5% of returns)
This zip code:
$752
New York:
$3,125
(% of AGI for various income ranges: 1.8% for AGIs below $25k, 1.4% for AGIs $25k-50k, 0.9% for AGIs $50k-75k, 0.4% for AGIs $75k-100k, 0.4% for AGIs $100k-200k, 0.2% for AGIs over 200k)
Ordinary dividends: $2,467 (reported on 27.8% of returns)
Here:
$2,467
State:
$10,299
(% of AGI for various income ranges: 1.6% for AGIs below $25k, 1.2% for AGIs $25k-50k, 1.4% for AGIs $50k-75k, 0.7% for AGIs $75k-100k, 1.9% for AGIs $100k-200k)
Net capital gain/loss in AGI: +$3,865 (reported on 14.2% of returns)
Here:
+$3,865
State:
+$42,474
(% of AGI for various income ranges: 0.2% for AGIs $50k-75k, 3.4% for AGIs $100k-200k)
Profit/loss from business: +$8,840 (reported on 12.3% of returns)
Here:
+$8,840
State:
+$16,168
(% of AGI for various income ranges: 4.2% for AGIs below $25k, 0.7% for AGIs $25k-50k, 2.5% for AGIs $50k-75k, 1.5% for AGIs $75k-100k, 2.9% for AGIs $100k-200k)
Taxable individual retirement arrangement distribution: $10,104 (reported on 15.4% of returns)
13461:
$10,104
New York:
$17,621
(% of AGI for various income ranges: 4.8% for AGIs below $25k, 3.4% for AGIs $25k-50k, 3.0% for AGIs $50k-75k, 2.3% for AGIs $75k-100k, 3.5% for AGIs $100k-200k)
Total itemized deductions: $17,275 (17% of AGI, reported on 32.7% of returns)
Here:
$17,275
State:
$34,985
Here:
17.3% of AGI
State:
21.3% of AGI
(% of AGI for various income ranges: 5.6% for AGIs below $25k, 7.5% for AGIs $25k-50k, 9.1% for AGIs $50k-75k, 11.6% for AGIs $75k-100k, 12.3% for AGIs $100k-200k, 11.0% for AGIs over 200k)
Charity contributions: $2,364 (reported on 27.8% of returns)
Here:
$2,364
State:
$5,572
(% of AGI for various income ranges: 0.9% for AGIs below $25k, 0.8% for AGIs $25k-50k, 1.0% for AGIs $50k-75k, 1.4% for AGIs $75k-100k, 1.3% for AGIs $100k-200k, 1.4% for AGIs over 200k)
Taxes paid: $9,126 (reported on 33.3% of returns)
13461:
$9,126
State:
$18,656
(% of AGI for various income ranges: 1.7% for AGIs below $25k, 2.9% for AGIs $25k-50k, 4.0% for AGIs $50k-75k, 5.5% for AGIs $75k-100k, 7.6% for AGIs $100k-200k, 8.3% for AGIs over 200k)
Earned income credit: $1,953 (reported on 10.5% of returns)
Here:
$1,953
State:
$2,230
(% of AGI for various income ranges: 3.3% for AGIs below $25k, 0.8% for AGIs $25k-50k)
Percentage of individuals using paid preparers for their 2012 taxes: 56.8%
Here:
57%
State:
66%
(% for various income ranges: 53.4% for AGIs below $25k, 55.6% for AGIs $25k-50k, 60.0% for AGIs $50k-75k, 60.0% for AGIs $75k-100k, 60.0% for AGIs $100k-200k, 66.7% for AGIs over 200k)
Averages for the 2004 tax year for zip code 13461, filed in 2005:
Average Adjusted Gross Income (AGI) in 2004: $45,674 (Individual Income Tax Returns)
Here:
$45,674
State:
$59,519
Salary/wage: $41,441 (reported on 83.5% of returns)
Here:
$41,441
State:
$50,673
(% of AGI for various income ranges: 82.6% for AGIs below $10k, 72.0% for AGIs $10k-25k, 75.2% for AGIs $25k-50k, 79.7% for AGIs $50k-75k, 80.7% for AGIs $75k-100k, 71.4% for AGIs over 100k)
Taxable interest for individuals: $1,001 (reported on 64.6% of returns)
This zip code:
$1,001
New York:
$2,377
(% of AGI for various income ranges: 6.2% for AGIs below $10k, 3.1% for AGIs $10k-25k, 2.0% for AGIs $25k-50k, 1.2% for AGIs $50k-75k, 1.1% for AGIs $75k-100k, 0.7% for AGIs over 100k)
Taxable dividends: $1,898 (reported on 32.9% of returns)
Here:
$1,898
State:
$5,394
(% of AGI for various income ranges: 4.2% for AGIs below $10k, 1.6% for AGIs $10k-25k, 1.1% for AGIs $25k-50k, 1.3% for AGIs $50k-75k, 0.4% for AGIs $75k-100k, 1.9% for AGIs over 100k)
Net capital gain/loss: +$2,000 (reported on 21.4% of returns)
Here:
+$2,000
State:
+$23,581
(% of AGI for various income ranges: 2.8% for AGIs below $10k, 0.6% for AGIs $10k-25k, 0.3% for AGIs $25k-50k, 0.7% for AGIs $50k-75k, 0.4% for AGIs $75k-100k, 1.8% for AGIs over 100k)
Profit/loss from business: +$11,672 (reported on 11.8% of returns)
Here:
+$11,672
State:
+$13,809
(% of AGI for various income ranges: -1.2% for AGIs below $10k, 3.0% for AGIs $10k-25k, 1.6% for AGIs $25k-50k, 2.0% for AGIs $50k-75k, 2.9% for AGIs $75k-100k, 4.8% for AGIs over 100k)
IRA payment deduction: $3,029 (reported on 2.2% of returns)
13461:
$3,029
New York:
$3,115
(% of AGI for various income ranges: 0.8% for AGIs $10k-25k, 0.2% for AGIs $50k-75k, 0.2% for AGIs $75k-100k)
Total itemized deductions: $15,708 (18% of AGI, reported on 33.1% of returns)
Here:
$15,708
State:
$25,864
Here:
18.2% of AGI
State:
21.9% of AGI
(% of AGI for various income ranges: 5.2% for AGIs $10k-25k, 8.8% for AGIs $25k-50k, 11.0% for AGIs $50k-75k, 14.5% for AGIs $75k-100k, 13.5% for AGIs over 100k)
Charity contributions deductions: $2,151 (2% of AGI, reported on 30.9% of returns)
Here:
$2,151
State:
$4,439
Here:
2.4% of AGI
State:
3.6% of AGI
(% of AGI for various income ranges: 0.9% for AGIs $10k-25k, 0.7% for AGIs $25k-50k, 1.3% for AGIs $50k-75k, 1.6% for AGIs $75k-100k, 2.1% for AGIs over 100k)
Total tax: $5,998 (reported on 79.1% of returns)
13461:
$5,998
State:
$11,730
(% of AGI for various income ranges: 1.7% for AGIs below $10k, 4.0% for AGIs $10k-25k, 6.6% for AGIs $25k-50k, 8.7% for AGIs $50k-75k, 9.7% for AGIs $75k-100k, 16.1% for AGIs over 100k)
Earned income credit: $1,607 (reported on 8.9% of returns)
Here:
$1,607
State:
$1,757
Percentage of individuals using paid preparers for their 2004 taxes: 57.7%
Here:
58%
State:
67%
(% for various income ranges: 45.1% for AGIs below $10k, 56.7% for AGIs $10k-25k, 57.9% for AGIs $25k-50k, 63.0% for AGIs $50k-75k, 63.8% for AGIs $75k-100k, 70.1% for AGIs over 100k)
Likely homosexual households (counted as self-reported same-sex unmarried-partner households)
Lesbian couples: 1.1% of all households
Gay men: 0.0% of all households
Household received Food Stamps/SNAP in the past 12 months: 118 Household did not receive Food Stamps/SNAP in the past 12 months: 1,222
Women who had a birth in the past 12 months: 67 (31 now married, 37 unmarried) Women who did not have a birth in the past 12 months: 596 (296 now married, 296 unmarried)
Housing units in zip code 13461 with a mortgage: 467 (26 second mortgage, 23 both second mortgage and home equity loan) Houses without a mortgage: 49
Median monthly owner costs for units with a mortgage: $1,395 Median monthly owner costs for units without a mortgage: $571
Residents with income below the poverty level in 2022:
This zip code:
6.4%
Whole state:
14.3%
Residents with income below 50% of the poverty level in 2022:
This zip code:
2.8%
Whole state:
6.8%
Median number of rooms in houses and condos:
Here:
6.9
State:
6.3
Median number of rooms in apartments:
Here:
4.6
State:
3.8
Notable locations in this zip code not listed on our city pages
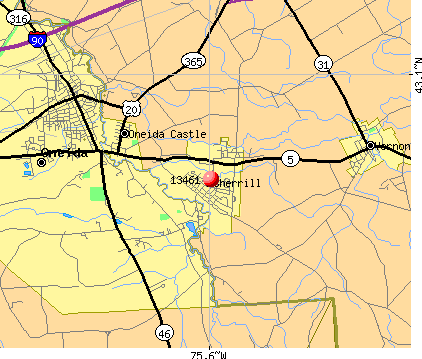
Notable locations in zip code 13461: Sherrill City Sewage Treatment Plant (A), Sherrill - Kenwood Free Library (B), Sherrill - Kenwood Volunteer Fire Department (C). Display/hide their locations on the map
Churches in zip code 13461 include: Christ United Methodist Church (A), Gethsemane Episcopal Church (B), Plymouth Alliance Church (C), Saint Helena's Church (D). Display/hide their locations on the map
In group quarters: 15 (-1 institutionalized population)
Size of family households: 440 2-persons, 258 3-persons, 39 4-persons, 80 5-persons, 26 6-persons, 24 7-or-more-persons
Size of nonfamily households: 443 1-person, 40 2-persons
439 married couples with children.
160 single-parent households (21 men, 139 women).
99.4% of residents of 13461 zip code speak English at home.
0.6% of residents speak Spanish at home (59% very well, 41% well).
0.1% of residents speak other Indo-European language at home (100% very well).
0.4% of residents speak Asian or Pacific Island language at home (73% very well, 9% well, 18% not well).
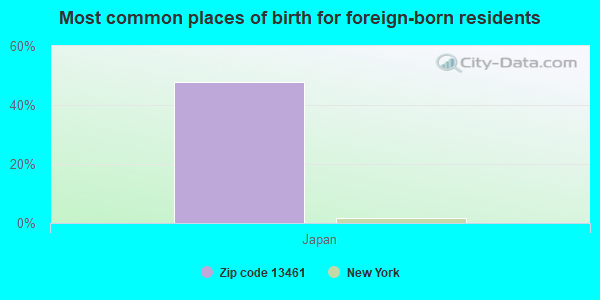
Foreign born population: 23 (0.8%) (71.9% of them are naturalized citizens)
This zip code:
0.8%
Whole state:
22.7%
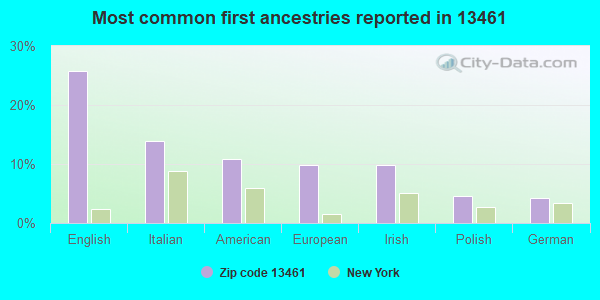
48%Japan
26%English
14%Italian
11%American
10%European
10%Irish
5%Polish
4%German
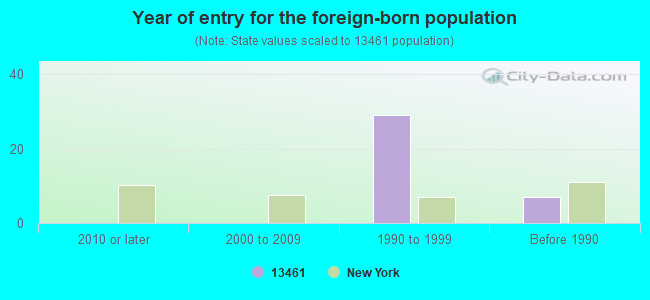
Year of entry for the foreign-born population
02010 or later
02000 to 2009
291990 to 1999
7Before 1990
Facilities with environmental interests located in this zip code:
E.A. MCALLISTER ES ( in SHERRILL, NY)
(National Center for Education Statistics) - STATE ID-412000050006 Organizations: SHERRILL CITY SD (SCHOOL DISTRICT)
Housing units lacking complete plumbing facilities: 0.4% Housing units lacking complete kitchen facilities: 0.7%
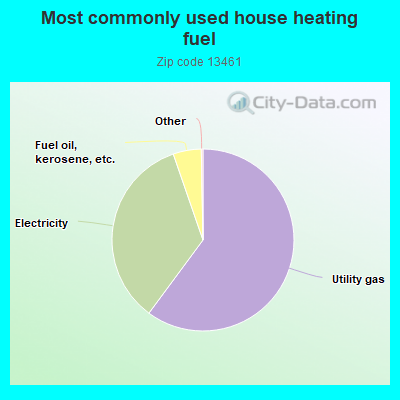
60.2%Utility gas
34.6%Electricity
5.0%Fuel oil, kerosene, etc.
Population in 1990: 2,864. Population change in the 1990s: +315 (+11.0%).
Place of birth for U.S.-born residents:
This state: 2,698
Northeast: 114
Midwest: 79
South: 85
West: 84
69% of the 13461 zip code residents lived in the same house 5 years ago. Out of people who lived in different houses, 54% lived in this county. Out of people who lived in different counties, 50% lived in New York.
96% of the 13461 zip code residents lived in the same house 1 year ago. Out of people who lived in different houses, 40% moved from this county. Out of people who lived in different houses, 46% moved from different county within same state. Out of people who lived in different houses, 8% moved from different state. Out of people who lived in different houses, 3% moved from abroad.
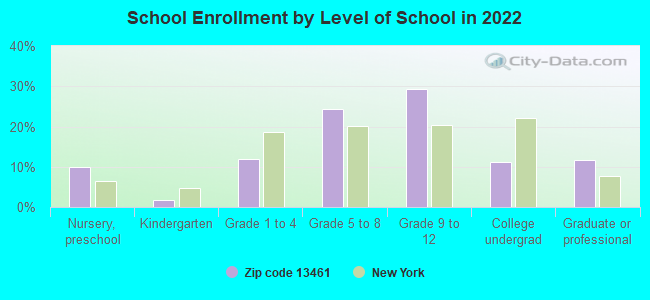
Private vs. public school enrollment:
Students in private schools in grades 1 to 8 (elementary and middle school):
Here:
0.0%
New York:
15.6%
Students in private schools in grades 9 to 12 (high school):
Here:
0.0%
New York:
15.0%
Students in private undergraduate colleges:
Here:
0.0%
New York:
39.2%
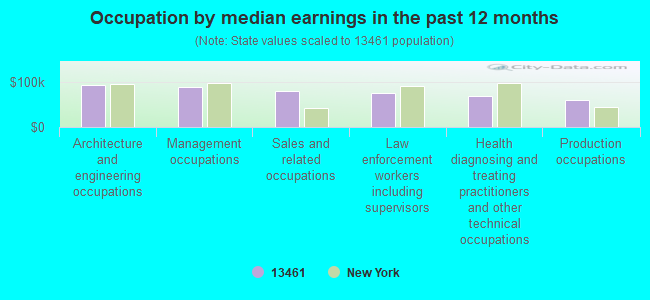
Occupation by median earnings in the past 12 months ($)
93,408Architecture and engineering occupations
89,156Management occupations
80,550Sales and related occupations
74,119Law enforcement workers including supervisors
67,487Health diagnosing and treating practitioners and other technical occupations
60,094Production occupations
Top industries in this zip code by the number of employees in 2005:
Accommodation and Food Services: Full-Service Restaurants (10-19 employees: 2 establishments)
Finance and Insurance: Credit Unions (10-19: 1, 5-9: 1)
Wholesale Trade: Toy and Hobby Goods and Supplies Merchant Wholesalers (10-19: 1)
Accommodation and Food Services: Snack and Nonalcoholic Beverage Bars (10-19: 1)
Health Care and Social Assistance: Offices of Physicians (except Mental Health Specialists) (10-19: 1)
People in group quarters in 2010:
12 people in group homes intended for adults
People in group quarters in 2000:
12 people in other noninstitutional group quarters
Home Mortgage Disclosure Act Aggregated Statistics For Year 2009 (Based on 2 full tracts)
A) FHA, FSA/RHS & VA Home Purchase Loans
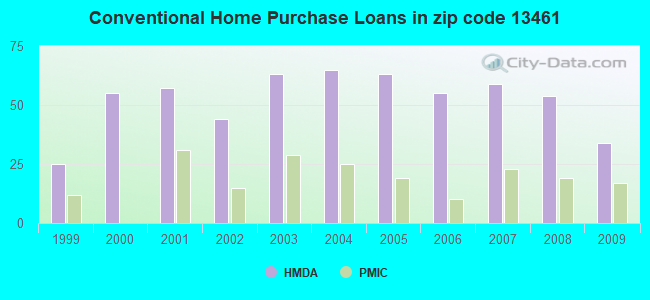
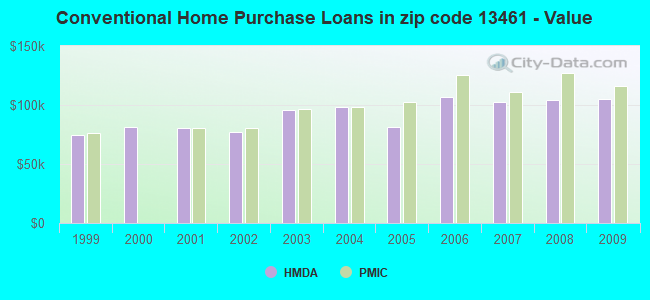
B) Conventional Home Purchase Loans
C) Refinancings
D) Home Improvement Loans
E) Loans on Dwellings For 5+ Families
F) Non-occupant Loans on < 5 Family Dwellings (A B C & D)
G) Loans On Manufactured Home Dwelling (A B C & D)
Number
Average Value
Number
Average Value
Number
Average Value
Number
Average Value
Number
Average Value
Number
Average Value
Number
Average Value
LOANS ORIGINATED
17
$130,422
34
$104,877
107
$108,630
29
$18,998
2
$1,913,000
6
$101,708
0
$0
APPLICATIONS APPROVED, NOT ACCEPTED
0
$0
0
$0
10
$90,294
0
$0
2
$2,391,250
0
$0
0
$0
APPLICATIONS DENIED
0
$0
4
$50,695
33
$121,447
10
$33,095
0
$0
4
$95,650
2
$4,780
APPLICATIONS WITHDRAWN
0
$0
0
$0
13
$123,021
0
$0
0
$0
0
$0
0
$0
FILES CLOSED FOR INCOMPLETENESS
0
$0
0
$0
2
$91,825
0
$0
0
$0
0
$0
0
$0
Aggregated Statistics For Year 2008 (Based on 2 full tracts)
A) FHA, FSA/RHS & VA Home Purchase Loans
B) Conventional Home Purchase Loans
C) Refinancings
D) Home Improvement Loans
F) Non-occupant Loans on < 5 Family Dwellings (A B C & D)
Number
Average Value
Number
Average Value
Number
Average Value
Number
Average Value
Number
Average Value
LOANS ORIGINATED
27
$131,147
54
$104,223
78
$114,142
25
$24,946
6
$39,217
APPLICATIONS APPROVED, NOT ACCEPTED
0
$0
2
$129,130
4
$44,000
2
$42,085
0
$0
APPLICATIONS DENIED
6
$107,447
2
$34,435
50
$129,013
19
$53,765
2
$34,435
APPLICATIONS WITHDRAWN
2
$87,040
0
$0
27
$117,969
0
$0
0
$0
FILES CLOSED FOR INCOMPLETENESS
0
$0
0
$0
8
$123,150
0
$0
0
$0
Aggregated Statistics For Year 2007 (Based on 2 full tracts)
A) FHA, FSA/RHS & VA Home Purchase Loans
B) Conventional Home Purchase Loans
C) Refinancings
D) Home Improvement Loans
F) Non-occupant Loans on < 5 Family Dwellings (A B C & D)
Number
Average Value
Number
Average Value
Number
Average Value
Number
Average Value
Number
Average Value
LOANS ORIGINATED
4
$98,998
59
$102,232
71
$98,021
69
$27,475
6
$78,752
APPLICATIONS APPROVED, NOT ACCEPTED
0
$0
2
$74,605
19
$84,877
2
$69,825
2
$74,605
APPLICATIONS DENIED
0
$0
2
$62,175
61
$108,821
21
$33,523
2
$99,475
APPLICATIONS WITHDRAWN
2
$58,345
6
$68,550
23
$113,532
4
$31,565
0
$0
FILES CLOSED FOR INCOMPLETENESS
0
$0
2
$72,695
4
$80,345
2
$44,000
0
$0
Aggregated Statistics For Year 2006 (Based on 2 full tracts)
A) FHA, FSA/RHS & VA Home Purchase Loans
B) Conventional Home Purchase Loans
C) Refinancings
D) Home Improvement Loans
E) Loans on Dwellings For 5+ Families
F) Non-occupant Loans on < 5 Family Dwellings (A B C & D)
G) Loans On Manufactured Home Dwelling (A B C & D)
Number
Average Value
Number
Average Value
Number
Average Value
Number
Average Value
Number
Average Value
Number
Average Value
Number
Average Value
LOANS ORIGINATED
11
$118,085
55
$107,058
90
$85,235
59
$28,857
2
$487,815
11
$91,824
0
$0
APPLICATIONS APPROVED, NOT ACCEPTED
0
$0
6
$205,010
6
$102,027
10
$31,182
0
$0
0
$0
2
$100,435
APPLICATIONS DENIED
0
$0
4
$118,605
73
$96,829
42
$37,759
2
$66,955
4
$5,260
0
$0
APPLICATIONS WITHDRAWN
0
$0
10
$112,293
46
$94,319
11
$84,346
0
$0
0
$0
0
$0
FILES CLOSED FOR INCOMPLETENESS
0
$0
2
$64,085
6
$101,388
0
$0
0
$0
2
$64,085
0
$0
Aggregated Statistics For Year 2005 (Based on 2 full tracts)
A) FHA, FSA/RHS & VA Home Purchase Loans
B) Conventional Home Purchase Loans
C) Refinancings
D) Home Improvement Loans
F) Non-occupant Loans on < 5 Family Dwellings (A B C & D)
G) Loans On Manufactured Home Dwelling (A B C & D)
Number
Average Value
Number
Average Value
Number
Average Value
Number
Average Value
Number
Average Value
Number
Average Value
LOANS ORIGINATED
8
$88,476
63
$81,470
67
$93,651
33
$28,057
8
$50,695
0
$0
APPLICATIONS APPROVED, NOT ACCEPTED
0
$0
4
$51,172
6
$43,362
0
$0
0
$0
2
$16,260
APPLICATIONS DENIED
0
$0
2
$71,735
71
$108,367
13
$47,089
0
$0
0
$0
APPLICATIONS WITHDRAWN
0
$0
2
$103,300
36
$104,631
4
$28,695
0
$0
0
$0
FILES CLOSED FOR INCOMPLETENESS
0
$0
0
$0
8
$118,606
0
$0
0
$0
0
$0
Aggregated Statistics For Year 2004 (Based on 2 full tracts)
A) FHA, FSA/RHS & VA Home Purchase Loans
B) Conventional Home Purchase Loans
C) Refinancings
D) Home Improvement Loans
E) Loans on Dwellings For 5+ Families
F) Non-occupant Loans on < 5 Family Dwellings (A B C & D)
G) Loans On Manufactured Home Dwelling (A B C & D)
Number
Average Value
Number
Average Value
Number
Average Value
Number
Average Value
Number
Average Value
Number
Average Value
Number
Average Value
LOANS ORIGINATED
13
$104,479
65
$98,505
88
$89,020
46
$14,971
2
$98,520
8
$53,564
0
$0
APPLICATIONS APPROVED, NOT ACCEPTED
2
$67,910
8
$132,714
19
$95,448
8
$24,630
0
$0
0
$0
0
$0
APPLICATIONS DENIED
0
$0
11
$58,781
59
$92,440
10
$14,347
0
$0
2
$57,390
2
$26,780
APPLICATIONS WITHDRAWN
0
$0
6
$71,418
55
$97,250
4
$97,085
0
$0
2
$67,910
0
$0
FILES CLOSED FOR INCOMPLETENESS
0
$0
2
$110,955
8
$99,236
2
$23,915
0
$0
0
$0
0
$0
Aggregated Statistics For Year 2003 (Based on 2 full tracts)
A) FHA, FSA/RHS & VA Home Purchase Loans
B) Conventional Home Purchase Loans
C) Refinancings
D) Home Improvement Loans
F) Non-occupant Loans on < 5 Family Dwellings (A B C & D)
Number
Average Value
Number
Average Value
Number
Average Value
Number
Average Value
Number
Average Value
LOANS ORIGINATED
10
$79,198
63
$95,559
222
$84,215
46
$12,933
6
$57,072
APPLICATIONS APPROVED, NOT ACCEPTED
0
$0
4
$90,868
13
$72,547
4
$47,825
0
$0
APPLICATIONS DENIED
0
$0
6
$60,260
54
$97,599
11
$32,869
2
$60,260
APPLICATIONS WITHDRAWN
4
$76,998
0
$0
52
$90,316
6
$27,738
0
$0
FILES CLOSED FOR INCOMPLETENESS
0
$0
0
$0
8
$88,238
0
$0
0
$0
Aggregated Statistics For Year 2002 (Based on 2 full tracts)
A) FHA, FSA/RHS & VA Home Purchase Loans
B) Conventional Home Purchase Loans
C) Refinancings
D) Home Improvement Loans
F) Non-occupant Loans on < 5 Family Dwellings (A B C & D)
Number
Average Value
Number
Average Value
Number
Average Value
Number
Average Value
Number
Average Value
LOANS ORIGINATED
19
$72,895
44
$77,172
143
$88,600
52
$17,401
6
$58,347
APPLICATIONS APPROVED, NOT ACCEPTED
0
$0
0
$0
10
$40,938
0
$0
0
$0
APPLICATIONS DENIED
0
$0
2
$36,345
34
$57,052
6
$11,478
2
$52,610
APPLICATIONS WITHDRAWN
0
$0
0
$0
52
$85,570
4
$17,695
0
$0
FILES CLOSED FOR INCOMPLETENESS
0
$0
0
$0
2
$23,915
0
$0
0
$0
Aggregated Statistics For Year 2001 (Based on 2 full tracts)
A) FHA, FSA/RHS & VA Home Purchase Loans
B) Conventional Home Purchase Loans
C) Refinancings
D) Home Improvement Loans
F) Non-occupant Loans on < 5 Family Dwellings (A B C & D)
Number
Average Value
Number
Average Value
Number
Average Value
Number
Average Value
Number
Average Value
LOANS ORIGINATED
15
$84,299
57
$80,715
107
$82,384
52
$12,471
6
$77,158
APPLICATIONS APPROVED, NOT ACCEPTED
0
$0
0
$0
17
$73,256
4
$83,215
0
$0
APPLICATIONS DENIED
2
$63,130
4
$69,345
38
$82,158
15
$29,715
2
$60,260
APPLICATIONS WITHDRAWN
2
$69,825
8
$98,759
46
$84,505
10
$12,626
0
$0
FILES CLOSED FOR INCOMPLETENESS
0
$0
0
$0
6
$83,215
2
$43,045
0
$0
Aggregated Statistics For Year 2000 (Based on 2 full tracts)
A) FHA, FSA/RHS & VA Home Purchase Loans
B) Conventional Home Purchase Loans
C) Refinancings
D) Home Improvement Loans
F) Non-occupant Loans on < 5 Family Dwellings (A B C & D)
Number
Average Value
Number
Average Value
Number
Average Value
Number
Average Value
Number
Average Value
LOANS ORIGINATED
13
$94,032
55
$81,563
31
$62,944
34
$20,143
2
$44,000
APPLICATIONS APPROVED, NOT ACCEPTED
0
$0
0
$0
10
$38,260
10
$23,530
0
$0
APPLICATIONS DENIED
2
$69,825
0
$0
21
$96,834
13
$54,005
0
$0
APPLICATIONS WITHDRAWN
0
$0
2
$77,475
15
$84,810
0
$0
0
$0
FILES CLOSED FOR INCOMPLETENESS
0
$0
0
$0
2
$62,175
2
$19,130
0
$0
Aggregated Statistics For Year 1999 (Based on 1 partial tract)
A) FHA, FSA/RHS & VA Home Purchase Loans
B) Conventional Home Purchase Loans
C) Refinancings
D) Home Improvement Loans
F) Non-occupant Loans on < 5 Family Dwellings (A B C & D)
Detailed PMIC statistics for the following Tracts:0248.00
2002 - 2018 National Fire Incident Reporting System (NFIRS) incidents
Based on the data from the years 2002 - 2018 the average number of fires per year is 9. The highest number of fire incidents - 17 took place in 2006, and the least - 1 in 2003. The data has a rising trend.
When looking into fire subcategories, the most incidents belonged to: Structure Fires (67.8%), and Outside Fires (12.8%).
Fire incident types reported to NFIRS in Zip Code 13461


 Nearest zip codes: 13421, 13478, 13476, 13477, 13409, 13163.


 Based on the data from the years 2002 - 2018 the average number of fires per year is 9. The highest number of fire incidents - 17 took place in 2006, and the least - 1 in 2003. The data has a rising trend.
 When looking into fire subcategories, the most incidents belonged to: Structure Fires (67.8%), and Outside Fires (12.8%).