Estimated zip code population in 2022: 39,514 Zip code population in 2010: 38,546 Zip code population in 2000: 36,076
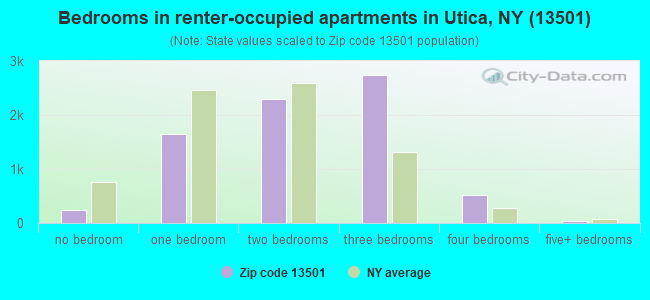
Houses and condos: 17,308 Renter-occupied apartments: 7,505
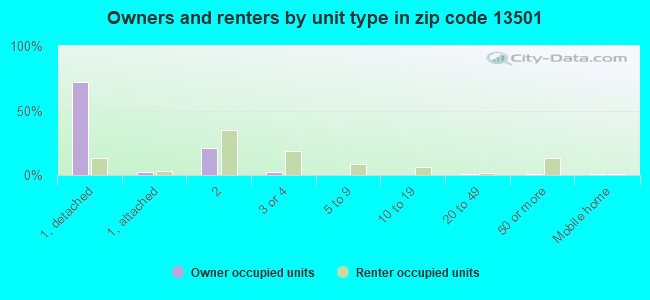
% of renters here:
49%
State:
46%
March 2022 cost of living index in zip code 13501: 99.5 (near average, U.S. average is 100)
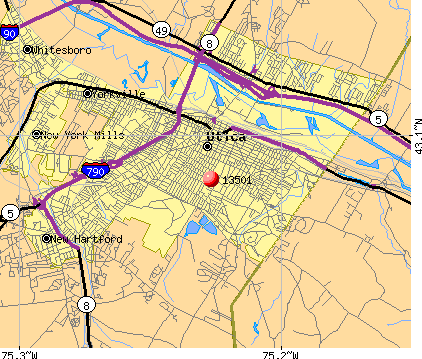
Land area: 8.7 sq. mi. Water area: 0.1 sq. mi.
Population density: 4,517 people per square mile
(average).
OSM Map
General Map
Google Map
MSN Map
OSM Map
General Map
Google Map
MSN Map
OSM Map
General Map
Google Map
MSN Map
OSM Map
General Map
Google Map
MSN Map
Please wait while loading the map...
Real estate property taxes paid for housing units in 2022:
This zip code:
2.3% ($3,117)
New York:
1.5% ($6,180)
Median real estate property taxes paid for housing units with mortgages in 2022: $3,463 (2.5%) Median real estate property taxes paid for housing units with no mortgage in 2022: $2,708 (2.1%)
Averages for the 2020 tax year for zip code 13501, filed in 2021:
Average Adjusted Gross Income (AGI) in 2020: $44,073 (Individual Income Tax Returns)
Here:
$44,073
State:
$90,930
Salary/wage: $36,777 (reported on 83.3% of returns)
Here:
$36,777
State:
$72,104
(% of AGI for various income ranges: 1159.6% for AGIs below $25k, 3455.5% for AGIs $25k-50k, 6498.9% for AGIs $50k-75k, 9366.4% for AGIs $75k-100k, 16287.8% for AGIs $100k-200k, 90618.3% for AGIs over 200k)
Taxable interest for individuals: $1,049 (reported on 25.6% of returns)
This zip code:
$1,049
New York:
$3,075
(% of AGI for various income ranges: 9.5% for AGIs below $25k, 13.0% for AGIs $25k-50k, 55.7% for AGIs $50k-75k, 93.6% for AGIs $75k-100k, 178.7% for AGIs $100k-200k, 1715.0% for AGIs over 200k)
Ordinary dividends: $4,743 (reported on 11.4% of returns)
Here:
$4,743
State:
$11,095
(% of AGI for various income ranges: 11.3% for AGIs below $25k, 16.7% for AGIs $25k-50k, 66.0% for AGIs $50k-75k, 199.5% for AGIs $75k-100k, 409.1% for AGIs $100k-200k, 5296.7% for AGIs over 200k)
Net capital gain/loss in AGI: +$7,660 (reported on 9.9% of returns)
Here:
+$7,660
State:
+$44,925
(% of AGI for various income ranges: 5.2% for AGIs below $25k, 11.9% for AGIs $25k-50k, 76.6% for AGIs $50k-75k, 280.8% for AGIs $75k-100k, 513.9% for AGIs $100k-200k, 9931.7% for AGIs over 200k)
Profit/loss from business: +$11,979 (reported on 12.5% of returns)
Here:
+$11,979
State:
+$14,940
(% of AGI for various income ranges: 114.8% for AGIs below $25k, 112.2% for AGIs $25k-50k, 181.2% for AGIs $50k-75k, 401.5% for AGIs $75k-100k, 704.8% for AGIs $100k-200k, 8111.7% for AGIs over 200k)
Taxable individual retirement arrangement distribution: $14,856 (reported on 5.6% of returns)
13501:
$14,856
New York:
$19,609
(% of AGI for various income ranges: 22.7% for AGIs below $25k, 30.3% for AGIs $25k-50k, 173.2% for AGIs $50k-75k, 364.2% for AGIs $75k-100k, 820.4% for AGIs $100k-200k, 3416.7% for AGIs over 200k)
Self-employed (Keogh) retirement plans: $23,475 (reported on 0.2% of returns)
13501:
$23,475
New York:
$32,497
(% of AGI for various income ranges: 173.9% for AGIs $100k-200k)
Total itemized deductions: $30,520 (reported on 2.5% of returns)
Here:
$30,520
State:
$39,326
(% of AGI for various income ranges: 12.4% for AGIs below $25k, 30.6% for AGIs $25k-50k, 154.0% for AGIs $50k-75k, 295.9% for AGIs $75k-100k, 644.3% for AGIs $100k-200k, 5496.7% for AGIs over 200k)
Charity contributions: $11,855 (reported on 1.8% of returns)
Here:
$11,855
State:
$15,420
(% of AGI for various income ranges: 2.7% for AGIs $25k-50k, 7.3% for AGIs $50k-75k, 48.3% for AGIs $75k-100k, 181.1% for AGIs $100k-200k, 3261.7% for AGIs over 200k)
Taxes paid: $7,472 (reported on 2.5% of returns)
13501:
$7,472
State:
$9,183
(% of AGI for various income ranges: 1.2% for AGIs below $25k, 6.4% for AGIs $25k-50k, 40.8% for AGIs $50k-75k, 91.0% for AGIs $75k-100k, 190.7% for AGIs $100k-200k, 903.3% for AGIs over 200k)
Earned income credit: $2,761 (reported on 30.5% of returns)
Here:
$2,761
State:
$2,138
(% of AGI for various income ranges: 153.0% for AGIs below $25k, 134.6% for AGIs $25k-50k, 2.4% for AGIs $50k-75k)
Percentage of individuals using paid preparers for their 2020 taxes: 93.5%
Here:
94%
State:
95%
(% for various income ranges: 93.1% for AGIs below $25k, 93.9% for AGIs $25k-50k, 93.3% for AGIs $50k-75k, 94.8% for AGIs $75k-100k, 93.1% for AGIs $100k-200k, 95.7% for AGIs over 200k)
Averages for the 2012 tax year for zip code 13501, filed in 2013:
Average Adjusted Gross Income (AGI) in 2012: $36,611 (Individual Income Tax Returns)
Here:
$36,611
State:
$77,088
Salary/wage: $31,007 (reported on 83.8% of returns)
Here:
$31,007
State:
$60,593
(% of AGI for various income ranges: 78.3% for AGIs below $25k, 81.7% for AGIs $25k-50k, 70.3% for AGIs $50k-75k, 70.5% for AGIs $75k-100k, 66.9% for AGIs $100k-200k, 49.1% for AGIs over 200k)
Taxable interest for individuals: $986 (reported on 28.6% of returns)
This zip code:
$986
New York:
$3,125
(% of AGI for various income ranges: 0.8% for AGIs below $25k, 0.6% for AGIs $25k-50k, 0.8% for AGIs $50k-75k, 0.8% for AGIs $75k-100k, 0.8% for AGIs $100k-200k, 1.0% for AGIs over 200k)
Ordinary dividends: $5,777 (reported on 14.4% of returns)
Here:
$5,777
State:
$10,299
(% of AGI for various income ranges: 0.9% for AGIs below $25k, 0.9% for AGIs $25k-50k, 1.8% for AGIs $50k-75k, 1.5% for AGIs $75k-100k, 1.8% for AGIs $100k-200k, 8.4% for AGIs over 200k)
Net capital gain/loss in AGI: +$3,974 (reported on 9.6% of returns)
Here:
+$3,974
State:
+$42,474
(% of AGI for various income ranges: 0.3% for AGIs $25k-50k, 0.4% for AGIs $50k-75k, 0.9% for AGIs $75k-100k, 1.0% for AGIs $100k-200k, 4.7% for AGIs over 200k)
Profit/loss from business: +$13,125 (reported on 12.6% of returns)
Here:
+$13,125
State:
+$16,168
(% of AGI for various income ranges: 7.0% for AGIs below $25k, 2.2% for AGIs $25k-50k, 1.7% for AGIs $50k-75k, 2.0% for AGIs $75k-100k, 5.7% for AGIs $100k-200k, 8.7% for AGIs over 200k)
Taxable individual retirement arrangement distribution: $10,005 (reported on 7.3% of returns)
13501:
$10,005
New York:
$17,621
(% of AGI for various income ranges: 1.4% for AGIs below $25k, 1.5% for AGIs $25k-50k, 2.3% for AGIs $50k-75k, 3.0% for AGIs $75k-100k, 2.6% for AGIs $100k-200k, 1.8% for AGIs over 200k)
Self-employment retirement plans: $32,283 (reported on 0.4% of returns)
13501:
$32,283
New York:
$27,330
Total itemized deductions: $20,872 (21% of AGI, reported on 15.9% of returns)
Here:
$20,872
State:
$34,985
Here:
21.2% of AGI
State:
21.3% of AGI
(% of AGI for various income ranges: 4.3% for AGIs below $25k, 5.9% for AGIs $25k-50k, 9.8% for AGIs $50k-75k, 10.2% for AGIs $75k-100k, 12.5% for AGIs $100k-200k, 14.5% for AGIs over 200k)
Charity contributions: $3,237 (reported on 12.1% of returns)
Here:
$3,237
State:
$5,572
(% of AGI for various income ranges: 0.2% for AGIs below $25k, 0.5% for AGIs $25k-50k, 0.8% for AGIs $50k-75k, 1.2% for AGIs $75k-100k, 1.6% for AGIs $100k-200k, 2.7% for AGIs over 200k)
Taxes paid: $9,385 (reported on 15.8% of returns)
13501:
$9,385
State:
$18,656
(% of AGI for various income ranges: 0.9% for AGIs below $25k, 1.8% for AGIs $25k-50k, 3.3% for AGIs $50k-75k, 4.5% for AGIs $75k-100k, 6.9% for AGIs $100k-200k, 9.0% for AGIs over 200k)
Earned income credit: $2,621 (reported on 34.8% of returns)
Here:
$2,621
State:
$2,230
(% of AGI for various income ranges: 10.8% for AGIs below $25k, 2.0% for AGIs $25k-50k)
Percentage of individuals using paid preparers for their 2012 taxes: 46.6%
Here:
47%
State:
66%
(% for various income ranges: 42.1% for AGIs below $25k, 45.5% for AGIs $25k-50k, 53.4% for AGIs $50k-75k, 58.9% for AGIs $75k-100k, 67.1% for AGIs $100k-200k, 88.2% for AGIs over 200k)
Averages for the 2004 tax year for zip code 13501, filed in 2005:
Average Adjusted Gross Income (AGI) in 2004: $30,850 (Individual Income Tax Returns)
Here:
$30,850
State:
$59,519
Salary/wage: $27,276 (reported on 83.4% of returns)
Here:
$27,276
State:
$50,673
(% of AGI for various income ranges: 92.9% for AGIs below $10k, 82.1% for AGIs $10k-25k, 81.6% for AGIs $25k-50k, 74.7% for AGIs $50k-75k, 74.6% for AGIs $75k-100k, 54.9% for AGIs over 100k)
Taxable interest for individuals: $1,554 (reported on 40.0% of returns)
This zip code:
$1,554
New York:
$2,377
(% of AGI for various income ranges: 4.0% for AGIs below $10k, 2.0% for AGIs $10k-25k, 1.9% for AGIs $25k-50k, 2.1% for AGIs $50k-75k, 1.6% for AGIs $75k-100k, 2.0% for AGIs over 100k)
Taxable dividends: $2,733 (reported on 20.5% of returns)
Here:
$2,733
State:
$5,394
(% of AGI for various income ranges: 3.2% for AGIs below $10k, 1.0% for AGIs $10k-25k, 1.1% for AGIs $25k-50k, 1.9% for AGIs $50k-75k, 1.7% for AGIs $75k-100k, 2.9% for AGIs over 100k)
Net capital gain/loss: +$4,494 (reported on 15.0% of returns)
Here:
+$4,494
State:
+$23,581
(% of AGI for various income ranges: -1.4% for AGIs below $10k, 0.2% for AGIs $10k-25k, 0.4% for AGIs $25k-50k, 0.7% for AGIs $50k-75k, 1.7% for AGIs $75k-100k, 7.4% for AGIs over 100k)
Profit/loss from business: +$11,559 (reported on 11.5% of returns)
Here:
+$11,559
State:
+$13,809
(% of AGI for various income ranges: 5.6% for AGIs below $10k, 3.4% for AGIs $10k-25k, 1.6% for AGIs $25k-50k, 2.5% for AGIs $50k-75k, 2.8% for AGIs $75k-100k, 9.5% for AGIs over 100k)
IRA payment deduction: $2,545 (reported on 1.7% of returns)
13501:
$2,545
New York:
$3,115
(% of AGI for various income ranges: 0.2% for AGIs below $10k, 0.2% for AGIs $10k-25k, 0.2% for AGIs $25k-50k, 0.2% for AGIs $50k-75k, 0.1% for AGIs $75k-100k, 0.1% for AGIs over 100k)
Self-employed pension: $15,847 (reported on 0.7% of returns)
Here:
$15,847
New York:
$19,016
(% of AGI for various income ranges: 0.1% for AGIs $25k-50k, 0.1% for AGIs $50k-75k, 0.2% for AGIs $75k-100k, 1.2% for AGIs over 100k)
Total itemized deductions: $17,618 (21% of AGI, reported on 15.9% of returns)
Here:
$17,618
State:
$25,864
Here:
20.9% of AGI
State:
21.9% of AGI
(% of AGI for various income ranges: 6.8% for AGIs below $10k, 3.1% for AGIs $10k-25k, 6.4% for AGIs $25k-50k, 10.2% for AGIs $50k-75k, 12.3% for AGIs $75k-100k, 14.8% for AGIs over 100k)
Charity contributions deductions: $3,238 (4% of AGI, reported on 14.3% of returns)
Here:
$3,238
State:
$4,439
Here:
3.6% of AGI
State:
3.6% of AGI
(% of AGI for various income ranges: 0.4% for AGIs below $10k, 0.4% for AGIs $10k-25k, 0.9% for AGIs $25k-50k, 1.7% for AGIs $50k-75k, 2.1% for AGIs $75k-100k, 2.8% for AGIs over 100k)
Total tax: $4,934 (reported on 62.6% of returns)
13501:
$4,934
State:
$11,730
(% of AGI for various income ranges: 2.1% for AGIs below $10k, 3.4% for AGIs $10k-25k, 6.7% for AGIs $25k-50k, 9.6% for AGIs $50k-75k, 11.0% for AGIs $75k-100k, 19.8% for AGIs over 100k)
Earned income credit: $1,962 (reported on 28.6% of returns)
Here:
$1,962
State:
$1,757
Percentage of individuals using paid preparers for their 2004 taxes: 60.3%
Here:
60%
State:
67%
(% for various income ranges: 58.8% for AGIs below $10k, 60.3% for AGIs $10k-25k, 58.4% for AGIs $25k-50k, 63.2% for AGIs $50k-75k, 61.0% for AGIs $75k-100k, 74.2% for AGIs over 100k)
Likely homosexual households (counted as self-reported same-sex unmarried-partner households)
Lesbian couples: 0.2% of all households
Gay men: 0.1% of all households
Household received Food Stamps/SNAP in the past 12 months: 5,099 Household did not receive Food Stamps/SNAP in the past 12 months: 10,473
Women who had a birth in the past 12 months: 906 (475 now married, 440 unmarried) Women who did not have a birth in the past 12 months: 8,395 (3,002 now married, 5,396 unmarried)
Housing units in zip code 13501 with a mortgage: 3,819 (396 second mortgage, 7 home equity loan, 362 both second mortgage and home equity loan) Houses without a mortgage: 332
Median monthly owner costs for units with a mortgage: $1,226 Median monthly owner costs for units without a mortgage: $605
Residents with income below the poverty level in 2022:
This zip code:
28.1%
Whole state:
14.3%
Residents with income below 50% of the poverty level in 2022:
This zip code:
14.3%
Whole state:
6.8%
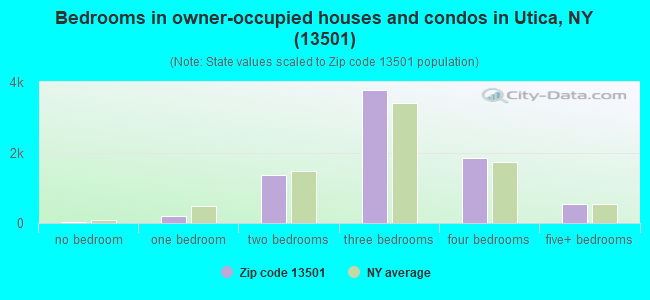
Median number of rooms in houses and condos:
Here:
6.3
State:
6.3
Median number of rooms in apartments:
Here:
4.8
State:
3.8
Notable locations in this zip code not listed on our city pages
Notable locations in zip code 13501: Val Bialas Ski Area (A), Valley View Golf (B), Chancellor Square (C), Victor A Perretta Twin Towers (D), Rocco Deperno Benefit Center (E), Strand Theatre (F), Saint Pauls Day Care Center (G), Utica Public Library (H), Childrens Museum (I), Utica City Fire Department Engine 2 and Tower 2 (J), Oneida County Court House (K), Utica State Office Building (L), Macartovin Apartments for the Elderly (M), Mayro Building (N), Masonic Home (O), Utica Fire Department Station 3 Engine 3 and Special Hazards Company (P), Saint Joseph's Nursing Home (Q), Eden Park Nursing Home (R), Wiley Hall (S), Paul Building (T). Display/hide their locations on the map
Churches in zip code 13501 include: Payne's Temple Church of God (A), Saint Basils Melkite Catholic Church (B), Church of the Nazarene (C), United Church of Christ (D), Christian and Missionary Alliance Church (E), Saint Mary Blessed Sacrament Church (F), Kingdom Hall of Jehovahs Witnesses (G), All Saints Episcopal Church (H), Beth-El Congregation Temple House (I). Display/hide their locations on the map
Parks in zip code 13501 include: Steuben Park (1), Johnson Park (2), Roscoe Conkling Park (3), Proctor Park (4), Richard P Conner Park (5), Fort Schuyler Park (6), Harry V Quinn Playground (7), Kernan Park (8), Watson Williams Park (9). Display/hide their locations on the map
4,930 married couples with children.
4,042 single-parent households (561 men, 3,481 women).
60.6% of residents of 13501 zip code speak English at home.
9.0% of residents speak Spanish at home (59% very well, 23% well, 11% not well, 6% not at all).
13.3% of residents speak other Indo-European language at home (55% very well, 22% well, 18% not well, 6% not at all).
12.8% of residents speak Asian or Pacific Island language at home (41% very well, 21% well, 22% not well, 16% not at all).
4.2% of residents speak other language at home (74% very well, 18% well, 7% not well).
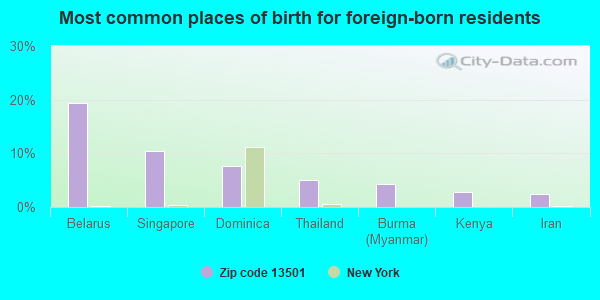
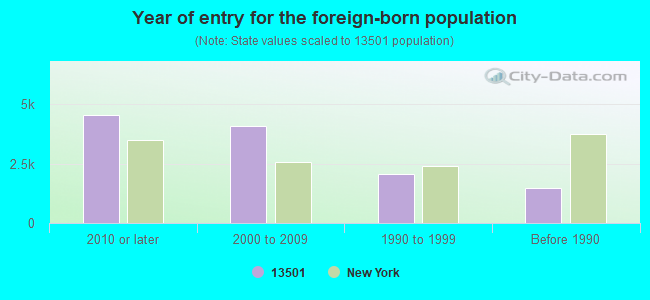
Foreign born population: 10,567 (26.7%) (60.3% of them are naturalized citizens)
Major facilities with environmental interests located in this zip code:
CONMED CORPORATION (310 BROAD ST in UTICA, NY)
AIR SYNTHETIC MINOR (AIRS/AFS) STATE MASTER (New York facility tracking) - AIR PROGRAM Small Quantity Generators, between 100 kg and 1000 kg of hazardous waste/month (Resource Conservation and Recovery Act (tracking hazardous waste)) Business SIC classification: UNSUPPORTED PLASTICS PROFILE SHAPES; MEDICAL, DENTAL, AND HOSPITAL EQUIPMENT AND SUPPLIES Alternative names: COM MED CORP, CON MED CORPORATION
ALBANY ES (1151 ALBANY STREET in UTICA, NY)
(National Center for Education Statistics) - STATE ID-412300010003 Organizations: UTICA CITY SD (SCHOOL DISTRICT)
HUGH R. JONES ES ( in UTICA, NY)
(National Center for Education Statistics) - STATE ID-412300010009 Organizations: UTICA CITY SD (SCHOOL DISTRICT)
CHRISTOPHER COLUMBUS ES ( in UTICA, NY)
(National Center for Education Statistics) - STATE ID-412300010005 Organizations: UTICA CITY SD (SCHOOL DISTRICT)
HAMILTON DIGITAL CONTROLS INC (204 TURNER ST in UTICA, NY)
(Resource Conservation and Recovery Act (tracking hazardous waste)) Organizations: JOHN DELMONTE (CONTACT/OWNER)
ADREAN TERRACE MUNICIPAL HOUSING AUTH (1736 ARMORY DR in UTICA, NY)
(Resource Conservation and Recovery Act (tracking hazardous waste))
ADREANS BODY WORKS (912 SOUTH ST in UTICA, NY)
(Resource Conservation and Recovery Act (tracking hazardous waste))
AFFILIATED COMPUTER SERVICES (501 BLEECKER ST in UTICA, NY)
(Resource Conservation and Recovery Act (tracking hazardous waste)) Alternative names: FOUNTAINHEAD GROUP INC THE
AMERICAN DRY CLEANING EQUIPMENT (1300 BROAD STREET in UTICA, NY)
AIR MINOR (AIRS/AFS) Business SIC classification: DRYCLEANING PLANTS, EXCEPT RUG CLEANING
J & R AUTO SERVICE (2660 ONEIDA ST in UTICA, NY)
(Resource Conservation and Recovery Act (tracking hazardous waste))
CONTINENTAL BAKING COMPANY ROCHESTER (601 SECOND STREET in UTICA, NY)
(Resource Conservation and Recovery Act (tracking hazardous waste)) Alternative names: WONDER BREAD BAKERY
HARZA ENGINEERING CO. (181 GENESEE STREET in UTICA, NY)
ENFORCEMENT/COMPLIANCE ACTIVITY (Integrated Compliance Information System) COMPLIANCE ACTIVITY (Tracking inspections of insecticide, fungicide, and rodenticide, and toxic substances) Business SIC classification: BUSINESS SERVICES
Housing units lacking complete plumbing facilities: 1.1% Housing units lacking complete kitchen facilities: 2.3%
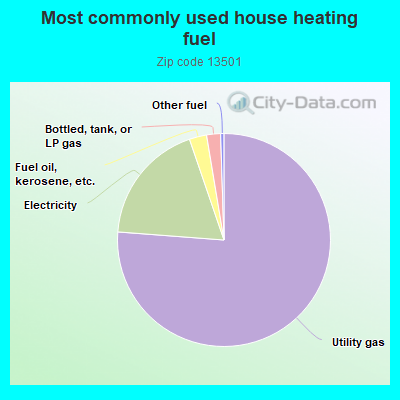
75.6%Utility gas
18.4%Electricity
2.6%Fuel oil, kerosene, etc.
2.1%Bottled, tank, or LP gas
0.5%Other fuel
Population in 1990: 40,223.
Place of birth for U.S.-born residents:
This state: 24,472
Northeast: 1,144
Midwest: 369
South: 925
West: 638
60% of the 13501 zip code residents lived in the same house 5 years ago. Out of people who lived in different houses, 73% lived in this county. Out of people who lived in different counties, 50% lived in New York.
88% of the 13501 zip code residents lived in the same house 1 year ago. Out of people who lived in different houses, 63% moved from this county. Out of people who lived in different houses, 28% moved from different county within same state. Out of people who lived in different houses, 5% moved from different state. Out of people who lived in different houses, 3% moved from abroad.
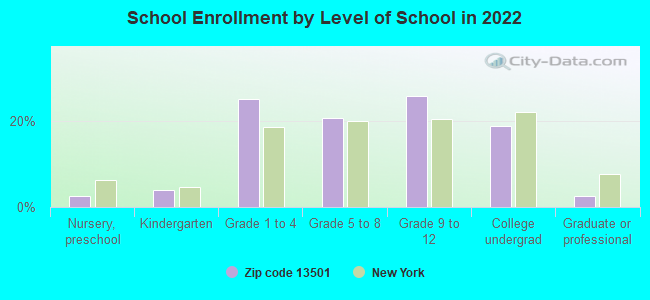
Private vs. public school enrollment:
Students in private schools in grades 1 to 8 (elementary and middle school): 274
Here:
5.6%
New York:
15.6%
Students in private schools in grades 9 to 12 (high school): 213
Here:
7.7%
New York:
15.0%
Students in private undergraduate colleges: 499
Here:
24.8%
New York:
39.2%
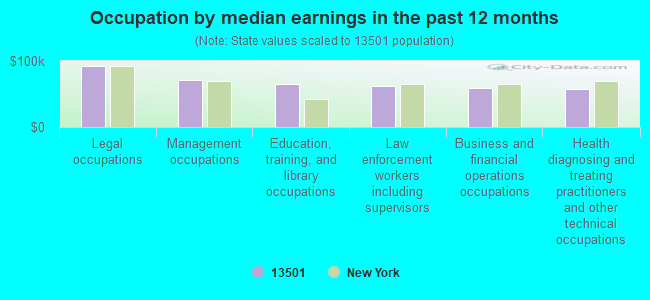
Occupation by median earnings in the past 12 months ($)
92,187Legal occupations
71,370Management occupations
64,396Education, training, and library occupations
61,700Law enforcement workers including supervisors
59,437Business and financial operations occupations
57,599Health diagnosing and treating practitioners and other technical occupations
Companies with biggest federal contracts located in this zip code (UTICA, NY):
HUMAN TECHNOLOGIES CORPORATION (2260 DWYER AVE) : $13,069,115 in 71 contractsfrom 1999 to 2006
Contracts for Clothing, Special Purpose, Custodial Janitorial Services, Outerwear, Men's, Safety and Rescue Equipment, and moreby Defense Logistics Agency, Public Buildings Service, Air Force, Army, and others Signed by year:2000: $1,800,710; 2001: $1,380,281; 2002: $2,962,234; 2003: $1,318,549; 2004: $2,995,609; 2005: $1,704,302; 2006: $781,871.
Biggest contracts:
$1,762,200 with Defense Logistics Agency for Clothing, Special Purpose. Signed on 2002-02-07. Completion date: 2003-09-03.
$1,323,468, same as above.Signed on 2004-08-25. Completion date: 2005-10-05.
$631,140 with Public Buildings Service for Custodial Janitorial Services. Signed on 2001-05-15. Completion date: 2001-12-15.
$563,555 with Air Force for Custodial Janitorial Services. Signed on 2004-10-01. Completion date: 2005-09-30.
CAPRARO TECHNOLOGIES INC (311 TURNER ST STE 410; small business) : $1,590,362 in 11 contractsfrom 2000 to 2006
Contracts for Manufacturing Technology -- Operational Systems Development (R&D), Other Defense -- Operational Systems Development (R&D), Other Defense -- Basic Research (R&D), Defense Missile and Space Systems -- Basic Research (R&D), and moreby Air Force, Missile Defense Agency Signed by year:2000: $29,786; 2001: $99,688; 2002: $252,043; 2003: $269,870; 2004: $450,000; 2005: $389,002; 2006: $99,973.
Biggest contracts:
$450,000 with Air Force for Manufacturing Technology -- Operational Systems Development (R&D). Signed on 2004-07-14. Completion date: 2006-11-13.
$299,935, same as above.Signed on 2005-02-23. Completion date: 2006-11-13.
$252,043 with Air Force for Other Defense -- Operational Systems Development (R&D). Signed on 2002-08-13. Completion date: 2004-08-06.
$150,000 with Air Force for Other Defense -- Basic Research (R&D). Signed on 2003-09-11. Completion date: 2004-12-10.
ONEIDA COUNTY CHAPTER NYS ASSO (245 GENESEE ST) : $1,555,575 in 12 contractsfrom 1999 to 2006
Contracts for Custodial Janitorial Services by Air Force, Department of Veterans Affairs Signed by year:2000: $212,395; 2001: $229,638; 2002: $240,408; 2003: $205,127; 2004: $189,282; 2005: $168,629; 2006: -$887.
Biggest contracts:
$240,408 with Air Force for Custodial Janitorial Services. Signed on 2002-10-01. Completion date: 2003-09-30.
$229,638, same as above.Signed on 2001-10-11. Completion date: 2002-09-30.
$212,395, same as above.Signed on 2000-10-30. Completion date: 2001-09-30.
$204,983, same as above.Signed on 1999-10-01. Completion date: 2000-09-30.
CRITICAL TECHNOLOGIES INC (1001 BROAD ST, STE 400; small business) : $1,253,637 in 12 contractsfrom 2001 to 2006
Contracts for Invalid code: AR52, Space Science and Applications -- Operational Systems Development (R&D), Other Research and Development -- Engineering Development (R&D), Other Defense -- Management and Support (R&D), and moreby Navy, Office of Policy, Management and Budget/Chief Financial Officer, Army Signed by year:2000: $0; 2001: $69,856; 2002: $449,862; 2003: $539,325; 2004: $99,909; 2005: $24,988; 2006: $69,697.
Biggest contracts:
$350,000 with Navy for Invalid code: AR52. Signed on 2002-05-30. Completion date: 2004-05-30.
$174,990 with Navy for Space Science and Applications -- Operational Systems Development (R&D). Signed on 2003-05-13. Completion date: 2003-11-30.
$149,413 with Navy for Invalid code: AR52. Signed on 2003-12-22. Completion date: 2004-06-22.
$99,909 with Office of Policy, Management and Budget/Chief Financial Officer for Other Research and Development -- Engineering Development (R&D). Signed on 2004-03-23. Effective on 2004-04-01. Completion date: 2004-04-01.
WASTE MANAGEMENT OF NEW YORK L (2003 BLEECKER STREET) : $777,745 in 16 contractsfrom 1999 to 2005
Contracts for Trash/Garbage Collection Services - Including Portable Sanitation Services by Air Force Signed by year:2000: $128,768; 2001: $113,809; 2002: $80,398; 2003: $106,820; 2004: $139,627; 2005: $76,016; 2006: $0.
Biggest contracts:
$132,307 with Air Force for Trash/Garbage Collection Services - Including Portable Sanitation Services. Signed on 1999-10-20. Completion date: 2000-09-30.
$128,768, same as above.Signed on 2000-11-13. Completion date: 2001-09-30.
$125,163, same as above.Signed on 2003-10-01. Completion date: 2005-09-30.
$113,809, same as above.Signed on 2002-11-14. Completion date: 2003-09-30.
TRENTON TECHNOLOGY, INC (1001 BROAD ST; small business)
$390,800 with Navy for Electrical and Electronic assemblies, Boards, Cards, and Associated Hardware. Signed on 2005-08-23. Completion date: 2005-10-28.
OCUTO & ASSOCIATES, INC (239 GENESEE ST, 410 MAYRO; small business) : $284,985 in 4 contractsfrom 2005 to 2006
$290,028 with Air Force for Snow Removal/Salt Service (also spreading aggregate or other snow melting material). Signed on 2005-11-17. Completion date: 2006-10-31.
$18,972 with Air Force for Maintenance, Repair or Alteration of Real Property -- Highways, Roads, Streets, Bridges, and Railways (includes resurfacing). Signed on 2006-03-29. Completion date: 2006-06-26.
$518 with Air Force for Snow Removal/Salt Service (also spreading aggregate or other snow melting material). Signed on 2006-02-16. Completion date: 2006-10-31.
-$24,533, same as above.Signed on 2006-05-23. Completion date: 2006-10-31.
TOWNE ENGINEERING (18 SOUTH STREET; small business) : $216,024 in 10 contractsfrom 1999 to 2004
Contracts for Administrative and Service Buildings, Other Architect and Engineering Services by Air Force Signed by year:2000: $58,818; 2001: $10,394; 2002: $0; 2003: $39,361; 2004: $100,575; 2005: $0; 2006: $0.
Biggest contracts:
$55,173 with Air Force for Administrative and Service Buildings. Signed on 2004-09-30. Completion date: 2005-01-30.
$39,361 with Air Force for Other Architect and Engineering Services. Signed on 2003-02-07. Completion date: 2003-05-01.
$29,763, same as above.Signed on 2000-05-11. Completion date: 2000-08-31.
$23,268 with Air Force for Administrative and Service Buildings. Signed on 2004-09-30. Completion date: 2005-01-30.
COUNTY OF ONEIDA, NEWYORK (800 PARK AVE) : $138,412 in 5 contractsfrom 1999 to 2006
Contracts for Lease or Rental of Facilities -- Other Airfield Structures, Lease or Rental of Equipment -- Aircraft and Airframe Structural Components by Air Force Signed by year:2000: $0; 2001: $28,836; 2002: $34,216; 2003: $0; 2004: $0; 2005: $23,262; 2006: $23,262.
Biggest contracts:
$34,216 with Air Force for Lease or Rental of Facilities -- Other Airfield Structures. Signed on 2002-03-14. Completion date: 2003-03-31.
$28,836, same as above.Signed on 2001-03-15. Completion date: 2002-03-31.
$28,836, same as above.Signed on 1999-12-22. Completion date: 2001-03-31.
$23,262, same as above.Signed on 2006-03-30. Completion date: 2007-03-31.
HUMAN ELECTRONICS INC (155 GENESEE ST; small business)
$79,946 with Navy for Defense Electronics and Communication Equipment -- Basic Research (R&D). Signed on 2005-04-11. Completion date: 2005-10-15.
Top industries in this zip code by the number of employees in 2005:
Health Care and Social Assistance: Services for the Elderly and Persons with Disabilities (over 1000 employees: 1 establishment, 100-249 employees: 1 establishment, 10-19 employees: 1 establishment, 1-4 employees: 1 establishment)
Health Care and Social Assistance: General Medical and Surgical Hospitals (over 1000: 1)
Health Care and Social Assistance: Nursing Care Facilities (500-999: 1, 100-249: 4, 5-9: 1)
Administrative and Support and Waste Management and Remediation Services: Telemarketing Bureaus (500-999: 1, 100-249: 1, 5-9: 1)
Information: Data Processing, Hosting, and Related Services (500-999: 1, 10-19: 1, 1-4: 2)
Health Care and Social Assistance: Child Day Care Services (100-249: 1, 20-49: 5, 10-19: 5, 5-9: 1, 1-4: 3)
Information: Newspaper Publishers (250-499: 1)
Finance and Insurance: Savings Institutions (100-249: 2, 1-4: 2)
Health Care and Social Assistance: Offices of Physicians (except Mental Health Specialists) (50-99: 2, 10-19: 5, 5-9: 8, 1-4: 12)
People in group quarters in 2010:
807 people in nursing facilities/skilled-nursing facilities
493 people in college/university student housing
99 people in residential treatment centers for adults
87 people in emergency and transitional shelters (with sleeping facilities) for people experiencing homelessness
87 people in group homes intended for adults
50 people in other noninstitutional facilities
43 people in group homes for juveniles (non-correctional)
7 people in workers' group living quarters and job corps centers
People in group quarters in 2000:
930 people in nursing homes
301 people in college dormitories (includes college quarters off campus)
199 people in homes for the mentally retarded
197 people in mental (psychiatric) hospitals or wards
114 people in other noninstitutional group quarters
41 people in other nonhousehold living situations
22 people in homes for the mentally ill
17 people in other group homes
15 people in homes or halfway houses for drug/alcohol abuse
8 people in homes for abused, dependent, and neglected children
Fatal accident statistics in 2014:
Fatal accident count: 1
Vehicles involved in fatal accidents: 1
Fatal accidents caused by drunken drivers: 0
Fatalities: 1
Persons involved in fatal accidents: 1
Pedestrians involved in fatal accidents: 1
Fatal accident statistics in 2011:
Fatal accident count: 4
Vehicles involved in fatal accidents: 6
Fatal accidents caused by drunken drivers: 3
Fatalities: 4
Persons involved in fatal accidents: 7
Pedestrians involved in fatal accidents: 1
Home Mortgage Disclosure Act Aggregated Statistics For Year 2009 (Based on 18 full and 6 partial tracts)
A) FHA, FSA/RHS & VA Home Purchase Loans
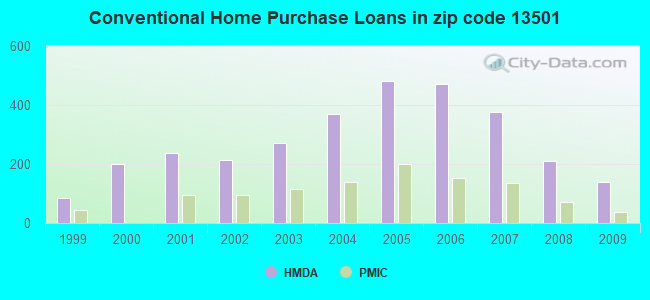
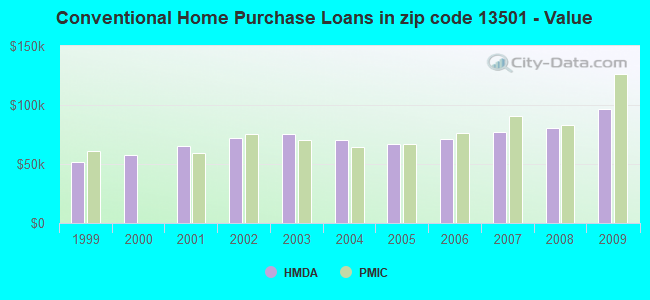
B) Conventional Home Purchase Loans
C) Refinancings
D) Home Improvement Loans
E) Loans on Dwellings For 5+ Families
F) Non-occupant Loans on < 5 Family Dwellings (A B C & D)
Number
Average Value
Number
Average Value
Number
Average Value
Number
Average Value
Number
Average Value
Number
Average Value
LOANS ORIGINATED
153
$79,386
138
$97,021
271
$88,711
125
$18,999
0
$0
23
$63,337
APPLICATIONS APPROVED, NOT ACCEPTED
0
$0
11
$103,573
42
$87,396
16
$55,586
2
$17,820
2
$34,000
APPLICATIONS DENIED
35
$62,372
31
$59,064
184
$89,635
180
$14,031
6
$111,393
33
$50,031
APPLICATIONS WITHDRAWN
9
$99,702
12
$88,848
108
$94,646
6
$58,042
0
$0
5
$34,874
FILES CLOSED FOR INCOMPLETENESS
1
$39,000
5
$65,412
22
$85,509
0
$0
0
$0
1
$47,930
Aggregated Statistics For Year 2008 (Based on 18 full and 6 partial tracts)
A) FHA, FSA/RHS & VA Home Purchase Loans
B) Conventional Home Purchase Loans
C) Refinancings
D) Home Improvement Loans
E) Loans on Dwellings For 5+ Families
F) Non-occupant Loans on < 5 Family Dwellings (A B C & D)
G) Loans On Manufactured Home Dwelling (A B C & D)
Number
Average Value
Number
Average Value
Number
Average Value
Number
Average Value
Number
Average Value
Number
Average Value
Number
Average Value
LOANS ORIGINATED
139
$79,876
211
$80,144
248
$86,710
202
$19,488
5
$105,754
38
$61,320
2
$11,870
APPLICATIONS APPROVED, NOT ACCEPTED
2
$65,280
16
$130,342
37
$83,754
21
$17,536
0
$0
0
$0
0
$0
APPLICATIONS DENIED
20
$72,586
70
$66,405
284
$90,536
324
$20,620
6
$496,273
62
$64,061
3
$61,260
APPLICATIONS WITHDRAWN
13
$101,175
20
$111,740
79
$102,140
24
$43,325
2
$198,000
8
$61,072
1
$66,000
FILES CLOSED FOR INCOMPLETENESS
7
$95,000
7
$126,954
7
$63,111
2
$5,940
0
$0
0
$0
0
$0
Aggregated Statistics For Year 2007 (Based on 18 full and 6 partial tracts)
A) FHA, FSA/RHS & VA Home Purchase Loans
B) Conventional Home Purchase Loans
C) Refinancings
D) Home Improvement Loans
E) Loans on Dwellings For 5+ Families
F) Non-occupant Loans on < 5 Family Dwellings (A B C & D)
G) Loans On Manufactured Home Dwelling (A B C & D)
Number
Average Value
Number
Average Value
Number
Average Value
Number
Average Value
Number
Average Value
Number
Average Value
Number
Average Value
LOANS ORIGINATED
99
$77,975
377
$76,752
327
$68,993
317
$19,527
8
$124,921
84
$56,783
0
$0
APPLICATIONS APPROVED, NOT ACCEPTED
2
$59,500
78
$67,708
80
$80,002
49
$29,465
2
$199,880
34
$55,526
2
$64,500
APPLICATIONS DENIED
10
$93,521
134
$72,244
381
$78,794
449
$22,814
3
$2,484,267
101
$51,625
5
$41,834
APPLICATIONS WITHDRAWN
10
$96,151
45
$94,358
178
$79,366
21
$55,992
2
$239,855
20
$51,358
0
$0
FILES CLOSED FOR INCOMPLETENESS
2
$75,000
23
$120,165
44
$92,307
8
$45,972
2
$766,555
10
$66,638
0
$0
Aggregated Statistics For Year 2006 (Based on 18 full and 6 partial tracts)
A) FHA, FSA/RHS & VA Home Purchase Loans
B) Conventional Home Purchase Loans
C) Refinancings
D) Home Improvement Loans
E) Loans on Dwellings For 5+ Families
F) Non-occupant Loans on < 5 Family Dwellings (A B C & D)
G) Loans On Manufactured Home Dwelling (A B C & D)
Number
Average Value
Number
Average Value
Number
Average Value
Number
Average Value
Number
Average Value
Number
Average Value
Number
Average Value
LOANS ORIGINATED
126
$78,404
471
$70,913
390
$69,103
516
$18,381
6
$53,780
138
$55,175
2
$78,100
APPLICATIONS APPROVED, NOT ACCEPTED
6
$81,478
75
$68,417
105
$67,334
51
$17,259
2
$80,800
36
$58,904
0
$0
APPLICATIONS DENIED
13
$78,375
154
$62,255
452
$76,066
596
$21,084
6
$144,895
117
$41,768
7
$27,774
APPLICATIONS WITHDRAWN
4
$75,500
71
$80,284
257
$74,551
40
$56,713
0
$0
37
$67,914
0
$0
FILES CLOSED FOR INCOMPLETENESS
0
$0
34
$81,872
71
$93,153
13
$35,342
1
$25,000
17
$79,598
0
$0
Aggregated Statistics For Year 2005 (Based on 18 full and 6 partial tracts)
A) FHA, FSA/RHS & VA Home Purchase Loans
B) Conventional Home Purchase Loans
C) Refinancings
D) Home Improvement Loans
E) Loans on Dwellings For 5+ Families
F) Non-occupant Loans on < 5 Family Dwellings (A B C & D)
G) Loans On Manufactured Home Dwelling (A B C & D)
Number
Average Value
Number
Average Value
Number
Average Value
Number
Average Value
Number
Average Value
Number
Average Value
Number
Average Value
LOANS ORIGINATED
118
$64,674
483
$67,200
428
$64,646
295
$26,557
6
$60,297
155
$50,780
3
$48,320
APPLICATIONS APPROVED, NOT ACCEPTED
5
$45,708
48
$55,294
117
$65,220
56
$23,459
0
$0
27
$44,463
1
$93,450
APPLICATIONS DENIED
11
$82,958
107
$54,610
582
$70,596
450
$23,368
4
$2,448,022
122
$27,150
9
$43,674
APPLICATIONS WITHDRAWN
8
$51,105
60
$68,121
407
$79,380
38
$56,126
1
$60,000
26
$82,420
6
$77,225
FILES CLOSED FOR INCOMPLETENESS
0
$0
22
$87,369
74
$82,228
4
$58,560
0
$0
4
$76,955
0
$0
Aggregated Statistics For Year 2004 (Based on 18 full and 6 partial tracts)
A) FHA, FSA/RHS & VA Home Purchase Loans
B) Conventional Home Purchase Loans
C) Refinancings
D) Home Improvement Loans
E) Loans on Dwellings For 5+ Families
F) Non-occupant Loans on < 5 Family Dwellings (A B C & D)
G) Loans On Manufactured Home Dwelling (A B C & D)
Number
Average Value
Number
Average Value
Number
Average Value
Number
Average Value
Number
Average Value
Number
Average Value
Number
Average Value
LOANS ORIGINATED
154
$62,951
368
$70,379
462
$71,022
250
$17,595
2
$150,045
93
$46,455
0
$0
APPLICATIONS APPROVED, NOT ACCEPTED
2
$46,500
29
$57,245
115
$72,233
20
$26,213
0
$0
4
$70,918
2
$67,745
APPLICATIONS DENIED
12
$53,902
85
$57,509
543
$68,993
237
$23,880
3
$1,170,617
58
$49,022
6
$47,000
APPLICATIONS WITHDRAWN
18
$45,747
21
$51,590
410
$72,825
34
$45,221
2
$55,000
18
$58,132
2
$49,500
FILES CLOSED FOR INCOMPLETENESS
2
$47,000
20
$62,734
68
$70,269
8
$70,209
2
$1,483,650
7
$46,569
0
$0
Aggregated Statistics For Year 2003 (Based on 18 full and 6 partial tracts)
A) FHA, FSA/RHS & VA Home Purchase Loans
B) Conventional Home Purchase Loans
C) Refinancings
D) Home Improvement Loans
E) Loans on Dwellings For 5+ Families
F) Non-occupant Loans on < 5 Family Dwellings (A B C & D)
Number
Average Value
Number
Average Value
Number
Average Value
Number
Average Value
Number
Average Value
Number
Average Value
LOANS ORIGINATED
196
$52,234
271
$75,288
848
$62,620
183
$16,882
8
$120,732
73
$49,267
APPLICATIONS APPROVED, NOT ACCEPTED
1
$23,000
24
$50,735
153
$59,752
14
$30,051
0
$0
10
$41,090
APPLICATIONS DENIED
17
$68,358
65
$53,342
512
$58,359
181
$18,299
0
$0
45
$85,474
APPLICATIONS WITHDRAWN
12
$44,689
34
$54,723
344
$66,566
27
$33,324
0
$0
22
$43,635
FILES CLOSED FOR INCOMPLETENESS
1
$62,000
11
$61,696
34
$67,132
1
$12,920
0
$0
5
$40,588
Aggregated Statistics For Year 2002 (Based on 18 full and 6 partial tracts)
A) FHA, FSA/RHS & VA Home Purchase Loans
B) Conventional Home Purchase Loans
C) Refinancings
D) Home Improvement Loans
E) Loans on Dwellings For 5+ Families
F) Non-occupant Loans on < 5 Family Dwellings (A B C & D)
Number
Average Value
Number
Average Value
Number
Average Value
Number
Average Value
Number
Average Value
Number
Average Value
LOANS ORIGINATED
178
$49,862
212
$71,761
514
$62,700
245
$15,346
2
$34,980
74
$38,787
APPLICATIONS APPROVED, NOT ACCEPTED
1
$60,000
17
$52,857
128
$51,320
13
$28,165
0
$0
6
$33,203
APPLICATIONS DENIED
13
$44,596
57
$57,156
507
$53,335
184
$14,987
0
$0
34
$36,628
APPLICATIONS WITHDRAWN
6
$50,043
42
$71,211
322
$55,787
25
$21,239
0
$0
14
$48,965
FILES CLOSED FOR INCOMPLETENESS
0
$0
14
$55,457
47
$59,889
0
$0
0
$0
7
$49,144
Aggregated Statistics For Year 2001 (Based on 18 full and 6 partial tracts)
A) FHA, FSA/RHS & VA Home Purchase Loans
B) Conventional Home Purchase Loans
C) Refinancings
D) Home Improvement Loans
E) Loans on Dwellings For 5+ Families
F) Non-occupant Loans on < 5 Family Dwellings (A B C & D)
Number
Average Value
Number
Average Value
Number
Average Value
Number
Average Value
Number
Average Value
Number
Average Value
LOANS ORIGINATED
200
$51,051
238
$65,160
407
$56,369
213
$10,976
4
$486,585
52
$36,524
APPLICATIONS APPROVED, NOT ACCEPTED
5
$66,072
20
$38,767
71
$57,846
31
$13,649
0
$0
15
$45,226
APPLICATIONS DENIED
21
$43,315
62
$41,880
443
$50,950
216
$15,040
0
$0
37
$42,507
APPLICATIONS WITHDRAWN
8
$45,369
19
$47,431
272
$54,393
53
$23,443
0
$0
15
$42,262
FILES CLOSED FOR INCOMPLETENESS
3
$49,217
2
$58,830
25
$58,600
3
$52,123
0
$0
8
$50,362
Aggregated Statistics For Year 2000 (Based on 18 full and 6 partial tracts)
A) FHA, FSA/RHS & VA Home Purchase Loans
B) Conventional Home Purchase Loans
C) Refinancings
D) Home Improvement Loans
E) Loans on Dwellings For 5+ Families
F) Non-occupant Loans on < 5 Family Dwellings (A B C & D)
Number
Average Value
Number
Average Value
Number
Average Value
Number
Average Value
Number
Average Value
Number
Average Value
LOANS ORIGINATED
203
$44,448
200
$57,776
204
$45,068
192
$15,263
0
$0
41
$50,459
APPLICATIONS APPROVED, NOT ACCEPTED
6
$46,543
20
$46,908
40
$33,945
50
$13,900
0
$0
16
$27,488
APPLICATIONS DENIED
3
$37,480
75
$43,457
297
$42,977
200
$19,294
0
$0
25
$36,058
APPLICATIONS WITHDRAWN
12
$42,198
18
$54,212
175
$39,123
32
$33,232
1
$50,000
16
$34,074
FILES CLOSED FOR INCOMPLETENESS
6
$46,142
4
$44,358
58
$54,436
6
$25,040
0
$0
7
$34,590
Aggregated Statistics For Year 1999 (Based on 14 full and 3 partial tracts)
A) FHA, FSA/RHS & VA Home Purchase Loans
B) Conventional Home Purchase Loans
C) Refinancings
D) Home Improvement Loans
E) Loans on Dwellings For 5+ Families
F) Non-occupant Loans on < 5 Family Dwellings (A B C & D)
2002 - 2018 National Fire Incident Reporting System (NFIRS) incidents
Based on the data from the years 2002 - 2018 the average number of fires per year is 203. The highest number of reported fires - 258 took place in 2015, and the least - 130 in 2018. The data has a dropping trend.
When looking into fire subcategories, the most reports belonged to: Structure Fires (67.3%), and Outside Fires (18.4%).
Fire incident types reported to NFIRS in Zip Code 13501


 Nearest zip codes: 13413, 13495, 13319, 13417, 13456, 13502.


 Based on the data from the years 2002 - 2018 the average number of fires per year is 203. The highest number of reported fires - 258 took place in 2015, and the least - 130 in 2018. The data has a dropping trend.
 When looking into fire subcategories, the most reports belonged to: Structure Fires (67.3%), and Outside Fires (18.4%).