Estimated zip code population in 2022: 1,785 Zip code population in 2010: 1,711 Zip code population in 2000: 1,796
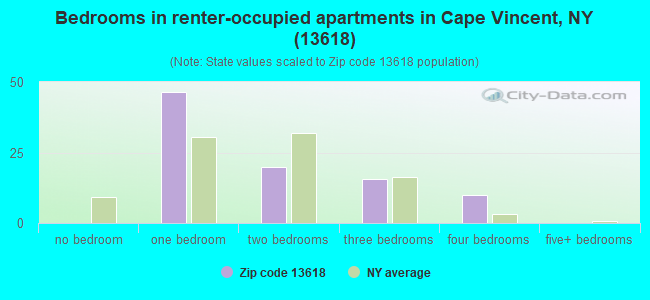
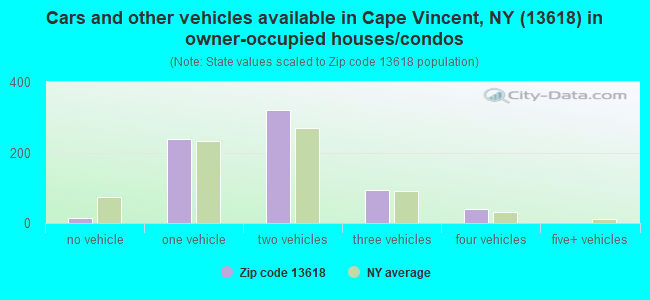
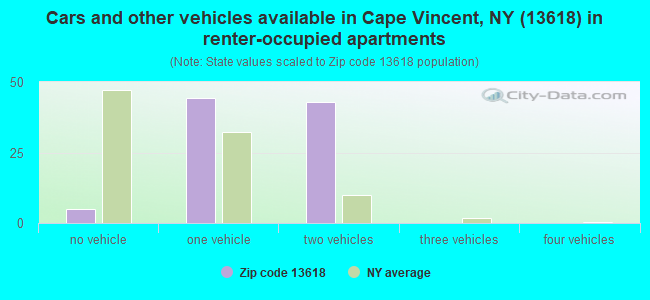
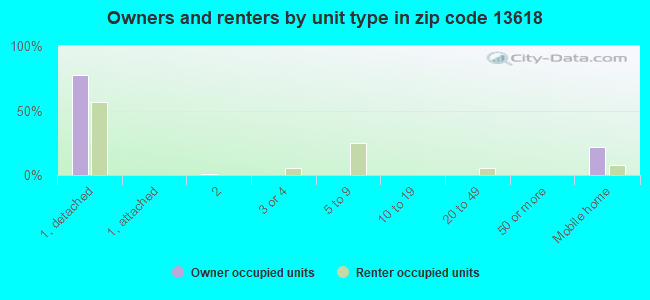
Houses and condos: 2,385 Renter-occupied apartments: 92
% of renters here:
12%
State:
46%
March 2022 cost of living index in zip code 13618: 95.2 (less than average, U.S. average is 100)
Land area: 50.4 sq. mi. Water area: 2.8 sq. mi.
Population density: 35 people per square mile
(very low).
OSM Map
General Map
Google Map
MSN Map
OSM Map
General Map
Google Map
MSN Map
OSM Map
General Map
Google Map
MSN Map
OSM Map
General Map
Google Map
MSN Map
Please wait while loading the map...
Real estate property taxes paid for housing units in 2022:
This zip code:
1.5% ($2,847)
New York:
1.5% ($6,180)
Median real estate property taxes paid for housing units with mortgages in 2022: $2,974 (1.6%) Median real estate property taxes paid for housing units with no mortgage in 2022: $2,726 (1.4%)
Business Search- 14 Million verified businesses
Males: 894
(50.1%)
Females: 890
(49.9%)
For population 25 years and over in 13618:
High school or higher: 96.8%
Bachelor's degree or higher: 35.8%
Graduate or professional degree: 14.8%
Unemployed: 4.9%
Mean travel time to work (commute): 24.4 minutes
For population 15 years and over in 13618:
Never married: 23.5%
Now married: 54.8%
Separated: 1.1%
Widowed: 6.4%
Divorced: 14.3%
Zip code 13618 compared to state average:
Median house value below state average.
Black race population percentage significantly below state average.
Hispanic race population percentage significantly below state average.
Median age significantly above state average.
Foreign-born population percentage significantly below state average.
Renting percentage significantly below state average.
Averages for the 2020 tax year for zip code 13618, filed in 2021:
Average Adjusted Gross Income (AGI) in 2020: $63,765 (Individual Income Tax Returns)
Here:
$63,765
State:
$90,930
Salary/wage: $52,611 (reported on 66.3% of returns)
Here:
$52,611
State:
$72,104
(% of AGI for various income ranges: 897.1% for AGIs below $25k, 2911.2% for AGIs $25k-50k, 4756.0% for AGIs $50k-75k, 7888.6% for AGIs $75k-100k, 10171.1% for AGIs $100k-200k)
Taxable interest for individuals: $616 (reported on 50.0% of returns)
This zip code:
$616
New York:
$3,075
(% of AGI for various income ranges: 23.3% for AGIs below $25k, 33.1% for AGIs $25k-50k, 34.0% for AGIs $50k-75k, 24.3% for AGIs $75k-100k, 140.0% for AGIs $100k-200k)
Ordinary dividends: $4,162 (reported on 26.5% of returns)
Here:
$4,162
State:
$11,095
(% of AGI for various income ranges: 33.3% for AGIs below $25k, 69.4% for AGIs $25k-50k, 95.0% for AGIs $50k-75k, 130.0% for AGIs $75k-100k, 592.2% for AGIs $100k-200k)
Net capital gain/loss in AGI: +$9,015 (reported on 20.4% of returns)
Here:
+$9,015
State:
+$44,925
(% of AGI for various income ranges: 28.6% for AGIs below $25k, 68.8% for AGIs $25k-50k, 142.0% for AGIs $50k-75k, 138.6% for AGIs $75k-100k, 753.3% for AGIs $100k-200k)
Profit/loss from business: +$16,250 (reported on 14.3% of returns)
Here:
+$16,250
State:
+$14,940
(% of AGI for various income ranges: 92.4% for AGIs below $25k, 184.4% for AGIs $25k-50k, 224.0% for AGIs $50k-75k, 1735.6% for AGIs $100k-200k)
Taxable individual retirement arrangement distribution: $22,327 (reported on 15.3% of returns)
13618:
$22,327
New York:
$19,609
(% of AGI for various income ranges: 107.1% for AGIs below $25k, 206.2% for AGIs $25k-50k, 476.0% for AGIs $50k-75k, 540.0% for AGIs $75k-100k, 2155.6% for AGIs $100k-200k)
Total itemized deductions: $28,025 (reported on 4.1% of returns)
Here:
$28,025
State:
$39,326
(% of AGI for various income ranges: 1245.6% for AGIs $100k-200k)
Charity contributions: $3,967 (reported on 3.1% of returns)
Here:
$3,967
State:
$15,420
(% of AGI for various income ranges: 132.2% for AGIs $100k-200k)
Taxes paid: $7,325 (reported on 4.1% of returns)
13618:
$7,325
State:
$9,183
(% of AGI for various income ranges: 325.6% for AGIs $100k-200k)
Earned income credit: $2,082 (reported on 11.2% of returns)
Here:
$2,082
State:
$2,138
(% of AGI for various income ranges: 65.7% for AGIs below $25k, 56.9% for AGIs $25k-50k)
Percentage of individuals using paid preparers for their 2020 taxes: 92.9%
Here:
93%
State:
95%
(% for various income ranges: 84.4% for AGIs below $25k, 95.7% for AGIs $25k-50k, 100.0% for AGIs $50k-75k, 90.9% for AGIs $75k-100k, 100.0% for AGIs $100k-200k, 100.0% for AGIs over 200k)
Averages for the 2012 tax year for zip code 13618, filed in 2013:
Average Adjusted Gross Income (AGI) in 2012: $50,859 (Individual Income Tax Returns)
Here:
$50,859
State:
$77,088
Salary/wage: $38,086 (reported on 75.6% of returns)
Here:
$38,086
State:
$60,593
(% of AGI for various income ranges: 63.4% for AGIs below $25k, 54.4% for AGIs $25k-50k, 63.6% for AGIs $50k-75k, 59.5% for AGIs $75k-100k, 51.3% for AGIs $100k-200k)
Taxable interest for individuals: $1,012 (reported on 50.0% of returns)
This zip code:
$1,012
New York:
$3,125
(% of AGI for various income ranges: 1.4% for AGIs below $25k, 1.2% for AGIs $25k-50k, 0.6% for AGIs $50k-75k, 0.8% for AGIs $75k-100k, 1.1% for AGIs $100k-200k)
Ordinary dividends: $3,986 (reported on 24.4% of returns)
Here:
$3,986
State:
$10,299
(% of AGI for various income ranges: 2.9% for AGIs below $25k, 1.2% for AGIs $25k-50k, 1.2% for AGIs $50k-75k, 1.9% for AGIs $75k-100k, 2.3% for AGIs $100k-200k)
Net capital gain/loss in AGI: +$6,669 (reported on 15.1% of returns)
Here:
+$6,669
State:
+$42,474
(% of AGI for various income ranges: 1.9% for AGIs $25k-50k, 0.8% for AGIs $50k-75k, 1.3% for AGIs $75k-100k, 3.4% for AGIs $100k-200k)
Profit/loss from business: +$14,221 (reported on 16.3% of returns)
Here:
+$14,221
State:
+$16,168
(% of AGI for various income ranges: 3.5% for AGIs below $25k, 4.0% for AGIs $25k-50k, 3.8% for AGIs $50k-75k, 7.3% for AGIs $100k-200k)
Taxable individual retirement arrangement distribution: $12,253 (reported on 17.4% of returns)
13618:
$12,253
New York:
$17,621
(% of AGI for various income ranges: 4.2% for AGIs below $25k, 6.6% for AGIs $25k-50k, 3.8% for AGIs $50k-75k, 3.2% for AGIs $75k-100k, 3.8% for AGIs $100k-200k)
Total itemized deductions: $19,592 (22% of AGI, reported on 29.1% of returns)
Here:
$19,592
State:
$34,985
Here:
22.0% of AGI
State:
21.3% of AGI
(% of AGI for various income ranges: 8.6% for AGIs below $25k, 8.8% for AGIs $25k-50k, 8.1% for AGIs $50k-75k, 10.2% for AGIs $75k-100k, 14.7% for AGIs $100k-200k)
Charity contributions: $3,005 (reported on 22.1% of returns)
Here:
$3,005
State:
$5,572
(% of AGI for various income ranges: 1.2% for AGIs $25k-50k, 0.6% for AGIs $50k-75k, 1.0% for AGIs $75k-100k, 2.1% for AGIs $100k-200k)
Taxes paid: $8,960 (reported on 29.1% of returns)
13618:
$8,960
State:
$18,656
(% of AGI for various income ranges: 3.0% for AGIs below $25k, 3.1% for AGIs $25k-50k, 3.0% for AGIs $50k-75k, 4.1% for AGIs $75k-100k, 7.9% for AGIs $100k-200k)
Earned income credit: $1,992 (reported on 14.0% of returns)
Here:
$1,992
State:
$2,230
(% of AGI for various income ranges: 4.4% for AGIs below $25k, 0.9% for AGIs $25k-50k)
Percentage of individuals using paid preparers for their 2012 taxes: 60.5%
Here:
60%
State:
66%
(% for various income ranges: 54.5% for AGIs below $25k, 60.0% for AGIs $25k-50k, 61.5% for AGIs $50k-75k, 66.7% for AGIs $75k-100k, 72.7% for AGIs $100k-200k)
Averages for the 2004 tax year for zip code 13618, filed in 2005:
Average Adjusted Gross Income (AGI) in 2004: $38,871 (Individual Income Tax Returns)
Here:
$38,871
State:
$59,519
Salary/wage: $31,141 (reported on 76.1% of returns)
Here:
$31,141
State:
$50,673
(% of AGI for various income ranges: 120.2% for AGIs below $10k, 57.2% for AGIs $10k-25k, 64.5% for AGIs $25k-50k, 64.5% for AGIs $50k-75k, 69.6% for AGIs $75k-100k, 46.9% for AGIs over 100k)
Taxable interest for individuals: $1,318 (reported on 57.7% of returns)
This zip code:
$1,318
New York:
$2,377
(% of AGI for various income ranges: 3.4% for AGIs below $10k, 2.8% for AGIs $10k-25k, 1.5% for AGIs $25k-50k, 2.6% for AGIs $50k-75k, 0.8% for AGIs $75k-100k, 2.0% for AGIs over 100k)
Taxable dividends: $1,898 (reported on 27.9% of returns)
Here:
$1,898
State:
$5,394
(% of AGI for various income ranges: 3.4% for AGIs below $10k, 1.9% for AGIs $10k-25k, 1.5% for AGIs $25k-50k, 1.3% for AGIs $50k-75k, 1.2% for AGIs $75k-100k, 1.0% for AGIs over 100k)
Net capital gain/loss: +$6,928 (reported on 20.6% of returns)
Here:
+$6,928
State:
+$23,581
(% of AGI for various income ranges: 2.4% for AGIs below $10k, 1.6% for AGIs $10k-25k, 1.6% for AGIs $25k-50k, 3.6% for AGIs $50k-75k, 1.7% for AGIs $75k-100k, 7.9% for AGIs over 100k)
Profit/loss from business: +$2,974 (reported on 17.3% of returns)
Here:
+$2,974
State:
+$13,809
(% of AGI for various income ranges: 5.7% for AGIs below $10k, 5.8% for AGIs $10k-25k, 3.2% for AGIs $25k-50k, 0.7% for AGIs $50k-75k, 0.7% for AGIs $75k-100k, -1.6% for AGIs over 100k)
IRA payment deduction: $2,407 (reported on 3.1% of returns)
13618:
$2,407
New York:
$3,115
Total itemized deductions: $16,186 (21% of AGI, reported on 24.5% of returns)
Here:
$16,186
State:
$25,864
Here:
21.4% of AGI
State:
21.9% of AGI
(% of AGI for various income ranges: 12.6% for AGIs $10k-25k, 9.0% for AGIs $25k-50k, 8.8% for AGIs $50k-75k, 9.6% for AGIs $75k-100k, 12.5% for AGIs over 100k)
Charity contributions deductions: $2,241 (3% of AGI, reported on 21.3% of returns)
Here:
$2,241
State:
$4,439
Here:
2.8% of AGI
State:
3.6% of AGI
(% of AGI for various income ranges: 1.1% for AGIs $10k-25k, 0.9% for AGIs $25k-50k, 1.1% for AGIs $50k-75k, 1.4% for AGIs $75k-100k, 1.7% for AGIs over 100k)
Total tax: $5,508 (reported on 72.4% of returns)
13618:
$5,508
State:
$11,730
(% of AGI for various income ranges: 3.9% for AGIs below $10k, 4.2% for AGIs $10k-25k, 6.7% for AGIs $25k-50k, 8.7% for AGIs $50k-75k, 10.5% for AGIs $75k-100k, 17.7% for AGIs over 100k)
Earned income credit: $1,519 (reported on 14.9% of returns)
Here:
$1,519
State:
$1,757
Percentage of individuals using paid preparers for their 2004 taxes: 66.5%
Here:
67%
State:
67%
(% for various income ranges: 56.6% for AGIs below $10k, 63.6% for AGIs $10k-25k, 71.7% for AGIs $25k-50k, 69.0% for AGIs $50k-75k, 73.4% for AGIs $75k-100k, 84.3% for AGIs over 100k)
Likely homosexual households (counted as self-reported same-sex unmarried-partner households)
Lesbian couples: 0.7% of all households
Gay men: 0.0% of all households
Household received Food Stamps/SNAP in the past 12 months: 44 Household did not receive Food Stamps/SNAP in the past 12 months: 748
Women who had a birth in the past 12 months: 12 (10 now married, 2 unmarried) Women who did not have a birth in the past 12 months: 307 (124 now married, 182 unmarried)
Housing units in zip code 13618 with a mortgage: 328 (22 second mortgage, 22 both second mortgage and home equity loan) Houses without a mortgage: 35
Median monthly owner costs for units with a mortgage: $1,478 Median monthly owner costs for units without a mortgage: $564
Residents with income below the poverty level in 2022:
This zip code:
10.1%
Whole state:
14.3%
Residents with income below 50% of the poverty level in 2022:
This zip code:
4.7%
Whole state:
6.8%
Median number of rooms in houses and condos:
Here:
5.8
State:
6.3
Median number of rooms in apartments:
Here:
3.6
State:
3.8
Notable locations in this zip code not listed on our city pages
Notable locations in zip code 13618: Bedford Corners (A), Lawrence J Docteur Dock (B), Willow Shores Marina (C), Anchor Marina (D), Scott Marina (E), Martins Marina (F), Snug Harbor Marina (G), Ponds Marina (H), Cape Vincent Breakwater Light (I), Ponds Corners (J), White Farms (K), Wood Farms (L), Cape Vincent Community Library (M), Cape Vincent Fire Department (N), Cape Vincent Water Works Pumping Station (O). Display/hide their locations on the map
Churches in zip code 13618 include: Saint Paul's Episcopal Church (A), Saint Vincent De Paul Roman Catholic Church (B), First Methodist Church (C), First Presbyterian Church (D), United Church of Cape Vincent (E). Display/hide their locations on the map
198 married couples with children.
68 single-parent households (22 men, 46 women).
96.5% of residents of 13618 zip code speak English at home.
0.4% of residents speak Spanish at home (100% not well).
4.0% of residents speak other Indo-European language at home (100% very well).
Foreign born population: 12 (0.7%) (62.8% of them are naturalized citizens)
This zip code:
0.7%
Whole state:
22.7%
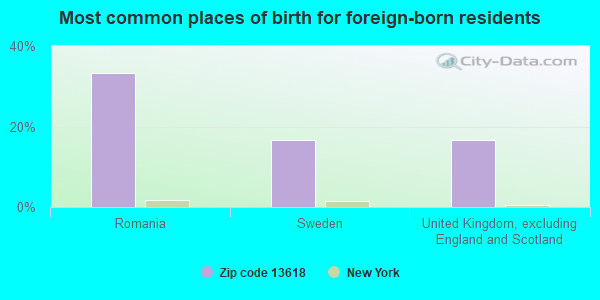
33%Romania
17%Sweden
17%United Kingdom, excluding England and Scotland
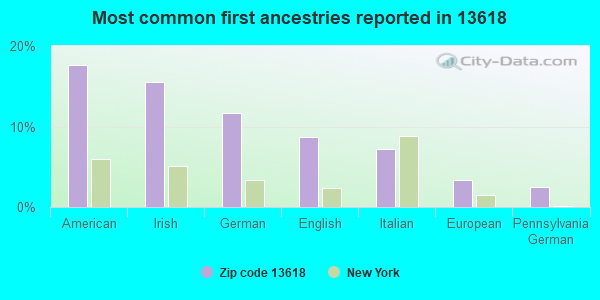
18%American
16%Irish
12%German
9%English
7%Italian
3%European
3%Pennsylvania German
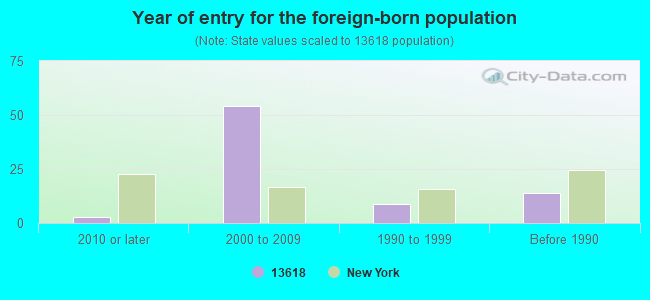
Year of entry for the foreign-born population
32010 or later
542000 to 2009
91990 to 1999
14Before 1990
Facilities with environmental interests located in this zip code:
GRIFFITH OIL CO INC (12 E BROADWAY in CAPE VINCENT, NY)
(Resource Conservation and Recovery Act (tracking hazardous waste))
Housing units lacking complete plumbing facilities: 5.8% Housing units lacking complete kitchen facilities: 1.2%
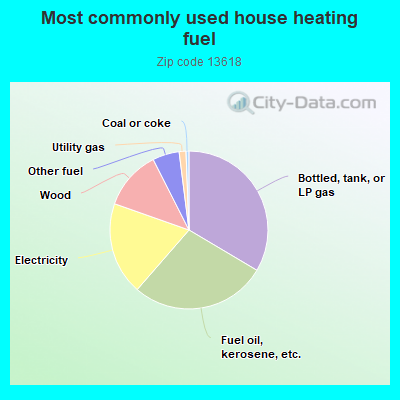
33.7%Bottled, tank, or LP gas
28.0%Fuel oil, kerosene, etc.
19.1%Electricity
12.2%Wood
5.5%Other fuel
1.4%Utility gas
0.6%Coal or coke
Population in 1990: 1,207. Population change in the 1990s: +589 (+48.8%).
Place of birth for U.S.-born residents:
This state: 1,309
Northeast: 244
Midwest: 72
South: 41
West: 32
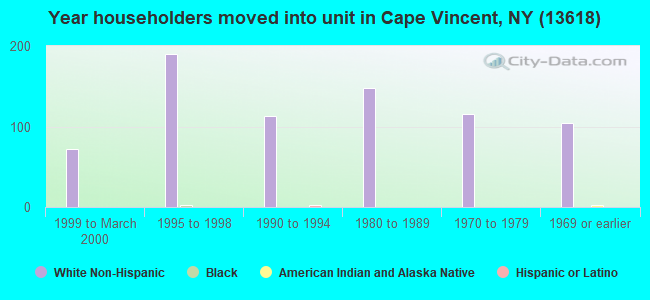
66% of the 13618 zip code residents lived in the same house 5 years ago. Out of people who lived in different houses, 52% lived in this county. Out of people who lived in different counties, 50% lived in New York.
89% of the 13618 zip code residents lived in the same house 1 year ago. Out of people who lived in different houses, 60% moved from this county. Out of people who lived in different houses, 6% moved from different county within same state. Out of people who lived in different houses, 28% moved from different state. Out of people who lived in different houses, 6% moved from abroad.
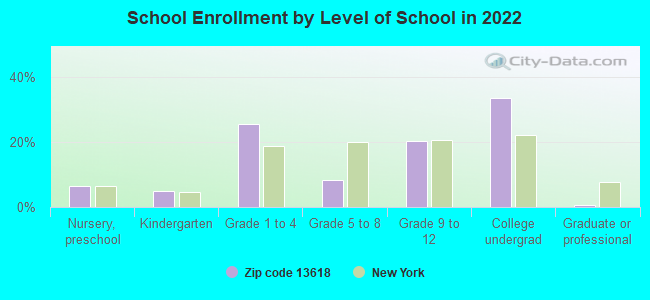
Private vs. public school enrollment:
Students in private schools in grades 1 to 8 (elementary and middle school): 12
Here:
8.1%
New York:
15.6%
Students in private schools in grades 9 to 12 (high school): 10
Here:
11.9%
New York:
15.0%
Students in private undergraduate colleges:
Here:
0.0%
New York:
39.2%
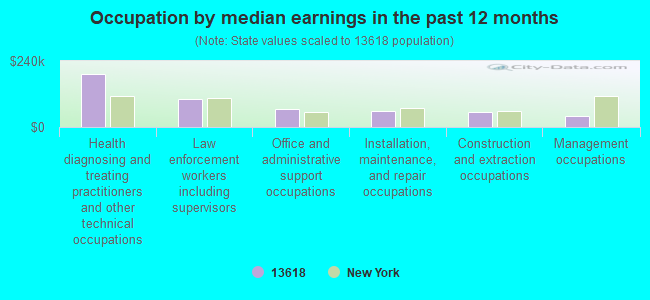
Occupation by median earnings in the past 12 months ($)
192,130Health diagnosing and treating practitioners and other technical occupations
100,505Law enforcement workers including supervisors
65,667Office and administrative support occupations
59,172Installation, maintenance, and repair occupations
53,291Construction and extraction occupations
39,557Management occupations
Top industries in this zip code by the number of employees in 2005:
Finance and Insurance: Commercial Banking (10-19: 1)
Accommodation and Food Services: Hotels (except Casino Hotels) and Motels (5-9: 1, 1-4: 2)
Accommodation and Food Services: Full-Service Restaurants (1-4: 4)
Other Services (except Public Administration): Civic and Social Organizations (5-9: 1)
Construction: Plumbing, Heating, and Air-Conditioning Contractors (5-9: 1)
People in group quarters in 2000:
10 people in other noninstitutional group quarters
2002 - 2018 National Fire Incident Reporting System (NFIRS) incidents
Based on the data from the years 2002 - 2018 the average number of fire incidents per year is 6. The highest number of reported fire incidents - 19 took place in 2013, and the least - 0 in 2004. The data has a decreasing trend.
When looking into fire subcategories, the most incidents belonged to: Structure Fires (44.9%), and Outside Fires (30.8%).
Fire incident types reported to NFIRS in Zip Code 13618

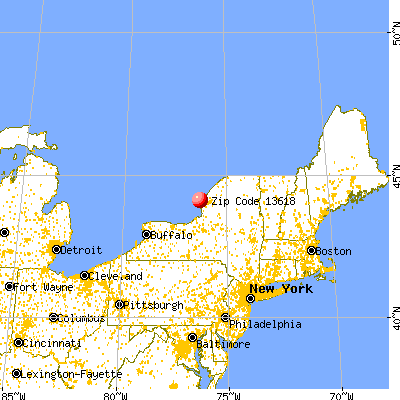


 Nearest zip codes: 13693, 13622, 13624, 13634, 13651, 13685.


 Based on the data from the years 2002 - 2018 the average number of fire incidents per year is 6. The highest number of reported fire incidents - 19 took place in 2013, and the least - 0 in 2004. The data has a decreasing trend.
 When looking into fire subcategories, the most incidents belonged to: Structure Fires (44.9%), and Outside Fires (30.8%).