Estimated zip code population in 2022: 3,340 Zip code population in 2010: 3,806 Zip code population in 2000: 3,807
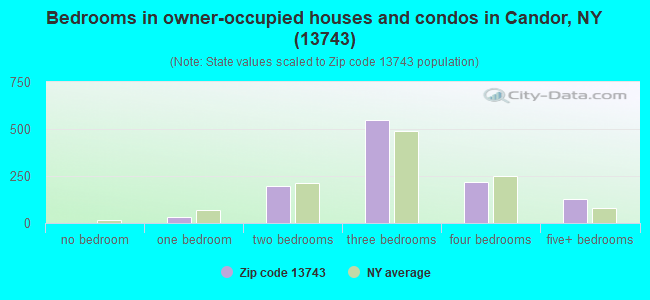
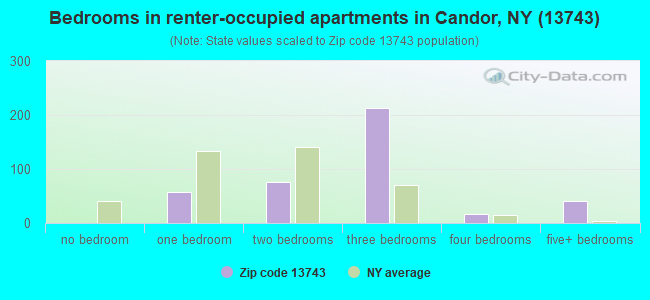
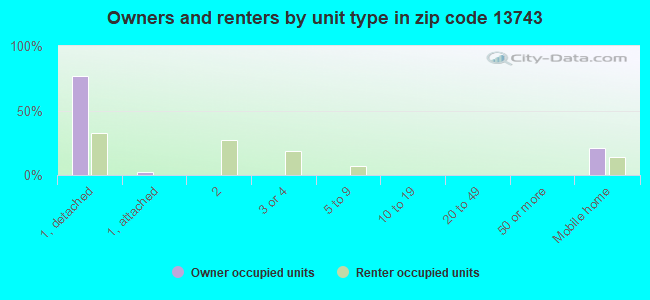
Houses and condos: 1,777 Renter-occupied apartments: 409
% of renters here:
27%
State:
46%
March 2022 cost of living index in zip code 13743: 94.8 (less than average, U.S. average is 100)
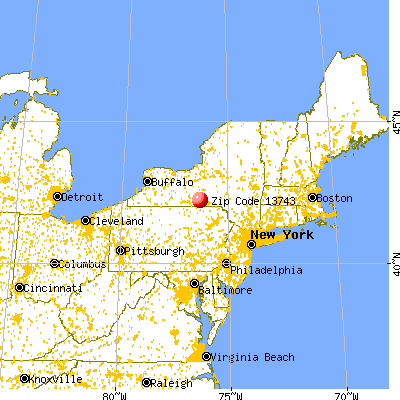
Land area: 58.7 sq. mi. Water area: 0.1 sq. mi.
Population density: 57 people per square mile
(very low).
OSM Map
General Map
Google Map
MSN Map
OSM Map
General Map
Google Map
MSN Map
OSM Map
General Map
Google Map
MSN Map
OSM Map
General Map
Google Map
MSN Map
Please wait while loading the map...
Real estate property taxes paid for housing units in 2022:
This zip code:
2.7% ($4,128)
New York:
1.5% ($6,180)
Median real estate property taxes paid for housing units with mortgages in 2022: $5,048 (2.8%) Median real estate property taxes paid for housing units with no mortgage in 2022: $3,745 (2.7%)
Business Search- 14 Million verified businesses
Males: 1,706
(51.1%)
Females: 1,633
(48.9%)
For population 25 years and over in 13743:
High school or higher: 91.9%
Bachelor's degree or higher: 16.1%
Graduate or professional degree: 5.7%
Unemployed: 7.6%
Mean travel time to work (commute): 28.7 minutes
For population 15 years and over in 13743:
Never married: 29.0%
Now married: 51.2%
Separated: 1.5%
Widowed: 6.8%
Divorced: 11.4%
Zip code 13743 compared to state average:
Median house value significantly below state average.
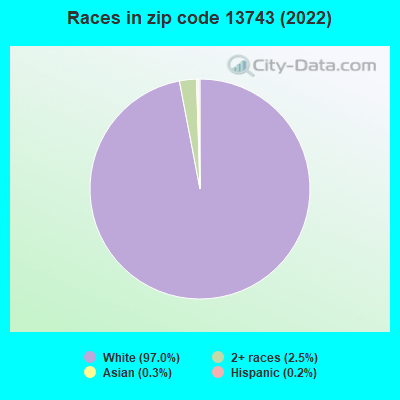
Black race population percentage significantly below state average.
Hispanic race population percentage significantly below state average.
Median age significantly above state average.
Foreign-born population percentage significantly below state average.
Renting percentage below state average.
Length of stay since moving in significantly above state average.
Number of rooms per house above state average.
Percentage of population with a bachelor's degree or higher significantly below state average.
Averages for the 2020 tax year for zip code 13743, filed in 2021:
Average Adjusted Gross Income (AGI) in 2020: $56,948 (Individual Income Tax Returns)
Here:
$56,948
State:
$90,930
Salary/wage: $47,906 (reported on 80.6% of returns)
Here:
$47,906
State:
$72,104
(% of AGI for various income ranges: 1072.1% for AGIs below $25k, 3412.9% for AGIs $25k-50k, 5781.4% for AGIs $50k-75k, 8556.2% for AGIs $75k-100k, 14197.1% for AGIs $100k-200k)
Taxable interest for individuals: $500 (reported on 38.8% of returns)
This zip code:
$500
New York:
$3,075
(% of AGI for various income ranges: 13.0% for AGIs below $25k, 15.0% for AGIs $25k-50k, 29.5% for AGIs $50k-75k, 45.4% for AGIs $75k-100k, 60.0% for AGIs $100k-200k)
Ordinary dividends: $2,875 (reported on 16.5% of returns)
Here:
$2,875
State:
$11,095
(% of AGI for various income ranges: 21.5% for AGIs below $25k, 21.9% for AGIs $25k-50k, 66.2% for AGIs $50k-75k, 71.5% for AGIs $75k-100k, 292.9% for AGIs $100k-200k)
Net capital gain/loss in AGI: +$7,967 (reported on 12.4% of returns)
Here:
+$7,967
State:
+$44,925
(% of AGI for various income ranges: 14.5% for AGIs below $25k, 27.6% for AGIs $25k-50k, 86.2% for AGIs $50k-75k, 160.8% for AGIs $75k-100k, 799.3% for AGIs $100k-200k)
Profit/loss from business: +$7,437 (reported on 11.2% of returns)
Here:
+$7,437
State:
+$14,940
(% of AGI for various income ranges: 124.8% for AGIs below $25k, 80.5% for AGIs $25k-50k, 218.1% for AGIs $50k-75k, 146.4% for AGIs $100k-200k)
Taxable individual retirement arrangement distribution: $20,527 (reported on 8.8% of returns)
13743:
$20,527
New York:
$19,609
(% of AGI for various income ranges: 54.5% for AGIs below $25k, 62.6% for AGIs $25k-50k, 279.5% for AGIs $50k-75k, 1463.6% for AGIs $100k-200k)
Total itemized deductions: $24,440 (reported on 2.9% of returns)
Here:
$24,440
State:
$39,326
(% of AGI for various income ranges: 128.6% for AGIs $25k-50k, 524.6% for AGIs $75k-100k)
Charity contributions: $3,100 (reported on 1.8% of returns)
Here:
$3,100
State:
$15,420
(% of AGI for various income ranges: 44.3% for AGIs $50k-75k)
Taxes paid: $6,917 (reported on 3.5% of returns)
13743:
$6,917
State:
$9,183
(% of AGI for various income ranges: 42.4% for AGIs $25k-50k, 182.3% for AGIs $75k-100k)
Earned income credit: $2,100 (reported on 15.3% of returns)
Here:
$2,100
State:
$2,138
(% of AGI for various income ranges: 85.2% for AGIs below $25k, 63.1% for AGIs $25k-50k)
Percentage of individuals using paid preparers for their 2020 taxes: 95.3%
Here:
95%
State:
95%
(% for various income ranges: 93.5% for AGIs below $25k, 94.3% for AGIs $25k-50k, 96.6% for AGIs $50k-75k, 94.4% for AGIs $75k-100k, 100.0% for AGIs $100k-200k, 100.0% for AGIs over 200k)
Averages for the 2012 tax year for zip code 13743, filed in 2013:
Average Adjusted Gross Income (AGI) in 2012: $46,111 (Individual Income Tax Returns)
Here:
$46,111
State:
$77,088
Salary/wage: $40,329 (reported on 83.9% of returns)
Here:
$40,329
State:
$60,593
(% of AGI for various income ranges: 72.8% for AGIs below $25k, 77.9% for AGIs $25k-50k, 74.2% for AGIs $50k-75k, 80.9% for AGIs $75k-100k, 98.3% for AGIs $100k-200k)
Taxable interest for individuals: $989 (reported on 40.2% of returns)
This zip code:
$989
New York:
$3,125
(% of AGI for various income ranges: 0.8% for AGIs below $25k, 0.7% for AGIs $25k-50k, 0.8% for AGIs $50k-75k, 0.2% for AGIs $75k-100k, 2.2% for AGIs $100k-200k)
Ordinary dividends: $2,306 (reported on 18.4% of returns)
Here:
$2,306
State:
$10,299
(% of AGI for various income ranges: 1.2% for AGIs below $25k, 0.9% for AGIs $25k-50k, 0.9% for AGIs $50k-75k, 0.6% for AGIs $75k-100k, 1.5% for AGIs $100k-200k)
Net capital gain/loss in AGI: +$3,544 (reported on 9.2% of returns)
Here:
+$3,544
State:
+$42,474
(% of AGI for various income ranges: 0.4% for AGIs below $25k, 0.5% for AGIs $50k-75k, 0.2% for AGIs $75k-100k, 2.6% for AGIs $100k-200k)
Profit/loss from business: +$6,092 (reported on 13.8% of returns)
Here:
+$6,092
State:
+$16,168
(% of AGI for various income ranges: 4.9% for AGIs below $25k, 2.7% for AGIs $25k-50k, 1.1% for AGIs $50k-75k, 0.5% for AGIs $75k-100k, 2.0% for AGIs $100k-200k)
Taxable individual retirement arrangement distribution: $8,207 (reported on 8.6% of returns)
13743:
$8,207
New York:
$17,621
(% of AGI for various income ranges: 1.9% for AGIs below $25k, 1.3% for AGIs $25k-50k, 2.4% for AGIs $50k-75k, 3.2% for AGIs $75k-100k)
Total itemized deductions: $18,242 (20% of AGI, reported on 23.0% of returns)
Here:
$18,242
State:
$34,985
Here:
19.9% of AGI
State:
21.3% of AGI
(% of AGI for various income ranges: 5.4% for AGIs below $25k, 5.9% for AGIs $25k-50k, 8.7% for AGIs $50k-75k, 9.7% for AGIs $75k-100k, 18.9% for AGIs $100k-200k)
Charity contributions: $2,575 (reported on 16.1% of returns)
Here:
$2,575
State:
$5,572
(% of AGI for various income ranges: 0.6% for AGIs $25k-50k, 0.9% for AGIs $50k-75k, 0.8% for AGIs $75k-100k, 2.2% for AGIs $100k-200k)
Taxes paid: $9,988 (reported on 23.0% of returns)
13743:
$9,988
State:
$18,656
(% of AGI for various income ranges: 1.3% for AGIs below $25k, 2.4% for AGIs $25k-50k, 4.1% for AGIs $50k-75k, 6.8% for AGIs $75k-100k, 11.6% for AGIs $100k-200k)
Earned income credit: $2,112 (reported on 19.0% of returns)
Here:
$2,112
State:
$2,230
(% of AGI for various income ranges: 6.0% for AGIs below $25k, 1.1% for AGIs $25k-50k)
Percentage of individuals using paid preparers for their 2012 taxes: 43.7%
Here:
44%
State:
66%
(% for various income ranges: 36.2% for AGIs below $25k, 47.8% for AGIs $25k-50k, 46.4% for AGIs $50k-75k, 50.0% for AGIs $75k-100k, 61.5% for AGIs $100k-200k)
Averages for the 2004 tax year for zip code 13743, filed in 2005:
Average Adjusted Gross Income (AGI) in 2004: $37,796 (Individual Income Tax Returns)
Here:
$37,796
State:
$59,519
Salary/wage: $35,082 (reported on 85.1% of returns)
Here:
$35,082
State:
$50,673
(% of AGI for various income ranges: 81.9% for AGIs below $10k, 72.9% for AGIs $10k-25k, 79.5% for AGIs $25k-50k, 86.4% for AGIs $50k-75k, 82.7% for AGIs $75k-100k, 65.8% for AGIs over 100k)
Taxable interest for individuals: $994 (reported on 48.5% of returns)
This zip code:
$994
New York:
$2,377
(% of AGI for various income ranges: 5.1% for AGIs below $10k, 2.2% for AGIs $10k-25k, 1.5% for AGIs $25k-50k, 0.6% for AGIs $50k-75k, 0.8% for AGIs $75k-100k, 1.2% for AGIs over 100k)
Taxable dividends: $1,201 (reported on 18.8% of returns)
Here:
$1,201
State:
$5,394
(% of AGI for various income ranges: 0.5% for AGIs below $10k, 0.8% for AGIs $10k-25k, 0.7% for AGIs $25k-50k, 0.3% for AGIs $50k-75k, 0.4% for AGIs $75k-100k, 1.0% for AGIs over 100k)
Net capital gain/loss: +$4,431 (reported on 13.3% of returns)
Here:
+$4,431
State:
+$23,581
(% of AGI for various income ranges: 0.1% for AGIs below $10k, 0.4% for AGIs $10k-25k, 0.1% for AGIs $25k-50k, 0.2% for AGIs $50k-75k, 3.1% for AGIs $75k-100k, 5.7% for AGIs over 100k)
Profit/loss from business: +$5,471 (reported on 14.9% of returns)
Here:
+$5,471
State:
+$13,809
(% of AGI for various income ranges: 6.0% for AGIs below $10k, 5.1% for AGIs $10k-25k, 2.9% for AGIs $25k-50k, 2.2% for AGIs $50k-75k, 0.6% for AGIs $75k-100k, -0.1% for AGIs over 100k)
IRA payment deduction: $2,744 (reported on 2.4% of returns)
13743:
$2,744
New York:
$3,115
Total itemized deductions: $14,093 (20% of AGI, reported on 21.3% of returns)
Here:
$14,093
State:
$25,864
Here:
20.1% of AGI
State:
21.9% of AGI
(% of AGI for various income ranges: 5.3% for AGIs $10k-25k, 6.7% for AGIs $25k-50k, 6.7% for AGIs $50k-75k, 12.0% for AGIs $75k-100k, 10.6% for AGIs over 100k)
Charity contributions deductions: $2,500 (3% of AGI, reported on 17.1% of returns)
Here:
$2,500
State:
$4,439
Here:
3.4% of AGI
State:
3.6% of AGI
(% of AGI for various income ranges: 0.6% for AGIs $10k-25k, 0.7% for AGIs $25k-50k, 0.7% for AGIs $50k-75k, 2.0% for AGIs $75k-100k, 2.3% for AGIs over 100k)
Total tax: $4,368 (reported on 75.8% of returns)
13743:
$4,368
State:
$11,730
(% of AGI for various income ranges: 2.6% for AGIs below $10k, 4.3% for AGIs $10k-25k, 6.5% for AGIs $25k-50k, 8.1% for AGIs $50k-75k, 10.1% for AGIs $75k-100k, 16.6% for AGIs over 100k)
Earned income credit: $1,641 (reported on 17.5% of returns)
Here:
$1,641
State:
$1,757
Percentage of individuals using paid preparers for their 2004 taxes: 54.3%
Here:
54%
State:
67%
(% for various income ranges: 39.5% for AGIs below $10k, 60.8% for AGIs $10k-25k, 57.1% for AGIs $25k-50k, 52.1% for AGIs $50k-75k, 58.1% for AGIs $75k-100k, 65.6% for AGIs over 100k)
Household received Food Stamps/SNAP in the past 12 months: 234 Household did not receive Food Stamps/SNAP in the past 12 months: 1,298
Women who had a birth in the past 12 months: 55 (54 now married, 0 unmarried) Women who did not have a birth in the past 12 months: 633 (202 now married, 432 unmarried)
Housing units in zip code 13743 with a mortgage: 434 (46 second mortgage, 46 both second mortgage and home equity loan) Houses without a mortgage: 28
Median monthly owner costs for units with a mortgage: $1,536 Median monthly owner costs for units without a mortgage: $571
Residents with income below the poverty level in 2022:
This zip code:
13.7%
Whole state:
14.3%
Residents with income below 50% of the poverty level in 2022:
This zip code:
4.4%
Whole state:
6.8%
Median number of rooms in houses and condos:
Here:
7.3
State:
6.3
Median number of rooms in apartments:
Here:
5.4
State:
3.8
Notable locations in this zip code not listed on our city pages
Notable locations in zip code 13743: Catatonk Golf Course (A), AA Dairy (B), Fallow Hollow Deer Farm (C), Fish Haven Farm (D), Iron Kettle Farm (E), Klossner Farms (F), Candor Free Library (G), Candor Fire Department (H). Display/hide their locations on the map
Churches in zip code 13743 include: Saint Marks Episcopal Church (A), Seventh Day Adventist Church (B), Kingdom Hall of Jehovah's Witnesses (C), Candor Congregational Church (D), Allen Memorial Baptist Church (E), Straits Corners Baptist Church (F). Display/hide their locations on the map
Cemeteries: Anderson Hill Cemetery (1), Evergreen Cemetery (2), Maple Grove Cemetery (3), Anderson Hill Cemetery (4), Chapel Hill Cemetery (5), West Candor Cemetery (6), Schumacher Road Cemetery (7). Display/hide their locations on the map
344 married couples with children.
205 single-parent households (78 men, 127 women).
95.5% of residents of 13743 zip code speak English at home.
0.6% of residents speak Spanish at home (89% very well, 11% not well).
3.9% of residents speak other Indo-European language at home (100% very well).
0.1% of residents speak other language at home (100% very well).
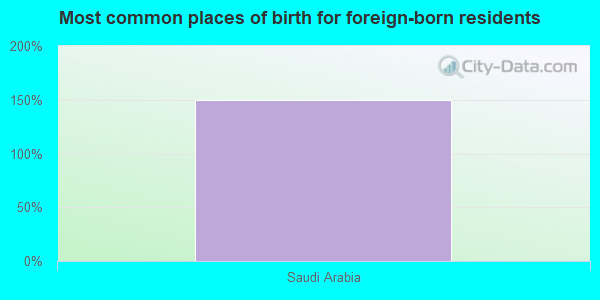
Foreign born population: 3 (0.1%) (100.0% of them are naturalized citizens)
This zip code:
0.1%
Whole state:
22.7%
150%Saudi Arabia
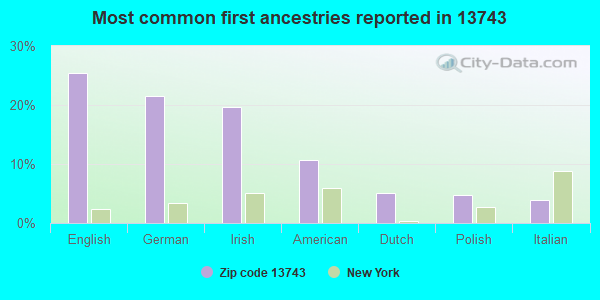
26%English
21%German
20%Irish
11%American
5%Dutch
5%Polish
4%Italian
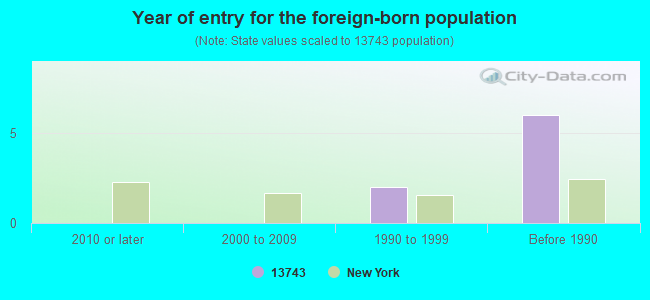
Year of entry for the foreign-born population
02010 or later
02000 to 2009
21990 to 1999
6Before 1990
Facilities with environmental interests located in this zip code:
AA DAIRY PROPERTY (56 FOOTE CROSSING in CANDOR, NY)
STATE MASTER (New York facility tracking) - SECTION 404 PERMITTING, 401 CERTIFICATION, National Pollutant Discharge Elimination System Permit National Pollutant Discharge Elimination System NON-MAJOR (Tracking pollutant discharge elimination systems) - permit Business SIC classification: GENERAL FARMS, PRIMARILY LIVESTOCK AND ANIMAL SPECIALTIES Organizations: AARON AMAN (CONTACT/OWNER)
, A A DAIRY (LEGALLY RESPONSIBLE PARTY)
Alternative names: AARON/WAYNE AMAN
Housing units lacking complete plumbing facilities: 4.2% Housing units lacking complete kitchen facilities: 2.1%
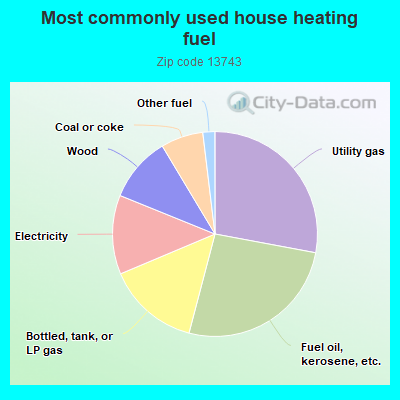
28.0%Utility gas
26.2%Fuel oil, kerosene, etc.
14.6%Bottled, tank, or LP gas
12.5%Electricity
10.3%Wood
6.7%Coal or coke
1.9%Other fuel
Population in 1990: 4,850.
Place of birth for U.S.-born residents:
This state: 2,342
Northeast: 729
Midwest: 129
South: 65
West: 61
69% of the 13743 zip code residents lived in the same house 5 years ago. Out of people who lived in different houses, 75% lived in this county. Out of people who lived in different counties, 50% lived in New York.
92% of the 13743 zip code residents lived in the same house 1 year ago. Out of people who lived in different houses, 77% moved from this county. Out of people who lived in different houses, 9% moved from different county within same state. Out of people who lived in different houses, 10% moved from different state.
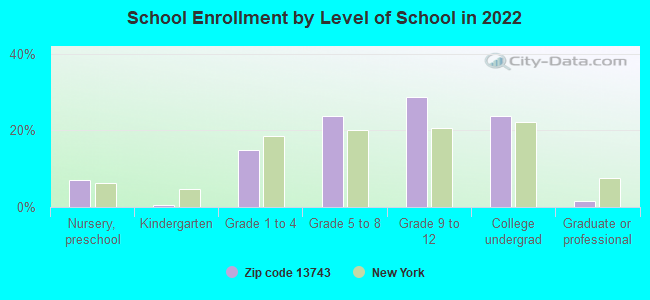
Private vs. public school enrollment:
Students in private schools in grades 1 to 8 (elementary and middle school):
Here:
0.0%
New York:
15.6%
Students in private schools in grades 9 to 12 (high school):
Here:
0.0%
New York:
15.0%
Students in private undergraduate colleges: 23
Here:
13.2%
New York:
39.2%
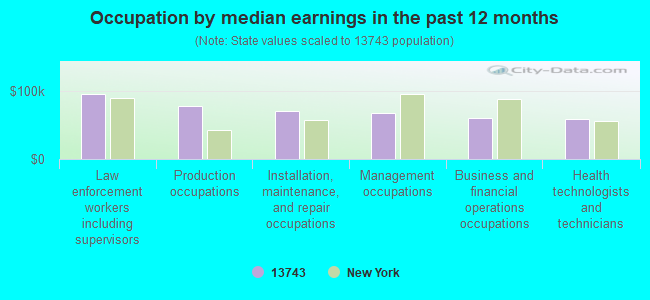
Occupation by median earnings in the past 12 months ($)
96,746Law enforcement workers including supervisors
78,660Production occupations
70,519Installation, maintenance, and repair occupations
68,343Management occupations
60,052Business and financial operations occupations
58,916Health technologists and technicians
Top industries in this zip code by the number of employees in 2005:
Other Services (except Public Administration): Religious Organizations (5-9 employees: 2 establishments, 1-4 employees: 1 establishment)
Construction: Site Preparation Contractors (10-19: 1)
Construction: Poured Concrete Foundation and Structure Contractors (10-19: 1)
Accommodation and Food Services: Full-Service Restaurants (5-9: 1)
Information: Libraries and Archives (5-9: 1)
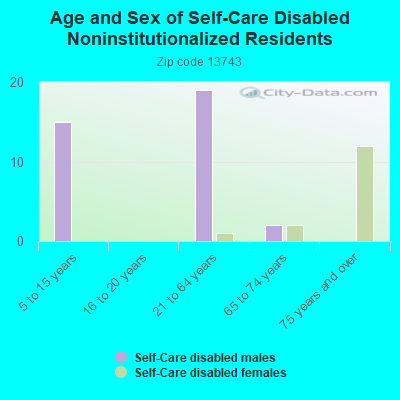
People in group quarters in 2010:
39 people in other noninstitutional facilities
People in group quarters in 2000:
6 people in other noninstitutional group quarters
Fatal accident statistics in 2011:
Fatal accident count: 1
Vehicles involved in fatal accidents: 1
Fatal accidents caused by drunken drivers: 1
Fatalities: 1
Persons involved in fatal accidents: 1
Pedestrians involved in fatal accidents: 0
Fatal accident statistics in 2010:
Fatal accident count: 1
Vehicles involved in fatal accidents: 1
Fatal accidents caused by drunken drivers: 1
Fatalities: 1
Persons involved in fatal accidents: 1
Pedestrians involved in fatal accidents: 0
Home Mortgage Disclosure Act Aggregated Statistics For Year 2009 (Based on 2 partial tracts)
A) FHA, FSA/RHS & VA Home Purchase Loans
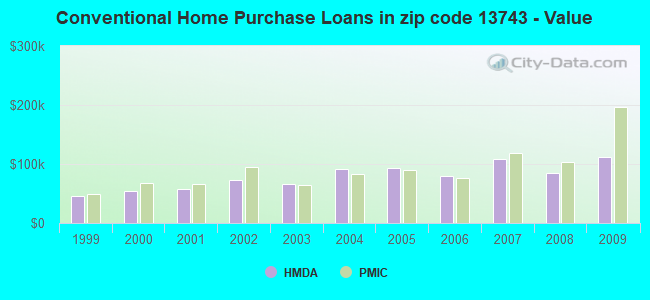
B) Conventional Home Purchase Loans
C) Refinancings
D) Home Improvement Loans
F) Non-occupant Loans on < 5 Family Dwellings (A B C & D)
G) Loans On Manufactured Home Dwelling (A B C & D)
Number
Average Value
Number
Average Value
Number
Average Value
Number
Average Value
Number
Average Value
Number
Average Value
LOANS ORIGINATED
22
$96,742
24
$112,686
51
$100,964
32
$30,301
5
$63,528
22
$73,010
APPLICATIONS APPROVED, NOT ACCEPTED
0
$0
3
$63,443
10
$95,678
4
$9,968
3
$39,437
5
$52,468
APPLICATIONS DENIED
1
$106,740
18
$88,734
30
$80,804
21
$18,984
3
$22,290
13
$47,384
APPLICATIONS WITHDRAWN
3
$81,447
0
$0
13
$103,968
3
$7,717
0
$0
3
$75,447
FILES CLOSED FOR INCOMPLETENESS
3
$95,593
0
$0
0
$0
0
$0
0
$0
0
$0
Aggregated Statistics For Year 2008 (Based on 2 partial tracts)
A) FHA, FSA/RHS & VA Home Purchase Loans
B) Conventional Home Purchase Loans
C) Refinancings
D) Home Improvement Loans
F) Non-occupant Loans on < 5 Family Dwellings (A B C & D)
G) Loans On Manufactured Home Dwelling (A B C & D)
Number
Average Value
Number
Average Value
Number
Average Value
Number
Average Value
Number
Average Value
Number
Average Value
LOANS ORIGINATED
9
$106,309
33
$85,538
46
$79,452
42
$34,630
5
$40,638
26
$55,990
APPLICATIONS APPROVED, NOT ACCEPTED
1
$212,190
17
$92,819
10
$78,703
6
$33,007
0
$0
14
$84,509
APPLICATIONS DENIED
3
$68,587
10
$90,277
57
$82,214
42
$17,484
4
$26,685
10
$61,599
APPLICATIONS WITHDRAWN
4
$144,352
4
$118,312
27
$112,596
5
$72,530
1
$289,350
3
$98,593
FILES CLOSED FOR INCOMPLETENESS
0
$0
1
$74,590
1
$234,050
3
$9,430
0
$0
0
$0
Aggregated Statistics For Year 2007 (Based on 2 partial tracts)
A) FHA, FSA/RHS & VA Home Purchase Loans
B) Conventional Home Purchase Loans
C) Refinancings
D) Home Improvement Loans
E) Loans on Dwellings For 5+ Families
F) Non-occupant Loans on < 5 Family Dwellings (A B C & D)
G) Loans On Manufactured Home Dwelling (A B C & D)
Number
Average Value
Number
Average Value
Number
Average Value
Number
Average Value
Number
Average Value
Number
Average Value
Number
Average Value
LOANS ORIGINATED
6
$107,595
63
$108,820
72
$82,500
55
$26,398
1
$136,320
6
$171,252
24
$63,978
APPLICATIONS APPROVED, NOT ACCEPTED
1
$122,170
14
$87,264
13
$85,766
4
$49,510
0
$0
1
$282,920
12
$62,371
APPLICATIONS DENIED
0
$0
33
$92,631
81
$80,510
55
$32,384
0
$0
5
$88,734
37
$54,672
APPLICATIONS WITHDRAWN
1
$101,590
5
$105,710
36
$82,626
4
$38,580
0
$0
0
$0
1
$180,040
FILES CLOSED FOR INCOMPLETENESS
0
$0
1
$102,880
4
$107,702
3
$82,303
0
$0
0
$0
1
$41,150
Aggregated Statistics For Year 2006 (Based on 2 partial tracts)
A) FHA, FSA/RHS & VA Home Purchase Loans
B) Conventional Home Purchase Loans
C) Refinancings
D) Home Improvement Loans
F) Non-occupant Loans on < 5 Family Dwellings (A B C & D)
G) Loans On Manufactured Home Dwelling (A B C & D)
Number
Average Value
Number
Average Value
Number
Average Value
Number
Average Value
Number
Average Value
Number
Average Value
LOANS ORIGINATED
6
$110,382
102
$79,568
80
$74,476
69
$30,305
8
$40,670
32
$51,239
APPLICATIONS APPROVED, NOT ACCEPTED
3
$135,460
9
$75,302
12
$75,874
3
$40,293
1
$96,450
10
$68,801
APPLICATIONS DENIED
4
$61,408
48
$72,337
64
$73,744
50
$26,106
8
$39,545
35
$48,060
APPLICATIONS WITHDRAWN
3
$53,583
9
$145,176
53
$81,722
6
$73,088
3
$48,867
9
$64,014
FILES CLOSED FOR INCOMPLETENESS
0
$0
4
$65,265
3
$84,020
0
$0
0
$0
0
$0
Aggregated Statistics For Year 2005 (Based on 2 partial tracts)
A) FHA, FSA/RHS & VA Home Purchase Loans
B) Conventional Home Purchase Loans
C) Refinancings
D) Home Improvement Loans
E) Loans on Dwellings For 5+ Families
F) Non-occupant Loans on < 5 Family Dwellings (A B C & D)
G) Loans On Manufactured Home Dwelling (A B C & D)
Number
Average Value
Number
Average Value
Number
Average Value
Number
Average Value
Number
Average Value
Number
Average Value
Number
Average Value
LOANS ORIGINATED
9
$70,873
51
$92,617
75
$54,784
44
$25,691
1
$118,310
13
$44,021
23
$56,920
APPLICATIONS APPROVED, NOT ACCEPTED
3
$89,590
18
$70,301
28
$64,621
5
$12,346
0
$0
1
$133,740
10
$59,156
APPLICATIONS DENIED
5
$95,936
33
$116,831
96
$65,867
36
$22,719
0
$0
8
$19,129
37
$42,959
APPLICATIONS WITHDRAWN
0
$0
21
$85,672
39
$98,560
6
$167,395
0
$0
3
$225,480
5
$54,270
FILES CLOSED FOR INCOMPLETENESS
0
$0
1
$128,600
17
$89,491
0
$0
0
$0
0
$0
3
$49,297
Aggregated Statistics For Year 2004 (Based on 2 partial tracts)
A) FHA, FSA/RHS & VA Home Purchase Loans
B) Conventional Home Purchase Loans
C) Refinancings
D) Home Improvement Loans
F) Non-occupant Loans on < 5 Family Dwellings (A B C & D)
G) Loans On Manufactured Home Dwelling (A B C & D)
Number
Average Value
Number
Average Value
Number
Average Value
Number
Average Value
Number
Average Value
Number
Average Value
LOANS ORIGINATED
8
$94,039
55
$91,049
50
$62,628
48
$21,808
5
$126,028
26
$40,410
APPLICATIONS APPROVED, NOT ACCEPTED
0
$0
5
$64,300
17
$63,771
3
$17,147
0
$0
6
$57,227
APPLICATIONS DENIED
0
$0
15
$66,015
94
$60,784
30
$12,989
8
$81,179
24
$40,080
APPLICATIONS WITHDRAWN
1
$123,460
8
$89,378
41
$75,811
8
$62,692
5
$46,554
6
$86,590
FILES CLOSED FOR INCOMPLETENESS
0
$0
0
$0
10
$76,388
1
$32,150
0
$0
0
$0
Aggregated Statistics For Year 2003 (Based on 2 partial tracts)
A) FHA, FSA/RHS & VA Home Purchase Loans
B) Conventional Home Purchase Loans
C) Refinancings
D) Home Improvement Loans
E) Loans on Dwellings For 5+ Families
F) Non-occupant Loans on < 5 Family Dwellings (A B C & D)
Number
Average Value
Number
Average Value
Number
Average Value
Number
Average Value
Number
Average Value
Number
Average Value
LOANS ORIGINATED
1
$51,440
42
$66,688
90
$62,014
42
$11,207
1
$115,740
8
$44,689
APPLICATIONS APPROVED, NOT ACCEPTED
3
$38,580
8
$51,279
15
$62,243
1
$24,430
0
$0
1
$29,580
APPLICATIONS DENIED
1
$54,010
28
$63,381
82
$60,928
21
$12,860
0
$0
3
$18,003
APPLICATIONS WITHDRAWN
0
$0
9
$72,588
49
$85,453
5
$37,294
0
$0
4
$21,862
FILES CLOSED FOR INCOMPLETENESS
0
$0
1
$84,880
5
$63,528
0
$0
0
$0
0
$0
Aggregated Statistics For Year 2002 (Based on 2 partial tracts)
A) FHA, FSA/RHS & VA Home Purchase Loans
B) Conventional Home Purchase Loans
C) Refinancings
D) Home Improvement Loans
F) Non-occupant Loans on < 5 Family Dwellings (A B C & D)
Number
Average Value
Number
Average Value
Number
Average Value
Number
Average Value
Number
Average Value
LOANS ORIGINATED
9
$76,160
46
$72,407
84
$56,921
54
$15,122
4
$33,115
APPLICATIONS APPROVED, NOT ACCEPTED
3
$39,867
8
$81,661
14
$36,926
1
$15,430
0
$0
APPLICATIONS DENIED
3
$37,723
17
$40,622
55
$74,050
27
$16,527
4
$36,008
APPLICATIONS WITHDRAWN
0
$0
4
$60,762
42
$69,965
6
$15,860
0
$0
FILES CLOSED FOR INCOMPLETENESS
0
$0
0
$0
14
$67,148
0
$0
0
$0
Aggregated Statistics For Year 2001 (Based on 2 partial tracts)
A) FHA, FSA/RHS & VA Home Purchase Loans
B) Conventional Home Purchase Loans
C) Refinancings
D) Home Improvement Loans
E) Loans on Dwellings For 5+ Families
F) Non-occupant Loans on < 5 Family Dwellings (A B C & D)
Number
Average Value
Number
Average Value
Number
Average Value
Number
Average Value
Number
Average Value
Number
Average Value
LOANS ORIGINATED
5
$48,868
45
$56,956
40
$55,555
50
$13,117
1
$257,200
4
$21,220
APPLICATIONS APPROVED, NOT ACCEPTED
3
$58,727
21
$50,031
12
$43,938
1
$51,440
0
$0
1
$47,580
APPLICATIONS DENIED
1
$74,590
49
$52,359
73
$58,258
27
$7,859
0
$0
9
$19,861
APPLICATIONS WITHDRAWN
1
$73,300
3
$61,300
35
$72,347
4
$27,328
0
$0
4
$50,798
FILES CLOSED FOR INCOMPLETENESS
1
$95,160
3
$54,870
3
$41,580
0
$0
0
$0
0
$0
Aggregated Statistics For Year 2000 (Based on 2 partial tracts)
A) FHA, FSA/RHS & VA Home Purchase Loans
B) Conventional Home Purchase Loans
C) Refinancings
D) Home Improvement Loans
F) Non-occupant Loans on < 5 Family Dwellings (A B C & D)
Number
Average Value
Number
Average Value
Number
Average Value
Number
Average Value
Number
Average Value
LOANS ORIGINATED
9
$45,439
51
$54,869
39
$41,746
40
$19,804
13
$23,544
APPLICATIONS APPROVED, NOT ACCEPTED
0
$0
33
$33,592
18
$49,297
5
$14,660
3
$18,003
APPLICATIONS DENIED
3
$45,010
82
$38,110
54
$49,130
30
$9,131
4
$29,258
APPLICATIONS WITHDRAWN
1
$95,160
5
$19,548
27
$58,346
1
$27,010
0
$0
FILES CLOSED FOR INCOMPLETENESS
1
$72,020
1
$70,730
3
$19,290
0
$0
0
$0
Aggregated Statistics For Year 1999 (Based on 1 partial tract)
A) FHA, FSA/RHS & VA Home Purchase Loans
B) Conventional Home Purchase Loans
C) Refinancings
D) Home Improvement Loans
F) Non-occupant Loans on < 5 Family Dwellings (A B C & D)


 Nearest zip codes: 13864, 13827, 14883, 14817, 13734, 13845.