Estimated zip code population in 2022: 1,932 Zip code population in 2010: 1,517 Zip code population in 2000: 1,372
Houses and condos: 889 Renter-occupied apartments: 119
% of renters here:
16%
State:
46%
March 2022 cost of living index in zip code 13809: 95.1 (less than average, U.S. average is 100)
Land area: 30.1 sq. mi. Water area: 0.0 sq. mi.
Population density: 64 people per square mile
(very low).
OSM Map
General Map
Google Map
MSN Map
OSM Map
General Map
Google Map
MSN Map
OSM Map
General Map
Google Map
MSN Map
OSM Map
General Map
Google Map
MSN Map
Please wait while loading the map...
Real estate property taxes paid for housing units in 2022:
This zip code:
1.6% ($2,422)
New York:
1.5% ($6,180)
Median real estate property taxes paid for housing units with mortgages in 2022: $2,565 (1.4%) Median real estate property taxes paid for housing units with no mortgage in 2022: $2,286 (2.2%)
Business Search- 14 Million verified businesses
Males: 898
(46.5%)
Females: 1,034
(53.5%)
For population 25 years and over in 13809:
High school or higher: 91.7%
Bachelor's degree or higher: 13.5%
Graduate or professional degree: 6.2%
Unemployed: 12.3%
Mean travel time to work (commute): 32.0 minutes
For population 15 years and over in 13809:
Never married: 30.5%
Now married: 50.1%
Separated: 2.1%
Widowed: 3.9%
Divorced: 13.4%
Zip code 13809 compared to state average:
Median household income below state average.
Median house value significantly below state average.
Unemployed percentage above state average.
Black race population percentage significantly below state average.
Hispanic race population percentage significantly below state average.
Foreign-born population percentage significantly below state average.
Renting percentage significantly below state average.
Length of stay since moving in significantly below state average.
Number of college students below state average.
Percentage of population with a bachelor's degree or higher significantly below state average.
Averages for the 2020 tax year for zip code 13809, filed in 2021:
Average Adjusted Gross Income (AGI) in 2020: $51,104 (Individual Income Tax Returns)
Here:
$51,104
State:
$90,930
Salary/wage: $47,509 (reported on 76.4% of returns)
Here:
$47,509
State:
$72,104
(% of AGI for various income ranges: 1147.3% for AGIs below $25k, 3457.8% for AGIs $25k-50k, 6458.8% for AGIs $50k-75k, 11120.0% for AGIs $75k-100k, 17140.0% for AGIs $100k-200k)
Taxable interest for individuals: $526 (reported on 31.9% of returns)
This zip code:
$526
New York:
$3,075
(% of AGI for various income ranges: 22.0% for AGIs below $25k, 14.4% for AGIs $25k-50k, 38.8% for AGIs $50k-75k, 25.0% for AGIs $75k-100k, 42.0% for AGIs $100k-200k)
Ordinary dividends: $1,145 (reported on 15.3% of returns)
Here:
$1,145
State:
$11,095
(% of AGI for various income ranges: 12.7% for AGIs below $25k, 8.3% for AGIs $25k-50k, 80.0% for AGIs $50k-75k, 70.0% for AGIs $75k-100k)
Net capital gain/loss in AGI: +$1,171 (reported on 9.7% of returns)
Here:
+$1,171
State:
+$44,925
(% of AGI for various income ranges: 27.8% for AGIs $25k-50k, 40.0% for AGIs $50k-75k)
Profit/loss from business: +$6,688 (reported on 11.1% of returns)
Here:
+$6,688
State:
+$14,940
(% of AGI for various income ranges: 106.7% for AGIs below $25k, 168.9% for AGIs $25k-50k, 88.8% for AGIs $50k-75k)
Taxable individual retirement arrangement distribution: $8,343 (reported on 9.7% of returns)
13809:
$8,343
New York:
$19,609
(% of AGI for various income ranges: 155.3% for AGIs below $25k, 438.8% for AGIs $50k-75k)
Earned income credit: $2,308 (reported on 16.7% of returns)
Here:
$2,308
State:
$2,138
(% of AGI for various income ranges: 88.7% for AGIs below $25k, 80.0% for AGIs $25k-50k)
Percentage of individuals using paid preparers for their 2020 taxes: 97.2%
Here:
97%
State:
95%
(% for various income ranges: 95.5% for AGIs below $25k, 100.0% for AGIs $25k-50k, 100.0% for AGIs $50k-75k, 100.0% for AGIs $75k-100k, 87.5% for AGIs $100k-200k)
Averages for the 2012 tax year for zip code 13809, filed in 2013:
Average Adjusted Gross Income (AGI) in 2012: $41,879 (Individual Income Tax Returns)
Here:
$41,879
State:
$77,088
Salary/wage: $36,380 (reported on 83.6% of returns)
Here:
$36,380
State:
$60,593
(% of AGI for various income ranges: 62.0% for AGIs below $25k, 82.1% for AGIs $25k-50k, 72.3% for AGIs $50k-75k, 76.3% for AGIs $75k-100k, 62.9% for AGIs $100k-200k)
Taxable interest for individuals: $796 (reported on 32.9% of returns)
This zip code:
$796
New York:
$3,125
(% of AGI for various income ranges: 1.0% for AGIs below $25k, 0.8% for AGIs $25k-50k, 0.4% for AGIs $50k-75k, 0.7% for AGIs $75k-100k, 0.4% for AGIs $100k-200k)
Ordinary dividends: $1,755 (reported on 15.1% of returns)
Here:
$1,755
State:
$10,299
(% of AGI for various income ranges: 0.4% for AGIs below $25k, 0.4% for AGIs $25k-50k, 1.5% for AGIs $50k-75k, 0.5% for AGIs $75k-100k)
Net capital gain/loss in AGI: +$843 (reported on 9.6% of returns)
Here:
+$843
State:
+$42,474
Profit/loss from business: +$2,900 (reported on 11.0% of returns)
Here:
+$2,900
State:
+$16,168
(% of AGI for various income ranges: 5.2% for AGIs below $25k, 1.2% for AGIs $25k-50k)
Taxable individual retirement arrangement distribution: $8,757 (reported on 9.6% of returns)
13809:
$8,757
New York:
$17,621
Total itemized deductions: $15,631 (21% of AGI, reported on 17.8% of returns)
Here:
$15,631
State:
$34,985
Here:
21.2% of AGI
State:
21.3% of AGI
(% of AGI for various income ranges: 7.9% for AGIs below $25k, 5.1% for AGIs $25k-50k, 8.8% for AGIs $50k-75k, 11.3% for AGIs $100k-200k)
Charity contributions: $1,357 (reported on 9.6% of returns)
Here:
$1,357
State:
$5,572
(% of AGI for various income ranges: 0.4% for AGIs below $25k, 0.6% for AGIs $50k-75k, 0.6% for AGIs $100k-200k)
Taxes paid: $7,046 (reported on 17.8% of returns)
13809:
$7,046
State:
$18,656
(% of AGI for various income ranges: 1.5% for AGIs below $25k, 1.8% for AGIs $25k-50k, 4.2% for AGIs $50k-75k, 6.6% for AGIs $100k-200k)
Earned income credit: $1,820 (reported on 20.5% of returns)
Here:
$1,820
State:
$2,230
(% of AGI for various income ranges: 6.2% for AGIs below $25k, 0.8% for AGIs $25k-50k)
Percentage of individuals using paid preparers for their 2012 taxes: 53.4%
Here:
53%
State:
66%
(% for various income ranges: 48.3% for AGIs below $25k, 52.4% for AGIs $25k-50k, 61.5% for AGIs $50k-75k, 66.7% for AGIs $75k-100k, 50.0% for AGIs $100k-200k)
Averages for the 2004 tax year for zip code 13809, filed in 2005:
Average Adjusted Gross Income (AGI) in 2004: $34,121 (Individual Income Tax Returns)
Here:
$34,121
State:
$59,519
Salary/wage: $32,739 (reported on 84.8% of returns)
Here:
$32,739
State:
$50,673
(% of AGI for various income ranges: 142.1% for AGIs below $10k, 77.4% for AGIs $10k-25k, 83.9% for AGIs $25k-50k, 83.6% for AGIs $50k-75k, 86.9% for AGIs $75k-100k, 56.6% for AGIs over 100k)
Taxable interest for individuals: $971 (reported on 45.7% of returns)
This zip code:
$971
New York:
$2,377
(% of AGI for various income ranges: 5.3% for AGIs below $10k, 2.8% for AGIs $10k-25k, 1.1% for AGIs $25k-50k, 0.9% for AGIs $50k-75k, 0.4% for AGIs $75k-100k, 1.8% for AGIs over 100k)
Taxable dividends: $1,111 (reported on 19.4% of returns)
Here:
$1,111
State:
$5,394
(% of AGI for various income ranges: 1.8% for AGIs below $10k, 0.2% for AGIs $10k-25k, 1.2% for AGIs $25k-50k, 0.5% for AGIs $50k-75k, 0.1% for AGIs $75k-100k, 0.4% for AGIs over 100k)
Net capital gain/loss: +$1,733 (reported on 12.1% of returns)
Here:
+$1,733
State:
+$23,581
(% of AGI for various income ranges: 2.5% for AGIs below $10k, 0.7% for AGIs $10k-25k, 0.1% for AGIs $25k-50k, 0.0% for AGIs $50k-75k, 2.7% for AGIs $75k-100k)
Profit/loss from business: +$3,103 (reported on 10.5% of returns)
Here:
+$3,103
State:
+$13,809
(% of AGI for various income ranges: 11.7% for AGIs below $10k, -0.5% for AGIs $10k-25k, 1.7% for AGIs $25k-50k, 1.1% for AGIs $50k-75k)
Profit/loss from farming: +$2,364 (reported on 1.5% of returns)
Here:
+$2,364
State:
-$2,666
IRA payment deduction: $3,250 (reported on 2.7% of returns)
13809:
$3,250
New York:
$3,115
Total itemized deductions: $14,175 (22% of AGI, reported on 16.2% of returns)
Here:
$14,175
State:
$25,864
Here:
21.8% of AGI
State:
21.9% of AGI
(% of AGI for various income ranges: 29.4% for AGIs below $10k, 4.0% for AGIs $25k-50k, 6.9% for AGIs $50k-75k, 11.1% for AGIs $75k-100k, 11.4% for AGIs over 100k)
Charity contributions deductions: $1,500 (2% of AGI, reported on 12.7% of returns)
Here:
$1,500
State:
$4,439
Here:
2.2% of AGI
State:
3.6% of AGI
(% of AGI for various income ranges: 0.3% for AGIs $25k-50k, 0.6% for AGIs $50k-75k, 1.4% for AGIs $75k-100k, 0.7% for AGIs over 100k)
Total tax: $4,076 (reported on 72.9% of returns)
13809:
$4,076
State:
$11,730
(% of AGI for various income ranges: 3.0% for AGIs below $10k, 3.5% for AGIs $10k-25k, 6.7% for AGIs $25k-50k, 8.8% for AGIs $50k-75k, 11.3% for AGIs $75k-100k, 16.7% for AGIs over 100k)
Earned income credit: $1,654 (reported on 18.3% of returns)
Here:
$1,654
State:
$1,757
Percentage of individuals using paid preparers for their 2004 taxes: 57.8%
Here:
58%
State:
67%
(% for various income ranges: 52.3% for AGIs below $10k, 55.1% for AGIs $10k-25k, 61.1% for AGIs $25k-50k, 60.2% for AGIs $50k-75k, 63.3% for AGIs $75k-100k, 63.2% for AGIs over 100k)
Household received Food Stamps/SNAP in the past 12 months: 101 Household did not receive Food Stamps/SNAP in the past 12 months: 640
Women who had a birth in the past 12 months: 51 (45 now married, 5 unmarried) Women who did not have a birth in the past 12 months: 449 (178 now married, 270 unmarried)
Housing units in zip code 13809 with a mortgage: 352 (90 second mortgage, 57 both second mortgage and home equity loan) Median monthly owner costs for units with a mortgage: $1,096 Median monthly owner costs for units without a mortgage: $551
Residents with income below the poverty level in 2022:
This zip code:
12.6%
Whole state:
14.3%
Residents with income below 50% of the poverty level in 2022:
This zip code:
2.5%
Whole state:
6.8%
Median number of rooms in houses and condos:
Here:
5.6
State:
6.3
Median number of rooms in apartments:
Here:
4.5
State:
3.8
Notable locations in this zip code not listed on our city pages
Size of family households: 171 2-persons, 116 3-persons, 63 4-persons, 96 5-persons, 6 6-persons
Size of nonfamily households: 234 1-person, 54 2-persons
262 married couples with children.
105 single-parent households (27 men, 78 women).
99.0% of residents of 13809 zip code speak English at home.
0.3% of residents speak other Indo-European language at home (100% well).
0.8% of residents speak other language at home (43% very well, 57% not well).
Foreign born population: 21 (1.1%) (73.7% of them are naturalized citizens)
This zip code:
1.1%
Whole state:
22.7%
33%Sweden
24%Iraq
40%American
13%European
8%Irish
7%English
6%German
5%Norwegian
4%Italian
Year of entry for the foreign-born population
132010 or later
02000 to 2009
01990 to 1999
23Before 1990
Housing units lacking complete plumbing facilities: 2.3% Housing units lacking complete kitchen facilities: 2.6%
43.9%Fuel oil, kerosene, etc.
28.8%Bottled, tank, or LP gas
18.6%Wood
8.9%Electricity
Population in 1990: 1,462.
Place of birth for U.S.-born residents:
This state: 1,619
Northeast: 157
Midwest: 4
South: 56
West: 53
66% of the 13809 zip code residents lived in the same house 5 years ago. Out of people who lived in different houses, 48% lived in this county. Out of people who lived in different counties, 50% lived in New York.
82% of the 13809 zip code residents lived in the same house 1 year ago. Out of people who lived in different houses, 70% moved from this county. Out of people who lived in different houses, 23% moved from different county within same state. Out of people who lived in different houses, 3% moved from different state. Out of people who lived in different houses, 2% moved from abroad.
Private vs. public school enrollment:
Students in private schools in grades 1 to 8 (elementary and middle school): 47
Here:
49.5%
New York:
15.6%
Students in private schools in grades 9 to 12 (high school): 22
Here:
17.9%
New York:
15.0%
Students in private undergraduate colleges: 6
Here:
14.3%
New York:
39.2%
Occupation by median earnings in the past 12 months ($)
61,849Health diagnosing and treating practitioners and other technical occupations
54,370Construction and extraction occupations
51,862Office and administrative support occupations
45,034Management occupations
40,664Production occupations
34,526Healthcare support occupations
Top industries in this zip code by the number of employees in 2005:
Accommodation and Food Services: Drinking Places (Alcoholic Beverages) (1-4: 2)
Construction: New Single-Family Housing Construction (except Operative Builders) (1-4: 2)
Accommodation and Food Services: Full-Service Restaurants (1-4: 2)
Construction: Poured Concrete Foundation and Structure Contractors (1-4: 1)
Construction: All Other Specialty Trade Contractors (1-4: 1)
Other Services (except Public Administration): Automotive Body, Paint, and Interior Repair and Maintenance (1-4: 1)
People in group quarters in 2010:
3 people in group homes intended for adults
Fatal accident statistics in 2013:
Fatal accident count: 1
Vehicles involved in fatal accidents: 1
Fatal accidents caused by drunken drivers: 0
Fatalities: 1
Persons involved in fatal accidents: 1
Pedestrians involved in fatal accidents: 0
2003 - 2018 National Fire Incident Reporting System (NFIRS) incidents
According to the data from the years 2003 - 2018 the average number of fires per year is 7. The highest number of reported fire incidents - 24 took place in 2008, and the least - 0 in 2006. The data has a growing trend.
When looking into fire subcategories, the most incidents belonged to: Structure Fires (61.5%), and Outside Fires (24.8%).
Fire incident types reported to NFIRS in Zip Code 13809


+$2,364
-$2,666
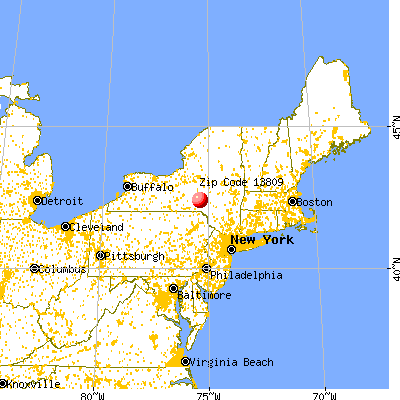
 Nearest zip codes: 13780, 13776, 13843, 13849, 13838, 13733.


 According to the data from the years 2003 - 2018 the average number of fires per year is 7. The highest number of reported fire incidents - 24 took place in 2008, and the least - 0 in 2006. The data has a growing trend.
 When looking into fire subcategories, the most incidents belonged to: Structure Fires (61.5%), and Outside Fires (24.8%).