Estimated zip code population in 2022: 1,464 Zip code population in 2010: 1,281 Zip code population in 2000: 1,111
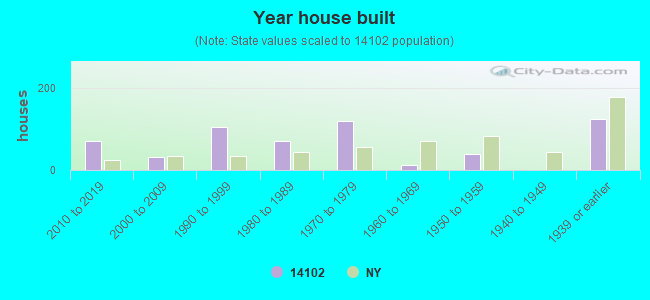
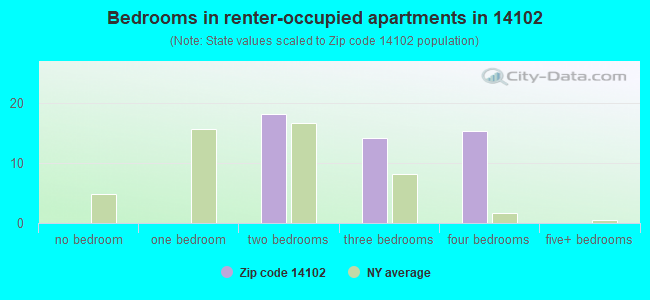
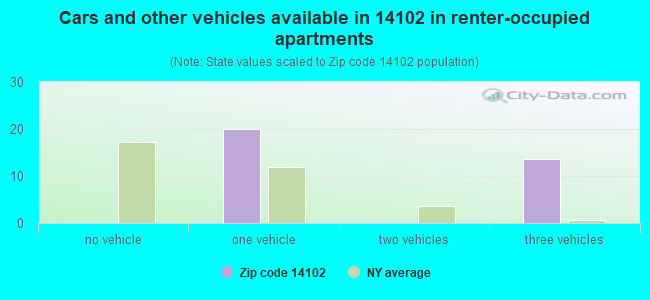
Houses and condos: 568 Renter-occupied apartments: 33
% of renters here:
6%
State:
46%
March 2022 cost of living index in zip code 14102: 93.7 (less than average, U.S. average is 100)
Land area: 3.8 sq. mi. Water area: 0.0 sq. mi.
Population density: 384 people per square mile
(very low).
OSM Map
General Map
Google Map
MSN Map
OSM Map
General Map
Google Map
MSN Map
OSM Map
General Map
Google Map
MSN Map
OSM Map
General Map
Google Map
MSN Map
Please wait while loading the map...
Real estate property taxes paid for housing units in 2022:
This zip code:
1.9% ($6,037)
New York:
1.5% ($6,180)
Median real estate property taxes paid for housing units with mortgages in 2022: $6,390 (1.9%) Median real estate property taxes paid for housing units with no mortgage in 2022: $3,732 (1.9%)
Business Search- 14 Million verified businesses
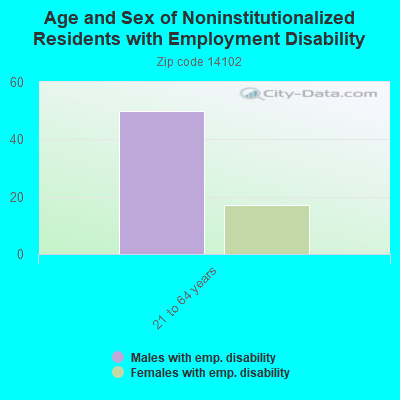
Males: 917
(62.6%)
Females: 547
(37.4%)
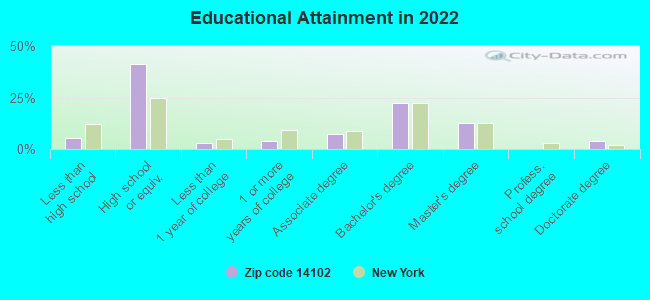
For population 25 years and over in 14102:
High school or higher: 94.6%
Bachelor's degree or higher: 39.4%
Graduate or professional degree: 16.9%
Unemployed: 3.4%
Mean travel time to work (commute): 27.6 minutes
For population 15 years and over in 14102:
Never married: 22.7%
Now married: 70.2%
Separated: 0.0%
Widowed: 1.1%
Divorced: 5.9%
Zip code 14102 compared to state average:
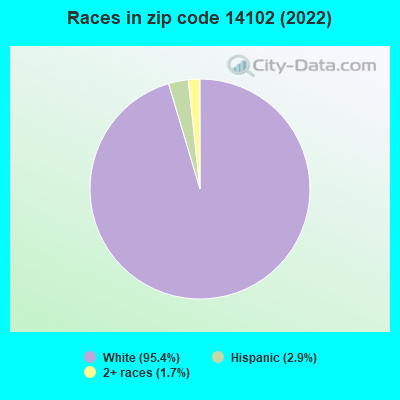
Black race population percentage significantly below state average.
Hispanic race population percentage significantly below state average.
Median age above state average.
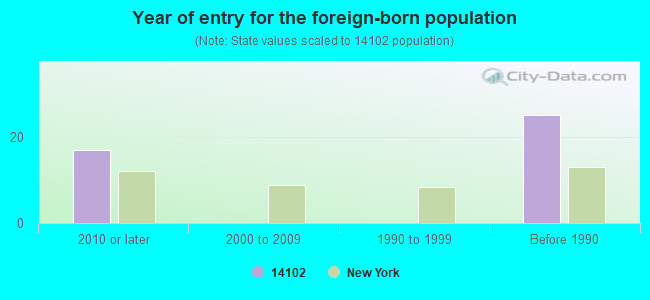
Foreign-born population percentage significantly below state average.
Renting percentage significantly below state average.
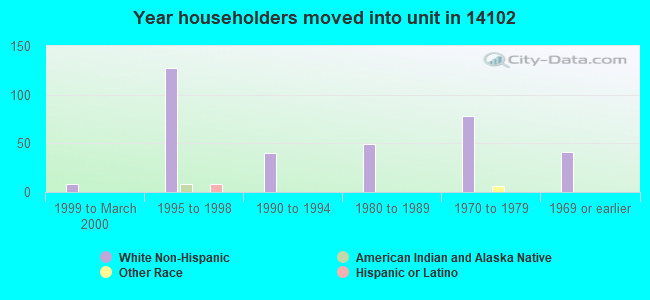
Length of stay since moving in significantly above state average.
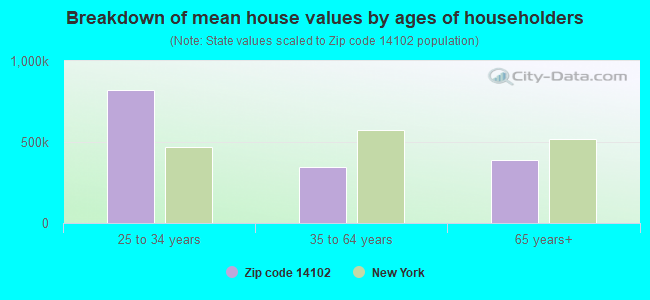
Estimated median house/condo value in 2022: $310,333
14102:
$310,333
New York:
$400,400
Median resident age:
This zip code:
46.1 years
New York median age:
40.0 years
Average household size:
This zip code:
2.5 people
New York:
2.5 people
Averages for the 2020 tax year for zip code 14102, filed in 2021:
Average Adjusted Gross Income (AGI) in 2020: $74,809 (Individual Income Tax Returns)
Here:
$74,809
State:
$90,930
Salary/wage: $74,020 (reported on 79.7% of returns)
Here:
$74,020
State:
$72,104
(% of AGI for various income ranges: 1101.0% for AGIs below $25k, 3305.5% for AGIs $25k-50k, 6095.7% for AGIs $50k-75k, 7693.3% for AGIs $75k-100k, 15250.0% for AGIs $100k-200k)
Taxable interest for individuals: $750 (reported on 50.0% of returns)
This zip code:
$750
New York:
$3,075
(% of AGI for various income ranges: 5.0% for AGIs below $25k, 40.9% for AGIs $25k-50k, 42.9% for AGIs $50k-75k, 43.3% for AGIs $75k-100k, 103.3% for AGIs $100k-200k)
Ordinary dividends: $2,576 (reported on 26.6% of returns)
Here:
$2,576
State:
$11,095
(% of AGI for various income ranges: 77.3% for AGIs $25k-50k, 102.9% for AGIs $50k-75k, 100.0% for AGIs $75k-100k, 111.1% for AGIs $100k-200k)
Net capital gain/loss in AGI: +$6,038 (reported on 20.3% of returns)
Here:
+$6,038
State:
+$44,925
(% of AGI for various income ranges: 133.6% for AGIs $25k-50k, 125.0% for AGIs $75k-100k, 148.9% for AGIs $100k-200k)
Profit/loss from business: +$5,529 (reported on 10.9% of returns)
Here:
+$5,529
State:
+$14,940
(% of AGI for various income ranges: 133.6% for AGIs $25k-50k, 400.0% for AGIs $75k-100k)
Taxable individual retirement arrangement distribution: $13,867 (reported on 14.1% of returns)
14102:
$13,867
New York:
$19,609
(% of AGI for various income ranges: 248.0% for AGIs below $25k, 670.0% for AGIs $50k-75k, 590.0% for AGIs $100k-200k)
Total itemized deductions: $26,567 (reported on 4.7% of returns)
Here:
$26,567
State:
$39,326
(% of AGI for various income ranges: 1328.3% for AGIs $75k-100k)
Charity contributions: $6,300 (reported on 3.1% of returns)
Here:
$6,300
State:
$15,420
(% of AGI for various income ranges: 180.0% for AGIs $50k-75k)
Taxes paid: $7,050 (reported on 6.2% of returns)
14102:
$7,050
State:
$9,183
(% of AGI for various income ranges: 470.0% for AGIs $75k-100k)
Earned income credit: $1,425 (reported on 6.2% of returns)
Here:
$1,425
State:
$2,138
(% of AGI for various income ranges: 57.0% for AGIs below $25k)
Percentage of individuals using paid preparers for their 2020 taxes: 100.0%
Here:
100%
State:
95%
(% for various income ranges: 100.0% for AGIs below $25k, 100.0% for AGIs $25k-50k, 100.0% for AGIs $50k-75k, 100.0% for AGIs $75k-100k, 100.0% for AGIs $100k-200k, 100.0% for AGIs over 200k)
Averages for the 2012 tax year for zip code 14102, filed in 2013:
Average Adjusted Gross Income (AGI) in 2012: $59,840 (Individual Income Tax Returns)
Here:
$59,840
State:
$77,088
Salary/wage: $54,869 (reported on 83.1% of returns)
Here:
$54,869
State:
$60,593
(% of AGI for various income ranges: 70.0% for AGIs below $25k, 71.5% for AGIs $25k-50k, 68.2% for AGIs $50k-75k, 80.5% for AGIs $75k-100k, 78.9% for AGIs $100k-200k)
Taxable interest for individuals: $497 (reported on 52.3% of returns)
This zip code:
$497
New York:
$3,125
(% of AGI for various income ranges: 1.4% for AGIs below $25k, 0.8% for AGIs $25k-50k, 0.6% for AGIs $50k-75k, 0.4% for AGIs $75k-100k, 0.2% for AGIs $100k-200k)
Ordinary dividends: $1,900 (reported on 26.2% of returns)
Here:
$1,900
State:
$10,299
(% of AGI for various income ranges: 1.1% for AGIs below $25k, 0.5% for AGIs $25k-50k, 1.0% for AGIs $50k-75k, 0.4% for AGIs $75k-100k, 1.0% for AGIs $100k-200k)
Profit/loss from business: +$6,871 (reported on 10.8% of returns)
Here:
+$6,871
State:
+$16,168
(% of AGI for various income ranges: 3.6% for AGIs below $25k, 4.4% for AGIs $25k-50k, 2.8% for AGIs $75k-100k)
Taxable individual retirement arrangement distribution: $11,871 (reported on 10.8% of returns)
14102:
$11,871
New York:
$17,621
Total itemized deductions: $20,900 (19% of AGI, reported on 35.4% of returns)
Here:
$20,900
State:
$34,985
Here:
18.8% of AGI
State:
21.3% of AGI
(% of AGI for various income ranges: 12.5% for AGIs $25k-50k, 13.6% for AGIs $50k-75k, 15.1% for AGIs $75k-100k, 12.9% for AGIs $100k-200k)
Charity contributions: $1,986 (reported on 32.3% of returns)
Here:
$1,986
State:
$5,572
(% of AGI for various income ranges: 0.5% for AGIs $25k-50k, 1.7% for AGIs $50k-75k, 1.5% for AGIs $75k-100k, 1.1% for AGIs $100k-200k)
Taxes paid: $10,961 (reported on 35.4% of returns)
14102:
$10,961
State:
$18,656
(% of AGI for various income ranges: 4.4% for AGIs $25k-50k, 5.1% for AGIs $50k-75k, 7.2% for AGIs $75k-100k, 8.0% for AGIs $100k-200k)
Earned income credit: $1,680 (reported on 7.7% of returns)
Here:
$1,680
State:
$2,230
(% of AGI for various income ranges: 3.0% for AGIs below $25k)
Percentage of individuals using paid preparers for their 2012 taxes: 64.6%
Here:
65%
State:
66%
(% for various income ranges: 62.5% for AGIs below $25k, 58.3% for AGIs $25k-50k, 66.7% for AGIs $50k-75k, 71.4% for AGIs $75k-100k, 69.2% for AGIs $100k-200k)
Averages for the 2004 tax year for zip code 14102, filed in 2005:
Average Adjusted Gross Income (AGI) in 2004: $48,831 (Individual Income Tax Returns)
Here:
$48,831
State:
$59,519
Salary/wage: $44,194 (reported on 85.3% of returns)
Here:
$44,194
State:
$50,673
(% of AGI for various income ranges: 91.0% for AGIs below $10k, 62.8% for AGIs $10k-25k, 68.1% for AGIs $25k-50k, 85.7% for AGIs $50k-75k, 85.9% for AGIs $75k-100k, 73.5% for AGIs over 100k)
Taxable interest for individuals: $769 (reported on 69.7% of returns)
This zip code:
$769
New York:
$2,377
(% of AGI for various income ranges: 2.0% for AGIs below $10k, 2.3% for AGIs $10k-25k, 1.7% for AGIs $25k-50k, 0.5% for AGIs $50k-75k, 0.4% for AGIs $75k-100k, 1.2% for AGIs over 100k)
Taxable dividends: $1,028 (reported on 34.6% of returns)
Here:
$1,028
State:
$5,394
(% of AGI for various income ranges: 0.4% for AGIs below $10k, 1.2% for AGIs $10k-25k, 0.8% for AGIs $25k-50k, 0.4% for AGIs $50k-75k, 0.5% for AGIs $75k-100k, 1.0% for AGIs over 100k)
Net capital gain/loss: +$300 (reported on 20.9% of returns)
Here:
+$300
State:
+$23,581
(% of AGI for various income ranges: -1.8% for AGIs below $10k, -1.0% for AGIs $10k-25k, 0.7% for AGIs $25k-50k, 0.7% for AGIs $50k-75k, -0.1% for AGIs $75k-100k, -0.2% for AGIs over 100k)
Profit/loss from business: +$7,633 (reported on 12.7% of returns)
Here:
+$7,633
State:
+$13,809
(% of AGI for various income ranges: 10.7% for AGIs $10k-25k, 3.4% for AGIs $25k-50k, 1.3% for AGIs $50k-75k, 2.4% for AGIs $75k-100k)
IRA payment deduction: $2,250 (reported on 3.2% of returns)
14102:
$2,250
New York:
$3,115
Total itemized deductions: $16,502 (20% of AGI, reported on 40.4% of returns)
Here:
$16,502
State:
$25,864
Here:
20.3% of AGI
State:
21.9% of AGI
(% of AGI for various income ranges: 16.6% for AGIs $10k-25k, 11.0% for AGIs $25k-50k, 15.3% for AGIs $50k-75k, 16.1% for AGIs $75k-100k, 12.9% for AGIs over 100k)
Charity contributions deductions: $2,556 (3% of AGI, reported on 38.8% of returns)
Here:
$2,556
State:
$4,439
Here:
3.1% of AGI
State:
3.6% of AGI
(% of AGI for various income ranges: 1.9% for AGIs $10k-25k, 1.5% for AGIs $25k-50k, 2.3% for AGIs $50k-75k, 2.2% for AGIs $75k-100k, 2.2% for AGIs over 100k)
Total tax: $5,508 (reported on 79.2% of returns)
14102:
$5,508
State:
$11,730
(% of AGI for various income ranges: 2.4% for AGIs below $10k, 4.7% for AGIs $10k-25k, 7.2% for AGIs $25k-50k, 8.0% for AGIs $50k-75k, 9.7% for AGIs $75k-100k, 11.5% for AGIs over 100k)
Earned income credit: $1,542 (reported on 7.7% of returns)
Here:
$1,542
State:
$1,757
Percentage of individuals using paid preparers for their 2004 taxes: 65.1%
Here:
65%
State:
67%
(% for various income ranges: 49.6% for AGIs below $10k, 65.5% for AGIs $10k-25k, 65.4% for AGIs $25k-50k, 73.0% for AGIs $50k-75k, 76.8% for AGIs $75k-100k, 67.2% for AGIs over 100k)
Household received Food Stamps/SNAP in the past 12 months: 47 Household did not receive Food Stamps/SNAP in the past 12 months: 521
Women who had a birth in the past 12 months: 16 (16 now married, 0 unmarried) Women who did not have a birth in the past 12 months: 284 (182 now married, 98 unmarried)
Housing units in zip code 14102 with a mortgage: 431 (45 second mortgage, 45 both second mortgage and home equity loan) Houses without a mortgage: 59
Median monthly owner costs for units with a mortgage: $2,158 Median monthly owner costs for units without a mortgage: $636
Residents with income below the poverty level in 2022:
This zip code:
1.5%
Whole state:
14.3%
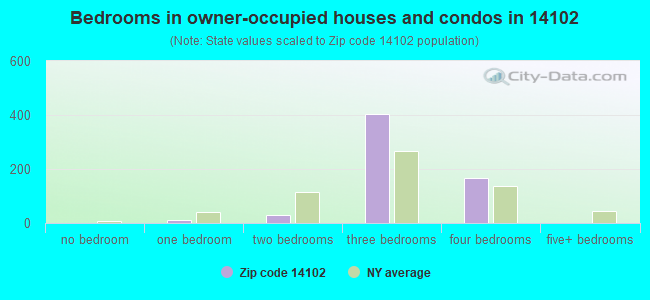
Median number of rooms in houses and condos:
Here:
6.9
State:
6.3
Notable locations in this zip code not listed on our city pages
Size of family households: 210 2-persons, 131 3-persons, 100 4-persons, 34 5-persons
Size of nonfamily households: 60 1-person, 30 2-persons
256 married couples with children.
20 single-parent households (20 women).
97.5% of residents of 14102 zip code speak English at home.
1.0% of residents speak other Indo-European language at home (100% very well).
0.9% of residents speak other language at home (100% very well).
Foreign born population: 27 (1.9%) (100.0% of them are naturalized citizens)
This zip code:
1.9%
Whole state:
22.7%
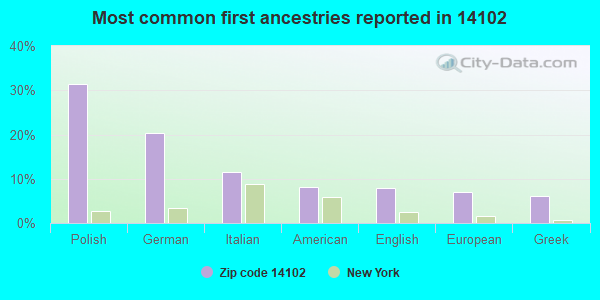
31%Polish
20%German
12%Italian
8%American
8%English
7%European
6%Greek
Year of entry for the foreign-born population
172010 or later
02000 to 2009
01990 to 1999
25Before 1990
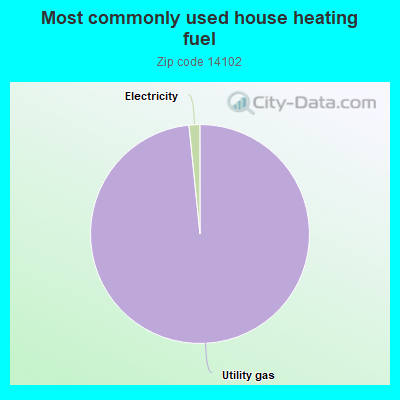
98.5%Utility gas
1.6%Electricity
Population in 1990: 1,063. Population change in the 1990s: +48 (+4.5%).
Place of birth for U.S.-born residents:
This state: 1,395
Northeast: 12
Midwest: 8
60% of the 14102 zip code residents lived in the same house 5 years ago. Out of people who lived in different houses, 72% lived in this county. Out of people who lived in different counties, 50% lived in New York.
98% of the 14102 zip code residents lived in the same house 1 year ago. Out of people who lived in different houses, 90% moved from this county.
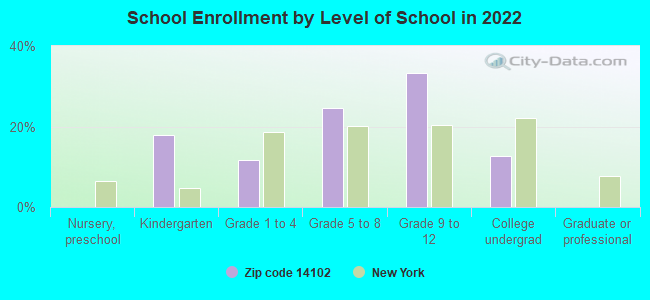
Private vs. public school enrollment:
Students in private schools in grades 1 to 8 (elementary and middle school):
Here:
0.0%
New York:
15.6%
Students in private schools in grades 9 to 12 (high school):
Here:
0.0%
New York:
15.0%
Students in private undergraduate colleges: 7
Here:
20.7%
New York:
39.2%
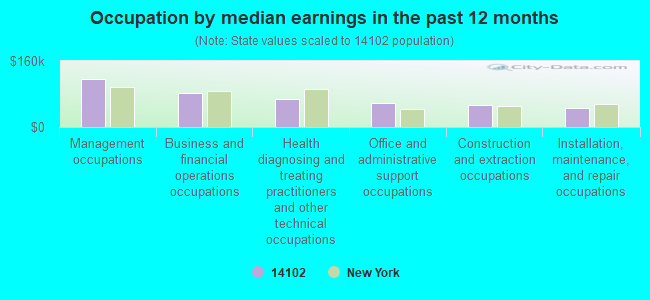
Occupation by median earnings in the past 12 months ($)
141,276Management occupations
79,795Health diagnosing and treating practitioners and other technical occupations
76,107Business and financial operations occupations
51,749Material moving occupations
49,113Construction and extraction occupations
37,883Installation, maintenance, and repair occupations
Top industries in this zip code by the number of employees in 2005:
Construction: Poured Concrete Foundation and Structure Contractors (20-49 employees: 1 establishment)
Construction: New Housing Operative Builders (10-19: 1)
Accommodation and Food Services: Full-Service Restaurants (5-9: 1, 1-4: 1)
Other Services (except Public Administration): Religious Organizations (5-9: 1, 1-4: 1)
Accommodation and Food Services: Limited-Service Restaurants (5-9: 1)
Construction: Framing Contractors (5-9: 1)
Other Services (except Public Administration): General Automotive Repair (1-4: 3)
Construction: Water and Sewer Line and Related Structures Construction (1-4: 1)
Wholesale Trade: Sporting and Recreational Goods and Supplies Merchant Wholesalers (1-4: 1)
Home Mortgage Disclosure Act Aggregated Statistics For Year 2009 (Based on 2 partial tracts)
A) FHA, FSA/RHS & VA Home Purchase Loans
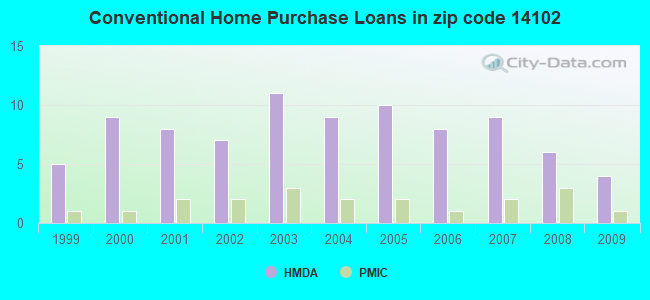
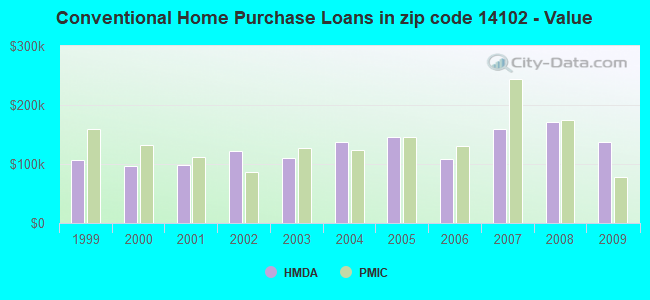
B) Conventional Home Purchase Loans
C) Refinancings
D) Home Improvement Loans
G) Loans On Manufactured Home Dwelling (A B C & D)
Number
Average Value
Number
Average Value
Number
Average Value
Number
Average Value
Number
Average Value
LOANS ORIGINATED
3
$152,613
4
$136,462
10
$147,965
2
$25,250
1
$1,960
APPLICATIONS APPROVED, NOT ACCEPTED
0
$0
0
$0
1
$215,670
0
$0
0
$0
APPLICATIONS DENIED
0
$0
1
$46,050
4
$169,710
1
$14,760
1
$7,290
APPLICATIONS WITHDRAWN
0
$0
0
$0
4
$148,818
0
$0
0
$0
FILES CLOSED FOR INCOMPLETENESS
0
$0
0
$0
0
$0
0
$0
0
$0
Aggregated Statistics For Year 2008 (Based on 2 partial tracts)
A) FHA, FSA/RHS & VA Home Purchase Loans
B) Conventional Home Purchase Loans
C) Refinancings
D) Home Improvement Loans
G) Loans On Manufactured Home Dwelling (A B C & D)
Number
Average Value
Number
Average Value
Number
Average Value
Number
Average Value
Number
Average Value
LOANS ORIGINATED
2
$191,580
6
$171,488
5
$113,578
3
$37,397
1
$8,360
APPLICATIONS APPROVED, NOT ACCEPTED
0
$0
1
$194,510
1
$180,820
0
$0
0
$0
APPLICATIONS DENIED
0
$0
1
$91,920
4
$168,910
3
$61,577
2
$19,290
APPLICATIONS WITHDRAWN
0
$0
0
$0
2
$244,210
0
$0
0
$0
FILES CLOSED FOR INCOMPLETENESS
0
$0
0
$0
1
$108,280
0
$0
0
$0
Aggregated Statistics For Year 2007 (Based on 2 partial tracts)
A) FHA, FSA/RHS & VA Home Purchase Loans
B) Conventional Home Purchase Loans
C) Refinancings
D) Home Improvement Loans
F) Non-occupant Loans on < 5 Family Dwellings (A B C & D)
G) Loans On Manufactured Home Dwelling (A B C & D)
Number
Average Value
Number
Average Value
Number
Average Value
Number
Average Value
Number
Average Value
Number
Average Value
LOANS ORIGINATED
1
$135,310
9
$159,901
7
$132,207
4
$34,405
1
$72,540
1
$5,690
APPLICATIONS APPROVED, NOT ACCEPTED
0
$0
2
$112,015
2
$134,060
1
$9,250
0
$0
0
$0
APPLICATIONS DENIED
1
$100,460
2
$140,375
7
$163,804
2
$36,180
0
$0
1
$7,290
APPLICATIONS WITHDRAWN
0
$0
1
$102,410
3
$145,027
0
$0
0
$0
0
$0
FILES CLOSED FOR INCOMPLETENESS
0
$0
1
$78,230
1
$231,320
0
$0
0
$0
0
$0
Aggregated Statistics For Year 2006 (Based on 2 partial tracts)
A) FHA, FSA/RHS & VA Home Purchase Loans
B) Conventional Home Purchase Loans
C) Refinancings
D) Home Improvement Loans
F) Non-occupant Loans on < 5 Family Dwellings (A B C & D)
G) Loans On Manufactured Home Dwelling (A B C & D)
Number
Average Value
Number
Average Value
Number
Average Value
Number
Average Value
Number
Average Value
Number
Average Value
LOANS ORIGINATED
1
$97,970
8
$108,902
12
$120,030
3
$41,960
1
$58,140
1
$17,070
APPLICATIONS APPROVED, NOT ACCEPTED
0
$0
1
$111,840
1
$185,800
1
$23,650
0
$0
0
$0
APPLICATIONS DENIED
0
$0
1
$105,080
9
$127,226
3
$48,657
0
$0
0
$0
APPLICATIONS WITHDRAWN
0
$0
1
$87,120
6
$167,517
0
$0
0
$0
0
$0
FILES CLOSED FOR INCOMPLETENESS
0
$0
1
$141,350
4
$138,818
0
$0
0
$0
0
$0
Aggregated Statistics For Year 2005 (Based on 2 partial tracts)
B) Conventional Home Purchase Loans
C) Refinancings
D) Home Improvement Loans
G) Loans On Manufactured Home Dwelling (A B C & D)
Number
Average Value
Number
Average Value
Number
Average Value
Number
Average Value
LOANS ORIGINATED
10
$145,031
10
$139,786
4
$28,315
1
$3,560
APPLICATIONS APPROVED, NOT ACCEPTED
1
$116,100
2
$142,860
0
$0
0
$0
APPLICATIONS DENIED
2
$224,740
6
$174,897
3
$69,460
0
$0
APPLICATIONS WITHDRAWN
1
$116,280
8
$147,662
2
$102,855
0
$0
FILES CLOSED FOR INCOMPLETENESS
1
$100,810
2
$134,060
1
$62,410
0
$0
Aggregated Statistics For Year 2004 (Based on 2 partial tracts)
A) FHA, FSA/RHS & VA Home Purchase Loans
B) Conventional Home Purchase Loans
C) Refinancings
D) Home Improvement Loans
G) Loans On Manufactured Home Dwelling (A B C & D)
Number
Average Value
Number
Average Value
Number
Average Value
Number
Average Value
Number
Average Value
LOANS ORIGINATED
1
$73,250
9
$137,953
9
$100,418
4
$29,115
1
$16,890
APPLICATIONS APPROVED, NOT ACCEPTED
0
$0
0
$0
2
$144,105
1
$8,180
0
$0
APPLICATIONS DENIED
0
$0
1
$79,830
9
$124,894
3
$31,707
1
$9,420
APPLICATIONS WITHDRAWN
0
$0
0
$0
7
$116,993
1
$22,580
0
$0
FILES CLOSED FOR INCOMPLETENESS
0
$0
1
$154,150
1
$180,110
0
$0
0
$0
Aggregated Statistics For Year 2003 (Based on 2 partial tracts)
A) FHA, FSA/RHS & VA Home Purchase Loans
B) Conventional Home Purchase Loans
C) Refinancings
D) Home Improvement Loans
F) Non-occupant Loans on < 5 Family Dwellings (A B C & D)
Number
Average Value
Number
Average Value
Number
Average Value
Number
Average Value
Number
Average Value
LOANS ORIGINATED
1
$98,860
11
$109,880
34
$102,852
2
$15,645
1
$80,540
APPLICATIONS APPROVED, NOT ACCEPTED
0
$0
1
$48,010
5
$131,500
0
$0
0
$0
APPLICATIONS DENIED
0
$0
1
$34,670
9
$103,776
1
$9,780
0
$0
APPLICATIONS WITHDRAWN
0
$0
1
$72,540
4
$163,710
0
$0
0
$0
FILES CLOSED FOR INCOMPLETENESS
0
$0
0
$0
0
$0
0
$0
0
$0
Aggregated Statistics For Year 2002 (Based on 2 partial tracts)
A) FHA, FSA/RHS & VA Home Purchase Loans
B) Conventional Home Purchase Loans
C) Refinancings
D) Home Improvement Loans
Number
Average Value
Number
Average Value
Number
Average Value
Number
Average Value
LOANS ORIGINATED
1
$83,740
7
$121,996
21
$96,892
3
$16,537
APPLICATIONS APPROVED, NOT ACCEPTED
0
$0
1
$50,670
3
$95,893
0
$0
APPLICATIONS DENIED
0
$0
1
$83,570
6
$98,175
1
$32,180
APPLICATIONS WITHDRAWN
0
$0
1
$30,230
4
$110,192
0
$0
FILES CLOSED FOR INCOMPLETENESS
0
$0
0
$0
1
$93,880
0
$0
Aggregated Statistics For Year 2001 (Based on 2 partial tracts)
A) FHA, FSA/RHS & VA Home Purchase Loans
B) Conventional Home Purchase Loans
C) Refinancings
D) Home Improvement Loans
Number
Average Value
Number
Average Value
Number
Average Value
Number
Average Value
LOANS ORIGINATED
1
$113,080
8
$98,590
17
$93,669
2
$43,650
APPLICATIONS APPROVED, NOT ACCEPTED
0
$0
0
$0
3
$70,527
0
$0
APPLICATIONS DENIED
0
$0
1
$64,360
7
$98,704
1
$18,140
APPLICATIONS WITHDRAWN
0
$0
1
$81,970
6
$107,510
0
$0
FILES CLOSED FOR INCOMPLETENESS
0
$0
0
$0
1
$113,970
0
$0
Aggregated Statistics For Year 2000 (Based on 2 partial tracts)
A) FHA, FSA/RHS & VA Home Purchase Loans
B) Conventional Home Purchase Loans
C) Refinancings
D) Home Improvement Loans
F) Non-occupant Loans on < 5 Family Dwellings (A B C & D)
Number
Average Value
Number
Average Value
Number
Average Value
Number
Average Value
Number
Average Value
LOANS ORIGINATED
1
$125,700
9
$96,388
6
$63,178
2
$18,760
1
$32,890
APPLICATIONS APPROVED, NOT ACCEPTED
0
$0
2
$38,670
2
$144,285
1
$12,980
0
$0
APPLICATIONS DENIED
0
$0
2
$24,625
4
$72,452
2
$28,895
0
$0
APPLICATIONS WITHDRAWN
0
$0
1
$51,740
2
$101,255
0
$0
0
$0
FILES CLOSED FOR INCOMPLETENESS
0
$0
0
$0
0
$0
0
$0
0
$0
Aggregated Statistics For Year 1999 (Based on 1 partial tract)

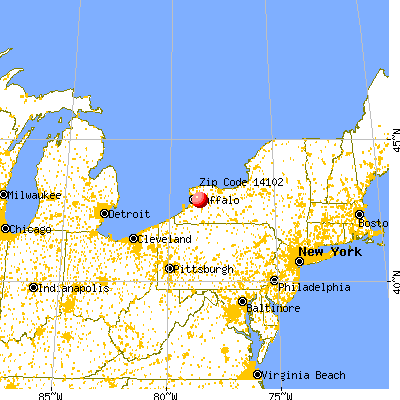


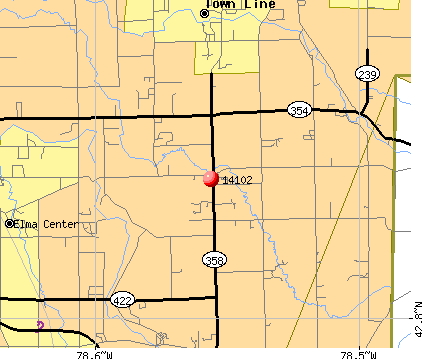 Nearest zip codes: 14052, 14059, 14004, 14169, 14086, 14037.