Estimated zip code population in 2022: 3,739 Zip code population in 2010: 3,817 Zip code population in 2000: 3,875
Houses and condos: 1,528 Renter-occupied apartments: 169
% of renters here:
12%
State:
46%
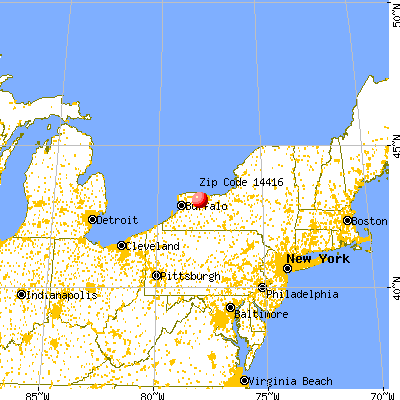
March 2022 cost of living index in zip code 14416: 93.5 (less than average, U.S. average is 100)
Land area: 37.2 sq. mi. Water area: 0.1 sq. mi.
Population density: 100 people per square mile
(very low).
OSM Map
General Map
Google Map
MSN Map
OSM Map
General Map
Google Map
MSN Map
OSM Map
General Map
Google Map
MSN Map
OSM Map
General Map
Google Map
MSN Map
Please wait while loading the map...
Real estate property taxes paid for housing units in 2022:
This zip code:
2.4% ($3,997)
New York:
1.5% ($6,180)
Median real estate property taxes paid for housing units with mortgages in 2022: $3,922 (2.3%) Median real estate property taxes paid for housing units with no mortgage in 2022: $4,253 (2.6%)
Estimated median house/condo value in 2022: $165,018
14416:
$165,018
New York:
$400,400
According to our research of New York and other state lists, there were 4 registered sex offenders living in 14416 zip code as of May 28, 2024. The ratio of all residents to sex offenders in zip code 14416 is 900 to 1. The ratio of registered sex offenders to all residents in this zip code is near the state average.
Median resident age:
This zip code:
43.6 years
New York median age:
40.0 years
Average household size:
This zip code:
2.6 people
New York:
2.5 people
Averages for the 2020 tax year for zip code 14416, filed in 2021:
Average Adjusted Gross Income (AGI) in 2020: $61,416 (Individual Income Tax Returns)
Here:
$61,416
State:
$90,930
Salary/wage: $53,723 (reported on 81.6% of returns)
Here:
$53,723
State:
$72,104
(% of AGI for various income ranges: 1061.9% for AGIs below $25k, 3306.1% for AGIs $25k-50k, 5857.7% for AGIs $50k-75k, 9834.0% for AGIs $75k-100k, 14740.0% for AGIs $100k-200k)
Taxable interest for individuals: $700 (reported on 46.8% of returns)
This zip code:
$700
New York:
$3,075
(% of AGI for various income ranges: 14.2% for AGIs below $25k, 29.8% for AGIs $25k-50k, 35.0% for AGIs $50k-75k, 61.3% for AGIs $75k-100k, 46.8% for AGIs $100k-200k)
Ordinary dividends: $3,432 (reported on 20.0% of returns)
Here:
$3,432
State:
$11,095
(% of AGI for various income ranges: 17.2% for AGIs below $25k, 31.2% for AGIs $25k-50k, 70.8% for AGIs $50k-75k, 73.3% for AGIs $75k-100k, 431.6% for AGIs $100k-200k)
Net capital gain/loss in AGI: +$4,427 (reported on 15.8% of returns)
Here:
+$4,427
State:
+$44,925
(% of AGI for various income ranges: 15.3% for AGIs below $25k, 54.6% for AGIs $25k-50k, 65.0% for AGIs $50k-75k, 112.0% for AGIs $75k-100k, 374.7% for AGIs $100k-200k)
Profit/loss from business: +$7,791 (reported on 11.6% of returns)
Here:
+$7,791
State:
+$14,940
(% of AGI for various income ranges: 74.2% for AGIs below $25k, 86.1% for AGIs $25k-50k, 88.8% for AGIs $50k-75k, 195.3% for AGIs $75k-100k, 300.0% for AGIs $100k-200k)
Taxable individual retirement arrangement distribution: $16,396 (reported on 14.7% of returns)
14416:
$16,396
New York:
$19,609
(% of AGI for various income ranges: 112.8% for AGIs below $25k, 181.0% for AGIs $25k-50k, 334.2% for AGIs $50k-75k, 616.7% for AGIs $75k-100k, 867.9% for AGIs $100k-200k)
Total itemized deductions: $25,540 (reported on 5.3% of returns)
Here:
$25,540
State:
$39,326
(% of AGI for various income ranges: 428.8% for AGIs $50k-75k, 302.7% for AGIs $75k-100k, 518.4% for AGIs $100k-200k)
Charity contributions: $8,300 (reported on 3.7% of returns)
Here:
$8,300
State:
$15,420
(% of AGI for various income ranges: 79.6% for AGIs $50k-75k, 196.8% for AGIs $100k-200k)
Taxes paid: $7,770 (reported on 5.3% of returns)
14416:
$7,770
State:
$9,183
(% of AGI for various income ranges: 116.5% for AGIs $50k-75k, 124.7% for AGIs $75k-100k, 151.1% for AGIs $100k-200k)
Earned income credit: $1,940 (reported on 10.5% of returns)
Here:
$1,940
State:
$2,138
(% of AGI for various income ranges: 56.9% for AGIs below $25k, 44.6% for AGIs $25k-50k)
Percentage of individuals using paid preparers for their 2020 taxes: 96.8%
Here:
97%
State:
95%
(% for various income ranges: 95.9% for AGIs below $25k, 98.0% for AGIs $25k-50k, 94.3% for AGIs $50k-75k, 95.7% for AGIs $75k-100k, 100.0% for AGIs $100k-200k, 100.0% for AGIs over 200k)
Averages for the 2012 tax year for zip code 14416, filed in 2013:
Average Adjusted Gross Income (AGI) in 2012: $48,513 (Individual Income Tax Returns)
Here:
$48,513
State:
$77,088
Salary/wage: $43,284 (reported on 84.2% of returns)
Here:
$43,284
State:
$60,593
(% of AGI for various income ranges: 71.5% for AGIs below $25k, 74.2% for AGIs $25k-50k, 78.0% for AGIs $50k-75k, 78.8% for AGIs $75k-100k, 72.6% for AGIs $100k-200k)
Taxable interest for individuals: $403 (reported on 49.5% of returns)
This zip code:
$403
New York:
$3,125
(% of AGI for various income ranges: 1.2% for AGIs below $25k, 0.6% for AGIs $25k-50k, 0.3% for AGIs $50k-75k, 0.3% for AGIs $75k-100k, 0.2% for AGIs $100k-200k)
Ordinary dividends: $1,728 (reported on 22.6% of returns)
Here:
$1,728
State:
$10,299
(% of AGI for various income ranges: 1.4% for AGIs below $25k, 0.6% for AGIs $25k-50k, 1.1% for AGIs $50k-75k, 0.7% for AGIs $75k-100k, 0.6% for AGIs $100k-200k)
Net capital gain/loss in AGI: +$1,757 (reported on 14.7% of returns)
Here:
+$1,757
State:
+$42,474
(% of AGI for various income ranges: 0.4% for AGIs $25k-50k, 0.6% for AGIs $75k-100k, 1.0% for AGIs $100k-200k)
Profit/loss from business: +$8,142 (reported on 12.6% of returns)
Here:
+$8,142
State:
+$16,168
(% of AGI for various income ranges: 4.5% for AGIs below $25k, 2.9% for AGIs $25k-50k, 1.4% for AGIs $50k-75k, 2.2% for AGIs $75k-100k, 1.3% for AGIs $100k-200k)
Taxable individual retirement arrangement distribution: $11,865 (reported on 13.7% of returns)
14416:
$11,865
New York:
$17,621
(% of AGI for various income ranges: 4.3% for AGIs below $25k, 4.9% for AGIs $25k-50k, 2.9% for AGIs $50k-75k, 3.5% for AGIs $75k-100k, 2.3% for AGIs $100k-200k)
Total itemized deductions: $17,846 (21% of AGI, reported on 31.1% of returns)
Here:
$17,846
State:
$34,985
Here:
20.7% of AGI
State:
21.3% of AGI
(% of AGI for various income ranges: 6.2% for AGIs below $25k, 9.0% for AGIs $25k-50k, 12.3% for AGIs $50k-75k, 12.0% for AGIs $75k-100k, 13.5% for AGIs $100k-200k)
Charity contributions: $2,573 (reported on 25.8% of returns)
Here:
$2,573
State:
$5,572
(% of AGI for various income ranges: 0.3% for AGIs below $25k, 0.9% for AGIs $25k-50k, 1.6% for AGIs $50k-75k, 1.7% for AGIs $75k-100k, 1.7% for AGIs $100k-200k)
Taxes paid: $8,853 (reported on 31.1% of returns)
14416:
$8,853
State:
$18,656
(% of AGI for various income ranges: 2.3% for AGIs below $25k, 3.4% for AGIs $25k-50k, 5.2% for AGIs $50k-75k, 6.2% for AGIs $75k-100k, 8.0% for AGIs $100k-200k)
Earned income credit: $2,043 (reported on 12.1% of returns)
Here:
$2,043
State:
$2,230
(% of AGI for various income ranges: 3.7% for AGIs below $25k, 0.9% for AGIs $25k-50k)
Percentage of individuals using paid preparers for their 2012 taxes: 58.9%
Here:
59%
State:
66%
(% for various income ranges: 52.1% for AGIs below $25k, 59.6% for AGIs $25k-50k, 60.7% for AGIs $50k-75k, 65.2% for AGIs $75k-100k, 71.4% for AGIs $100k-200k)
Averages for the 2004 tax year for zip code 14416, filed in 2005:
Average Adjusted Gross Income (AGI) in 2004: $41,572 (Individual Income Tax Returns)
Here:
$41,572
State:
$59,519
Salary/wage: $38,752 (reported on 86.4% of returns)
Here:
$38,752
State:
$50,673
(% of AGI for various income ranges: 88.7% for AGIs below $10k, 70.8% for AGIs $10k-25k, 80.2% for AGIs $25k-50k, 83.5% for AGIs $50k-75k, 88.6% for AGIs $75k-100k, 71.2% for AGIs over 100k)
Taxable interest for individuals: $532 (reported on 60.4% of returns)
This zip code:
$532
New York:
$2,377
(% of AGI for various income ranges: 4.2% for AGIs below $10k, 1.5% for AGIs $10k-25k, 1.0% for AGIs $25k-50k, 0.5% for AGIs $50k-75k, 0.3% for AGIs $75k-100k, 0.9% for AGIs over 100k)
Taxable dividends: $1,191 (reported on 29.5% of returns)
Here:
$1,191
State:
$5,394
(% of AGI for various income ranges: 4.2% for AGIs below $10k, 1.6% for AGIs $10k-25k, 0.9% for AGIs $25k-50k, 0.6% for AGIs $50k-75k, 0.7% for AGIs $75k-100k, 0.5% for AGIs over 100k)
Net capital gain/loss: +$1,691 (reported on 18.5% of returns)
Here:
+$1,691
State:
+$23,581
(% of AGI for various income ranges: -2.1% for AGIs below $10k, 0.3% for AGIs $10k-25k, 0.4% for AGIs $25k-50k, 0.2% for AGIs $50k-75k, 0.5% for AGIs $75k-100k, 2.8% for AGIs over 100k)
Profit/loss from business: +$4,237 (reported on 13.9% of returns)
Here:
+$4,237
State:
+$13,809
(% of AGI for various income ranges: 2.5% for AGIs below $10k, 2.1% for AGIs $10k-25k, 2.4% for AGIs $25k-50k, 2.0% for AGIs $50k-75k, 0.9% for AGIs $75k-100k, -0.5% for AGIs over 100k)
Profit/loss from farming: +$3,794 (reported on 1.8% of returns)
Here:
+$3,794
State:
-$2,666
IRA payment deduction: $2,687 (reported on 3.6% of returns)
14416:
$2,687
New York:
$3,115
(% of AGI for various income ranges: 0.3% for AGIs $10k-25k, 0.3% for AGIs $25k-50k, 0.2% for AGIs $50k-75k, 0.4% for AGIs $75k-100k)
Total itemized deductions: $14,412 (21% of AGI, reported on 36.9% of returns)
Here:
$14,412
State:
$25,864
Here:
20.6% of AGI
State:
21.9% of AGI
(% of AGI for various income ranges: 7.1% for AGIs $10k-25k, 10.7% for AGIs $25k-50k, 14.6% for AGIs $50k-75k, 15.1% for AGIs $75k-100k, 13.9% for AGIs over 100k)
Charity contributions deductions: $2,127 (3% of AGI, reported on 33.9% of returns)
Here:
$2,127
State:
$4,439
Here:
3.0% of AGI
State:
3.6% of AGI
(% of AGI for various income ranges: 0.7% for AGIs $10k-25k, 1.0% for AGIs $25k-50k, 1.8% for AGIs $50k-75k, 2.2% for AGIs $75k-100k, 2.7% for AGIs over 100k)
Total tax: $4,657 (reported on 79.8% of returns)
14416:
$4,657
State:
$11,730
(% of AGI for various income ranges: 2.2% for AGIs below $10k, 4.4% for AGIs $10k-25k, 6.8% for AGIs $25k-50k, 8.2% for AGIs $50k-75k, 9.6% for AGIs $75k-100k, 14.9% for AGIs over 100k)
Earned income credit: $1,443 (reported on 9.3% of returns)
Here:
$1,443
State:
$1,757
Percentage of individuals using paid preparers for their 2004 taxes: 57.9%
Here:
58%
State:
67%
(% for various income ranges: 48.2% for AGIs below $10k, 52.5% for AGIs $10k-25k, 61.2% for AGIs $25k-50k, 66.0% for AGIs $50k-75k, 60.3% for AGIs $75k-100k, 66.0% for AGIs over 100k)
Household received Food Stamps/SNAP in the past 12 months: 36 Household did not receive Food Stamps/SNAP in the past 12 months: 1,368
Women who had a birth in the past 12 months: 152 (117 now married, 33 unmarried) Women who did not have a birth in the past 12 months: 749 (266 now married, 484 unmarried)
Housing units in zip code 14416 with a mortgage: 782 (124 second mortgage, 102 both second mortgage and home equity loan) Houses without a mortgage: 96
Median monthly owner costs for units with a mortgage: $1,427 Median monthly owner costs for units without a mortgage: $704
Residents with income below the poverty level in 2022:
This zip code:
6.9%
Whole state:
14.3%
Residents with income below 50% of the poverty level in 2022:
This zip code:
3.1%
Whole state:
6.8%
Median number of rooms in houses and condos:
Here:
6.8
State:
6.3
Median number of rooms in apartments:
Here:
4.4
State:
3.8
Notable locations in this zip code not listed on our city pages
Churches in zip code 14416 include: Bethel Baptist Church of Bergen (A), Calvary Chapel Agape (B), Stone Church Presbyterian Church (C), Saint Bridget's Church (D), First Presbyterian Church (E), Bergen United Methodist Church (F). Display/hide their locations on the map
Cemeteries: Stone Church Rural Cemetery (1), Saint Brigids Catholic Cemetery (2), Mount Rest Cemetery (3), East Bergen Cemetery (4), Creamery Road Cemetery (5). Display/hide their locations on the map
In group quarters: 75 (-1 institutionalized population)
Size of family households: 420 2-persons, 295 3-persons, 252 4-persons, 56 5-persons, 9 6-persons, 19 7-or-more-persons
Size of nonfamily households: 304 1-person, 51 2-persons, 4 3-persons
470 married couples with children.
203 single-parent households (149 men, 54 women).
96.4% of residents of 14416 zip code speak English at home.
2.0% of residents speak Spanish at home (93% very well, 6% well, 1% not at all).
0.8% of residents speak other Indo-European language at home (45% very well, 55% not well).
0.1% of residents speak Asian or Pacific Island language at home (100% well).
Foreign born population: 93 (2.5%) (66.1% of them are naturalized citizens)
This zip code:
2.5%
Whole state:
22.7%
23%Bhutan
20%Chile
11%Haiti
9%Poland
4%El Salvador
1%Honduras
26%Irish
14%German
9%English
8%Italian
8%American
6%Northern European
4%European
Year of entry for the foreign-born population
142010 or later
02000 to 2009
181990 to 1999
57Before 1990
Facilities with environmental interests located in this zip code:
GRASTORF COLLISION (8148 BUFFALO RD in BERGEN, NY)
STATE MASTER (New York facility tracking) - AIR PROGRAM, Conditionally Exempt Small Quantity Generators, less than 100 kg/month of hazardous waste (Resource Conservation and Recovery Act (tracking hazardous waste)) - notification Organizations: DI ASSOCIATES INC (CONTACT/OWNER)
Alternative names: GRASTORFS COLLISION, NU-LOOKS GRASTORF COLLISION
BERGEN (V) STP (16 NORTH LAKE STREET in BERGEN, NY)
COMPLIANCE ACTIVITY (Tracking inspections of insecticide, fungicide, and rodenticide, and toxic substances) National Pollutant Discharge Elimination System NON-MAJOR (Tracking pollutant discharge elimination systems) - permit Business SIC classification: SEWERAGE SYSTEMS Alternative names: BERGEN MUNICIPAL ELECTRIC DEPT, BERGEN MUNICIPAL LIGHTING BOARD
A R G TRUCKING CORP (8150 BUFFALO RD in BERGEN, NY)
(Resource Conservation and Recovery Act (tracking hazardous waste))
GRASTORFS COLLISION (119 BREW RD in BERGEN, NY)
(Resource Conservation and Recovery Act (tracking hazardous waste))
BERGEN VILLAGE OF (62 S LAKE AVE in BERGEN, NY)
(Resource Conservation and Recovery Act (tracking hazardous waste))
COMMUNITY DRY CLEANERS (26 N LAKE ST in BERGEN, NY)
(Resource Conservation and Recovery Act (tracking hazardous waste))
Housing units lacking complete plumbing facilities: 2.1% Housing units lacking complete kitchen facilities: 1.3%
28.3%Utility gas
24.0%Electricity
17.4%Fuel oil, kerosene, etc.
17.4%Bottled, tank, or LP gas
10.3%Wood
2.3%Other fuel
0.5%Coal or coke
Population in 1990: 3,092. Population change in the 1990s: +783 (+25.3%).
Place of birth for U.S.-born residents:
This state: 3,325
Northeast: 112
Midwest: 85
South: 44
West: 70
67% of the 14416 zip code residents lived in the same house 5 years ago. Out of people who lived in different houses, 49% lived in this county. Out of people who lived in different counties, 50% lived in New York.
96% of the 14416 zip code residents lived in the same house 1 year ago. Out of people who lived in different houses, 25% moved from this county. Out of people who lived in different houses, 65% moved from different county within same state. Out of people who lived in different houses, 3% moved from different state. Out of people who lived in different houses, 4% moved from abroad.
Private vs. public school enrollment:
Students in private schools in grades 1 to 8 (elementary and middle school):
Here:
0.0%
New York:
15.6%
Students in private schools in grades 9 to 12 (high school): 15
Here:
7.4%
New York:
15.0%
Students in private undergraduate colleges: 72
Here:
38.6%
New York:
39.2%
Occupation by median earnings in the past 12 months ($)
104,278Architecture and engineering occupations
81,859Computer and mathematical occupations
80,248Health diagnosing and treating practitioners and other technical occupations
77,897Management occupations
65,964Law enforcement workers including supervisors
64,370Arts, design, entertainment, sports, and media occupations
Companies with federal contracts located in this zip code:
LYNX MACHINE TOOL CORP (26 NORTH LAKE STREET in BERGEN, NY; small business) : $740,047 in 36 contractsfrom 2002 to 2006
Contracts for Guns, through 30 mm, Nails, Machine Keys, and Pins, Guns, over 150 mm through 200 mm, Hardware, Commercial, and moreby Army, Defense Logistics Agency Signed by year:2000: $0; 2001: $0; 2002: $41,250; 2003: $86,241; 2004: $323,057; 2005: $245,077; 2006: $44,422.
Biggest contracts:
$180,000 with Army for Guns, through 30 mm. Signed on 2004-12-22. Completion date: 2005-12-01.
$126,000, same as above.Signed on 2004-04-20. Completion date: 2004-01-16.
$58,130, same as above.Signed on 2005-03-16. Completion date: 2010-12-31.
$45,259 with Army for Nails, Machine Keys, and Pins. Signed on 2005-02-09. Completion date: 2005-07-30.
Top industries in this zip code by the number of employees in 2005:
Construction: Oil and Gas Pipeline and Related Structures Construction (50-99 employees: 1 establishment)
Wholesale Trade: Other Miscellaneous Nondurable Goods Merchant Wholesalers (20-49: 1)
Arts, Entertainment, and Recreation: Bowling Centers (20-49: 1)
Other Services (except Public Administration): Religious Organizations (10-19: 1, 5-9: 1, 1-4: 1)
Administrative and Support and Waste Management and Remediation Services: Landscaping Services (10-19: 1, 1-4: 1)
Fatal accident statistics in 2014:
Fatal accident count: 1
Vehicles involved in fatal accidents: 2
Fatal accidents caused by drunken drivers: 0
Fatalities: 1
Persons involved in fatal accidents: 2
Pedestrians involved in fatal accidents: 0
Fatal accident statistics in 2012:
Fatal accident count: 1
Vehicles involved in fatal accidents: 2
Fatal accidents caused by drunken drivers: 0
Fatalities: 1
Persons involved in fatal accidents: 2
Pedestrians involved in fatal accidents: 0
Home Mortgage Disclosure Act Aggregated Statistics For Year 2003 (Based on 2 partial tracts)
A) FHA, FSA/RHS & VA Home Purchase Loans
B) Conventional Home Purchase Loans
C) Refinancings
D) Home Improvement Loans
F) Non-occupant Loans on < 5 Family Dwellings (A B C & D)
Number
Average Value
Number
Average Value
Number
Average Value
Number
Average Value
Number
Average Value
LOANS ORIGINATED
9
$96,783
38
$77,440
159
$80,753
14
$13,804
4
$49,015
APPLICATIONS APPROVED, NOT ACCEPTED
4
$61,618
3
$70,953
21
$76,866
2
$37,345
0
$0
APPLICATIONS DENIED
2
$90,090
13
$48,762
66
$83,048
8
$11,904
1
$42,010
APPLICATIONS WITHDRAWN
0
$0
1
$107,360
47
$91,433
3
$41,390
0
$0
FILES CLOSED FOR INCOMPLETENESS
0
$0
1
$69,090
7
$72,687
1
$14,000
1
$47,610
Aggregated Statistics For Year 2002 (Based on 2 partial tracts)
A) FHA, FSA/RHS & VA Home Purchase Loans
B) Conventional Home Purchase Loans
C) Refinancings
D) Home Improvement Loans
F) Non-occupant Loans on < 5 Family Dwellings (A B C & D)
Number
Average Value
Number
Average Value
Number
Average Value
Number
Average Value
Number
Average Value
LOANS ORIGINATED
10
$89,626
39
$75,095
113
$70,276
18
$14,627
5
$59,004
APPLICATIONS APPROVED, NOT ACCEPTED
1
$78,420
1
$98,030
21
$76,822
3
$13,693
1
$81,220
APPLICATIONS DENIED
1
$55,080
9
$52,386
61
$78,407
21
$12,848
1
$140,040
APPLICATIONS WITHDRAWN
2
$99,430
4
$68,152
35
$74,128
4
$16,805
1
$63,480
FILES CLOSED FOR INCOMPLETENESS
1
$103,630
2
$28,010
5
$66,472
1
$18,670
0
$0
Aggregated Statistics For Year 2001 (Based on 2 partial tracts)
A) FHA, FSA/RHS & VA Home Purchase Loans
B) Conventional Home Purchase Loans
C) Refinancings
D) Home Improvement Loans
F) Non-occupant Loans on < 5 Family Dwellings (A B C & D)
Number
Average Value
Number
Average Value
Number
Average Value
Number
Average Value
Number
Average Value
LOANS ORIGINATED
20
$91,633
25
$82,008
100
$73,372
16
$16,980
2
$55,550
APPLICATIONS APPROVED, NOT ACCEPTED
0
$0
4
$67,685
9
$61,410
3
$13,070
0
$0
APPLICATIONS DENIED
0
$0
6
$53,682
63
$61,158
12
$14,782
0
$0
APPLICATIONS WITHDRAWN
3
$75,310
4
$86,125
35
$75,995
5
$10,270
0
$0
FILES CLOSED FOR INCOMPLETENESS
0
$0
0
$0
6
$53,527
1
$93,360
0
$0
Aggregated Statistics For Year 2000 (Based on 2 partial tracts)
A) FHA, FSA/RHS & VA Home Purchase Loans
B) Conventional Home Purchase Loans
C) Refinancings
D) Home Improvement Loans
F) Non-occupant Loans on < 5 Family Dwellings (A B C & D)
Number
Average Value
Number
Average Value
Number
Average Value
Number
Average Value
Number
Average Value
LOANS ORIGINATED
17
$79,960
47
$74,589
39
$52,306
35
$20,753
4
$49,015
APPLICATIONS APPROVED, NOT ACCEPTED
0
$0
5
$51,162
17
$60,409
7
$12,804
0
$0
APPLICATIONS DENIED
1
$61,620
13
$46,465
49
$50,452
17
$26,471
3
$13,693
APPLICATIONS WITHDRAWN
1
$73,750
4
$42,245
24
$41,156
3
$28,630
1
$27,070
FILES CLOSED FOR INCOMPLETENESS
0
$0
0
$0
4
$61,385
0
$0
0
$0
Aggregated Statistics For Year 1999 (Based on 1 partial tract)
A) FHA, FSA/RHS & VA Home Purchase Loans
B) Conventional Home Purchase Loans
C) Refinancings
D) Home Improvement Loans
E) Loans on Dwellings For 5+ Families
F) Non-occupant Loans on < 5 Family Dwellings (A B C & D)
Detailed PMIC statistics for the following Tracts:9501.00
2002 - 2018 National Fire Incident Reporting System (NFIRS) incidents
Based on the data from the years 2002 - 2018 the average number of fires per year is 13. The highest number of fires - 31 took place in 2018, and the least - 2 in 2008. The data has an increasing trend.
When looking into fire subcategories, the most incidents belonged to: Structure Fires (46.2%), and Outside Fires (26.9%).
Fire incident types reported to NFIRS in Zip Code 14416


+$3,794
-$2,666
 Nearest zip codes: 14422, 14482, 14511, 14428, 14420, 14143.


 Based on the data from the years 2002 - 2018 the average number of fires per year is 13. The highest number of fires - 31 took place in 2018, and the least - 2 in 2008. The data has an increasing trend.
 When looking into fire subcategories, the most incidents belonged to: Structure Fires (46.2%), and Outside Fires (26.9%).