Estimated zip code population in 2022: 1,746 Zip code population in 2010: 1,820 Zip code population in 2000: 3,676
Houses and condos: 796 Renter-occupied apartments: 107
% of renters here:
15%
State:
46%
March 2022 cost of living index in zip code 14481: 94.1 (less than average, U.S. average is 100)
Land area: 23.8 sq. mi. Water area: 0.0 sq. mi.
Population density: 73 people per square mile
(very low).
OSM Map
General Map
Google Map
MSN Map
OSM Map
General Map
Google Map
MSN Map
OSM Map
General Map
Google Map
MSN Map
OSM Map
General Map
Google Map
MSN Map
Please wait while loading the map...
Real estate property taxes paid for housing units in 2022:
This zip code:
2.4% ($3,917)
New York:
1.5% ($6,180)
Median real estate property taxes paid for housing units with mortgages in 2022: $4,268 (2.5%) Median real estate property taxes paid for housing units with no mortgage in 2022: $3,570 (2.4%)
Business Search- 14 Million verified businesses
Males: 876
(50.2%)
Females: 870
(49.8%)
For population 25 years and over in 14481:
High school or higher: 90.1%
Bachelor's degree or higher: 27.2%
Graduate or professional degree: 10.9%
Unemployed: 1.2%
Mean travel time to work (commute): 23.2 minutes
For population 15 years and over in 14481:
Never married: 25.9%
Now married: 54.5%
Separated: 2.8%
Widowed: 5.1%
Divorced: 11.8%
Zip code 14481 compared to state average:
Median house value significantly below state average.
Unemployed percentage significantly below state average.
Black race population percentage significantly below state average.
Hispanic race population percentage significantly below state average.
Median age above state average.
Foreign-born population percentage significantly below state average.
Renting percentage significantly below state average.
Length of stay since moving in significantly above state average.
Number of rooms per house above state average.
Number of college students significantly below state average.
Averages for the 2020 tax year for zip code 14481, filed in 2021:
Average Adjusted Gross Income (AGI) in 2020: $56,562 (Individual Income Tax Returns)
Here:
$56,562
State:
$90,930
Salary/wage: $46,372 (reported on 79.8% of returns)
Here:
$46,372
State:
$72,104
(% of AGI for various income ranges: 1097.1% for AGIs below $25k, 3071.6% for AGIs $25k-50k, 5621.7% for AGIs $50k-75k, 9057.5% for AGIs $75k-100k, 14038.7% for AGIs $100k-200k)
Taxable interest for individuals: $424 (reported on 41.6% of returns)
This zip code:
$424
New York:
$3,075
(% of AGI for various income ranges: 19.4% for AGIs below $25k, 13.7% for AGIs $25k-50k, 20.0% for AGIs $50k-75k, 41.2% for AGIs $75k-100k, 51.2% for AGIs $100k-200k)
Ordinary dividends: $2,119 (reported on 18.0% of returns)
Here:
$2,119
State:
$11,095
(% of AGI for various income ranges: 7.6% for AGIs below $25k, 25.3% for AGIs $25k-50k, 49.2% for AGIs $50k-75k, 86.2% for AGIs $75k-100k, 187.5% for AGIs $100k-200k)
Net capital gain/loss in AGI: +$8,200 (reported on 13.5% of returns)
Here:
+$8,200
State:
+$44,925
(% of AGI for various income ranges: 16.5% for AGIs below $25k, 36.7% for AGIs $50k-75k, 105.0% for AGIs $75k-100k, 1035.0% for AGIs $100k-200k)
Profit/loss from business: +$4,927 (reported on 12.4% of returns)
Here:
+$4,927
State:
+$14,940
(% of AGI for various income ranges: 67.6% for AGIs below $25k, 83.7% for AGIs $25k-50k, 180.0% for AGIs $50k-75k, 65.0% for AGIs $75k-100k)
Taxable individual retirement arrangement distribution: $14,233 (reported on 10.1% of returns)
14481:
$14,233
New York:
$19,609
(% of AGI for various income ranges: 69.4% for AGIs below $25k, 189.5% for AGIs $25k-50k, 1003.8% for AGIs $75k-100k)
Earned income credit: $2,191 (reported on 12.4% of returns)
Here:
$2,191
State:
$2,138
(% of AGI for various income ranges: 87.6% for AGIs below $25k, 48.4% for AGIs $25k-50k)
Percentage of individuals using paid preparers for their 2020 taxes: 98.9%
Here:
99%
State:
95%
(% for various income ranges: 95.8% for AGIs below $25k, 100.0% for AGIs $25k-50k, 100.0% for AGIs $50k-75k, 100.0% for AGIs $75k-100k, 100.0% for AGIs $100k-200k)
Averages for the 2012 tax year for zip code 14481, filed in 2013:
Average Adjusted Gross Income (AGI) in 2012: $45,762 (Individual Income Tax Returns)
Here:
$45,762
State:
$77,088
Salary/wage: $39,305 (reported on 83.7% of returns)
Here:
$39,305
State:
$60,593
(% of AGI for various income ranges: 68.9% for AGIs below $25k, 77.1% for AGIs $25k-50k, 76.0% for AGIs $50k-75k, 74.4% for AGIs $75k-100k, 62.0% for AGIs $100k-200k)
Taxable interest for individuals: $493 (reported on 44.6% of returns)
This zip code:
$493
New York:
$3,125
(% of AGI for various income ranges: 1.2% for AGIs below $25k, 0.5% for AGIs $25k-50k, 0.5% for AGIs $50k-75k, 0.3% for AGIs $75k-100k, 0.2% for AGIs $100k-200k)
Ordinary dividends: $1,100 (reported on 19.6% of returns)
Here:
$1,100
State:
$10,299
(% of AGI for various income ranges: 0.9% for AGIs below $25k, 0.5% for AGIs $25k-50k, 0.3% for AGIs $50k-75k, 0.4% for AGIs $75k-100k, 0.5% for AGIs $100k-200k)
Net capital gain/loss in AGI: +$2,410 (reported on 10.9% of returns)
Here:
+$2,410
State:
+$42,474
(% of AGI for various income ranges: 1.4% for AGIs $25k-50k, 0.3% for AGIs $50k-75k, 1.0% for AGIs $75k-100k)
Profit/loss from business: +$7,455 (reported on 12.0% of returns)
Here:
+$7,455
State:
+$16,168
(% of AGI for various income ranges: 4.6% for AGIs below $25k, 1.8% for AGIs $25k-50k, 4.1% for AGIs $50k-75k, 0.3% for AGIs $75k-100k)
Taxable individual retirement arrangement distribution: $7,444 (reported on 9.8% of returns)
14481:
$7,444
New York:
$17,621
(% of AGI for various income ranges: 2.9% for AGIs below $25k, 1.7% for AGIs $25k-50k, 3.7% for AGIs $50k-75k)
Total itemized deductions: $15,533 (20% of AGI, reported on 26.1% of returns)
Here:
$15,533
State:
$34,985
Here:
19.9% of AGI
State:
21.3% of AGI
(% of AGI for various income ranges: 9.7% for AGIs $25k-50k, 9.4% for AGIs $50k-75k, 9.2% for AGIs $75k-100k, 11.0% for AGIs $100k-200k)
Charity contributions: $1,944 (reported on 19.6% of returns)
Here:
$1,944
State:
$5,572
(% of AGI for various income ranges: 0.6% for AGIs $25k-50k, 0.8% for AGIs $50k-75k, 0.8% for AGIs $75k-100k, 1.5% for AGIs $100k-200k)
Taxes paid: $7,617 (reported on 26.1% of returns)
14481:
$7,617
State:
$18,656
(% of AGI for various income ranges: 4.0% for AGIs $25k-50k, 4.4% for AGIs $50k-75k, 4.3% for AGIs $75k-100k, 6.5% for AGIs $100k-200k)
Earned income credit: $1,850 (reported on 15.2% of returns)
Here:
$1,850
State:
$2,230
(% of AGI for various income ranges: 4.3% for AGIs below $25k, 0.8% for AGIs $25k-50k)
Percentage of individuals using paid preparers for their 2012 taxes: 64.1%
Here:
64%
State:
66%
(% for various income ranges: 58.8% for AGIs below $25k, 64.0% for AGIs $25k-50k, 64.7% for AGIs $50k-75k, 77.8% for AGIs $75k-100k, 71.4% for AGIs $100k-200k)
Averages for the 2004 tax year for zip code 14481, filed in 2005:
Average Adjusted Gross Income (AGI) in 2004: $36,502 (Individual Income Tax Returns)
Here:
$36,502
State:
$59,519
Salary/wage: $33,983 (reported on 86.2% of returns)
Here:
$33,983
State:
$50,673
(% of AGI for various income ranges: 99.7% for AGIs below $10k, 78.2% for AGIs $10k-25k, 76.7% for AGIs $25k-50k, 82.2% for AGIs $50k-75k, 86.3% for AGIs $75k-100k, 75.4% for AGIs over 100k)
Taxable interest for individuals: $645 (reported on 51.9% of returns)
This zip code:
$645
New York:
$2,377
(% of AGI for various income ranges: 5.0% for AGIs below $10k, 1.9% for AGIs $10k-25k, 0.9% for AGIs $25k-50k, 0.6% for AGIs $50k-75k, 0.4% for AGIs $75k-100k, 0.7% for AGIs over 100k)
Taxable dividends: $934 (reported on 23.3% of returns)
Here:
$934
State:
$5,394
(% of AGI for various income ranges: 4.0% for AGIs below $10k, 1.3% for AGIs $10k-25k, 0.4% for AGIs $25k-50k, 0.3% for AGIs $50k-75k, 0.4% for AGIs $75k-100k, 0.7% for AGIs over 100k)
Net capital gain/loss: +$1,000 (reported on 13.6% of returns)
Here:
+$1,000
State:
+$23,581
(% of AGI for various income ranges: 0.3% for AGIs below $10k, -0.2% for AGIs $10k-25k, 0.5% for AGIs $25k-50k, 0.1% for AGIs $50k-75k, 0.3% for AGIs $75k-100k, 1.2% for AGIs over 100k)
Profit/loss from business: +$4,758 (reported on 10.9% of returns)
Here:
+$4,758
State:
+$13,809
(% of AGI for various income ranges: 3.3% for AGIs $10k-25k, 2.0% for AGIs $25k-50k, 0.6% for AGIs $50k-75k, 2.2% for AGIs $75k-100k)
IRA payment deduction: $2,647 (reported on 1.9% of returns)
14481:
$2,647
New York:
$3,115
Total itemized deductions: $12,939 (20% of AGI, reported on 28.8% of returns)
Here:
$12,939
State:
$25,864
Here:
20.5% of AGI
State:
21.9% of AGI
(% of AGI for various income ranges: 7.4% for AGIs $10k-25k, 8.5% for AGIs $25k-50k, 11.7% for AGIs $50k-75k, 10.9% for AGIs $75k-100k, 13.0% for AGIs over 100k)
Charity contributions deductions: $1,795 (3% of AGI, reported on 25.3% of returns)
Here:
$1,795
State:
$4,439
Here:
2.7% of AGI
State:
3.6% of AGI
(% of AGI for various income ranges: 0.5% for AGIs $10k-25k, 0.8% for AGIs $25k-50k, 1.5% for AGIs $50k-75k, 1.4% for AGIs $75k-100k, 2.0% for AGIs over 100k)
Total tax: $4,188 (reported on 76.8% of returns)
14481:
$4,188
State:
$11,730
(% of AGI for various income ranges: 3.4% for AGIs below $10k, 4.2% for AGIs $10k-25k, 7.0% for AGIs $25k-50k, 8.5% for AGIs $50k-75k, 10.1% for AGIs $75k-100k, 14.7% for AGIs over 100k)
Earned income credit: $1,563 (reported on 14.9% of returns)
Here:
$1,563
State:
$1,757
Percentage of individuals using paid preparers for their 2004 taxes: 65.6%
Here:
66%
State:
67%
(% for various income ranges: 55.5% for AGIs below $10k, 61.3% for AGIs $10k-25k, 69.6% for AGIs $25k-50k, 70.9% for AGIs $50k-75k, 76.9% for AGIs $75k-100k, 75.0% for AGIs over 100k)
Household received Food Stamps/SNAP in the past 12 months: 73 Household did not receive Food Stamps/SNAP in the past 12 months: 663
Women who had a birth in the past 12 months: 15 (0 now married, 15 unmarried) Women who did not have a birth in the past 12 months: 317 (174 now married, 139 unmarried)
Housing units in zip code 14481 with a mortgage: 323 (34 second mortgage, 35 both second mortgage and home equity loan) Houses without a mortgage: 24
Median monthly owner costs for units with a mortgage: $1,455 Median monthly owner costs for units without a mortgage: $554
Residents with income below the poverty level in 2022:
This zip code:
9.3%
Whole state:
14.3%
Residents with income below 50% of the poverty level in 2022:
This zip code:
3.8%
Whole state:
6.8%
Median number of rooms in houses and condos:
Here:
6.3
State:
6.3
Median number of rooms in apartments:
Here:
5.2
State:
3.8
Notable locations in this zip code not listed on our city pages
Notable locations in zip code 14481: Highbanks Campgrounds (A), Park View Farms (B), Leicester Town Hall (C), Elijah House of Leicester Assisted Living Center (D), Cuylerville Volunteer Fire Department (E). Display/hide their locations on the map
Churches in zip code 14481 include: Kingdom Hall of Jehovahs Witnesses (A), Leicester Presbyterian Church (B), Saint Thomas Aquinas Church (C). Display/hide their locations on the map
Size of family households: 257 2-persons, 125 3-persons, 69 4-persons, 54 5-persons, 7 6-persons
Size of nonfamily households: 184 1-person, 39 2-persons, 2 4-persons
224 married couples with children.
126 single-parent households (18 men, 108 women).
98.2% of residents of 14481 zip code speak English at home.
0.8% of residents speak other Indo-European language at home (100% very well).
0.8% of residents speak Asian or Pacific Island language at home (57% very well, 43% not well).
Foreign born population: 37 (2.1%) (100.0% of them are naturalized citizens)
This zip code:
2.1%
Whole state:
22.7%
39%Japan
17%Sweden
14%France
21%Irish
19%German
18%Italian
11%American
11%English
4%Polish
3%French
Year of entry for the foreign-born population
02010 or later
02000 to 2009
01990 to 1999
35Before 1990
Facilities with environmental interests located in this zip code:
CPAC INC (2364 LEICESSTER ROAD in LEICESTER, NY)
FORMAL ENFORCEMENT ACTION (Integrated Compliance Information System) COMPLIANCE ACTIVITY (Tracking inspections of insecticide, fungicide, and rodenticide, and toxic substances) (Resource Conservation and Recovery Act (tracking hazardous waste)) Business SIC classification: PHOTOGRAPHIC EQUIPMENT AND SUPPLIES Alternative names: C P A C INC
CPAC INC (PO BOX 175 in LEICHESTER, NY)
COMPLIANCE ACTIVITY (Tracking inspections of insecticide, fungicide, and rodenticide, and toxic substances)
CPAC INC (P O BOX 175 in LEICESTER, NY)
COMPLIANCE ACTIVITY (Tracking inspections of insecticide, fungicide, and rodenticide, and toxic substances)
Housing units lacking complete plumbing facilities: 0.5% Housing units lacking complete kitchen facilities: 0.7%
46.7%Utility gas
16.2%Electricity
14.1%Fuel oil, kerosene, etc.
11.3%Bottled, tank, or LP gas
10.1%Wood
1.4%Other fuel
0.7%Coal or coke
Population in 1990: 1,881. Population change in the 1990s: +1,795 (+95.4%).
Place of birth for U.S.-born residents:
This state: 1,528
Northeast: 45
Midwest: 35
South: 36
West: 61
70% of the 14481 zip code residents lived in the same house 5 years ago. Out of people who lived in different houses, 44% lived in this county. Out of people who lived in different counties, 50% lived in New York.
97% of the 14481 zip code residents lived in the same house 1 year ago. Out of people who lived in different houses, 50% moved from this county. Out of people who lived in different houses, 39% moved from different county within same state. Out of people who lived in different houses, 5% moved from abroad.
Private vs. public school enrollment:
Students in private schools in grades 1 to 8 (elementary and middle school):
Here:
0.0%
New York:
15.6%
Students in private schools in grades 9 to 12 (high school):
Here:
0.0%
New York:
15.0%
Students in private undergraduate colleges: 6
Here:
29.6%
New York:
39.2%
Occupation by median earnings in the past 12 months ($)
104,767Fire fighting and prevention, and other protective service workers including supervisors
81,549Management occupations
78,473Health diagnosing and treating practitioners and other technical occupations
73,188Architecture and engineering occupations
70,367Business and financial operations occupations
68,842Law enforcement workers including supervisors
Companies with federal contracts located in this zip code:
CPAC INC (2364 LEICESTER RD in LEICESTER, NY)
$5,499 with Army for Photographic Sets, Kits, and Outfits. Signed on 2002-05-03. Completion date: 2002-04-30.
Top industries in this zip code by the number of employees in 2005:
Health Care and Social Assistance: Homes for the Elderly (20-49 employees: 1 establishment)
Management of Companies and Enterprises: Offices of Other Holding Companies (10-19: 1)
Administrative and Support and Waste Management and Remediation Services: All Other Miscellaneous Waste Management Services (10-19: 1)
Health Care and Social Assistance: Child Day Care Services (10-19: 1)
Accommodation and Food Services: Caterers (10-19: 1)
People in group quarters in 2000:
1,778 people in state prisons
27 people in other noninstitutional group quarters
Fatal accident statistics in 2010:
Fatal accident count: 3
Vehicles involved in fatal accidents: 4
Fatal accidents caused by drunken drivers: 2
Fatalities: 3
Persons involved in fatal accidents: 6
Pedestrians involved in fatal accidents: 0
Home Mortgage Disclosure Act Aggregated Statistics For Year 2009 (Based on 2 partial tracts)
A) FHA, FSA/RHS & VA Home Purchase Loans
B) Conventional Home Purchase Loans
C) Refinancings
D) Home Improvement Loans
F) Non-occupant Loans on < 5 Family Dwellings (A B C & D)
G) Loans On Manufactured Home Dwelling (A B C & D)
Number
Average Value
Number
Average Value
Number
Average Value
Number
Average Value
Number
Average Value
Number
Average Value
LOANS ORIGINATED
5
$101,128
7
$129,574
17
$121,374
4
$12,450
3
$171,110
2
$86,390
APPLICATIONS APPROVED, NOT ACCEPTED
0
$0
0
$0
1
$171,440
0
$0
0
$0
0
$0
APPLICATIONS DENIED
0
$0
1
$104,270
5
$101,128
2
$12,865
0
$0
1
$5,680
APPLICATIONS WITHDRAWN
1
$37,760
1
$96,920
5
$128,868
1
$11,030
0
$0
1
$37,760
FILES CLOSED FOR INCOMPLETENESS
0
$0
0
$0
2
$117,805
0
$0
0
$0
1
$39,770
Aggregated Statistics For Year 2008 (Based on 2 partial tracts)
A) FHA, FSA/RHS & VA Home Purchase Loans
B) Conventional Home Purchase Loans
C) Refinancings
D) Home Improvement Loans
F) Non-occupant Loans on < 5 Family Dwellings (A B C & D)
G) Loans On Manufactured Home Dwelling (A B C & D)
Number
Average Value
Number
Average Value
Number
Average Value
Number
Average Value
Number
Average Value
Number
Average Value
LOANS ORIGINATED
5
$99,258
8
$113,461
12
$106,052
7
$45,929
1
$167,430
3
$72,187
APPLICATIONS APPROVED, NOT ACCEPTED
0
$0
1
$110,290
2
$125,490
1
$33,090
0
$0
0
$0
APPLICATIONS DENIED
0
$0
1
$69,510
15
$114,185
7
$63,450
1
$251,320
2
$36,595
APPLICATIONS WITHDRAWN
0
$0
1
$69,510
8
$100,886
1
$44,110
0
$0
1
$47,460
FILES CLOSED FOR INCOMPLETENESS
0
$0
0
$0
1
$127,330
0
$0
0
$0
0
$0
Aggregated Statistics For Year 2007 (Based on 2 partial tracts)
A) FHA, FSA/RHS & VA Home Purchase Loans
B) Conventional Home Purchase Loans
C) Refinancings
D) Home Improvement Loans
F) Non-occupant Loans on < 5 Family Dwellings (A B C & D)
G) Loans On Manufactured Home Dwelling (A B C & D)
Number
Average Value
Number
Average Value
Number
Average Value
Number
Average Value
Number
Average Value
Number
Average Value
LOANS ORIGINATED
3
$84,330
17
$111,839
15
$80,809
9
$33,420
5
$155,738
3
$65,393
APPLICATIONS APPROVED, NOT ACCEPTED
0
$0
1
$129,000
3
$100,707
1
$121,650
0
$0
1
$66,510
APPLICATIONS DENIED
0
$0
4
$127,330
24
$95,191
11
$27,891
2
$102,430
5
$49,930
APPLICATIONS WITHDRAWN
0
$0
0
$0
13
$91,905
1
$48,790
0
$0
0
$0
FILES CLOSED FOR INCOMPLETENESS
0
$0
1
$19,720
2
$126,160
0
$0
1
$59,490
0
$0
Aggregated Statistics For Year 2006 (Based on 2 partial tracts)
A) FHA, FSA/RHS & VA Home Purchase Loans
B) Conventional Home Purchase Loans
C) Refinancings
D) Home Improvement Loans
F) Non-occupant Loans on < 5 Family Dwellings (A B C & D)
G) Loans On Manufactured Home Dwelling (A B C & D)
Number
Average Value
Number
Average Value
Number
Average Value
Number
Average Value
Number
Average Value
Number
Average Value
LOANS ORIGINATED
3
$122,763
13
$107,072
24
$84,706
12
$18,075
5
$121,314
5
$68,244
APPLICATIONS APPROVED, NOT ACCEPTED
0
$0
3
$53,360
5
$79,674
1
$38,430
0
$0
1
$93,910
APPLICATIONS DENIED
0
$0
5
$78,538
31
$78,257
13
$32,468
2
$86,560
7
$54,570
APPLICATIONS WITHDRAWN
0
$0
3
$115,633
11
$79,540
3
$43,780
1
$97,920
1
$37,430
FILES CLOSED FOR INCOMPLETENESS
0
$0
0
$0
5
$123,788
0
$0
0
$0
0
$0
Aggregated Statistics For Year 2005 (Based on 2 partial tracts)
A) FHA, FSA/RHS & VA Home Purchase Loans
B) Conventional Home Purchase Loans
C) Refinancings
D) Home Improvement Loans
F) Non-occupant Loans on < 5 Family Dwellings (A B C & D)
G) Loans On Manufactured Home Dwelling (A B C & D)
Number
Average Value
Number
Average Value
Number
Average Value
Number
Average Value
Number
Average Value
Number
Average Value
LOANS ORIGINATED
4
$79,958
17
$96,249
22
$86,391
15
$23,595
3
$129,223
2
$87,895
APPLICATIONS APPROVED, NOT ACCEPTED
0
$0
2
$64,165
5
$73,324
2
$19,550
1
$87,890
1
$54,470
APPLICATIONS DENIED
1
$43,450
3
$81,990
30
$81,222
10
$31,047
3
$63,833
3
$56,703
APPLICATIONS WITHDRAWN
1
$36,760
1
$176,790
15
$79,695
3
$53,250
0
$0
0
$0
FILES CLOSED FOR INCOMPLETENESS
0
$0
1
$70,180
4
$134,265
0
$0
0
$0
0
$0
Aggregated Statistics For Year 2004 (Based on 2 partial tracts)
A) FHA, FSA/RHS & VA Home Purchase Loans
B) Conventional Home Purchase Loans
C) Refinancings
D) Home Improvement Loans
F) Non-occupant Loans on < 5 Family Dwellings (A B C & D)
G) Loans On Manufactured Home Dwelling (A B C & D)
Number
Average Value
Number
Average Value
Number
Average Value
Number
Average Value
Number
Average Value
Number
Average Value
LOANS ORIGINATED
4
$93,575
15
$89,945
26
$91,198
13
$20,515
4
$119,310
3
$67,953
APPLICATIONS APPROVED, NOT ACCEPTED
0
$0
2
$93,745
4
$81,880
1
$4,680
0
$0
0
$0
APPLICATIONS DENIED
0
$0
3
$80,207
29
$71,530
7
$38,147
1
$82,880
5
$55,276
APPLICATIONS WITHDRAWN
0
$0
1
$85,560
13
$86,352
2
$27,740
0
$0
0
$0
FILES CLOSED FOR INCOMPLETENESS
0
$0
0
$0
3
$171,223
1
$56,480
0
$0
0
$0
Aggregated Statistics For Year 2003 (Based on 2 partial tracts)
A) FHA, FSA/RHS & VA Home Purchase Loans
B) Conventional Home Purchase Loans
C) Refinancings
D) Home Improvement Loans
F) Non-occupant Loans on < 5 Family Dwellings (A B C & D)
Number
Average Value
Number
Average Value
Number
Average Value
Number
Average Value
Number
Average Value
LOANS ORIGINATED
4
$74,442
18
$80,338
44
$145,119
12
$17,685
4
$90,235
APPLICATIONS APPROVED, NOT ACCEPTED
0
$0
1
$102,600
6
$81,712
1
$39,100
0
$0
APPLICATIONS DENIED
0
$0
3
$33,867
28
$101,680
8
$15,081
1
$50,130
APPLICATIONS WITHDRAWN
0
$0
1
$96,250
14
$71,351
2
$23,395
0
$0
FILES CLOSED FOR INCOMPLETENESS
0
$0
0
$0
4
$113,128
0
$0
0
$0
Aggregated Statistics For Year 2002 (Based on 2 partial tracts)
A) FHA, FSA/RHS & VA Home Purchase Loans
B) Conventional Home Purchase Loans
C) Refinancings
D) Home Improvement Loans
F) Non-occupant Loans on < 5 Family Dwellings (A B C & D)
Number
Average Value
Number
Average Value
Number
Average Value
Number
Average Value
Number
Average Value
LOANS ORIGINATED
7
$76,914
10
$79,172
24
$86,349
6
$16,320
2
$85,890
APPLICATIONS APPROVED, NOT ACCEPTED
1
$90,230
1
$105,610
6
$87,838
2
$6,515
0
$0
APPLICATIONS DENIED
0
$0
4
$37,765
21
$64,596
7
$7,591
0
$0
APPLICATIONS WITHDRAWN
0
$0
1
$148,380
12
$72,605
1
$6,020
0
$0
FILES CLOSED FOR INCOMPLETENESS
0
$0
0
$0
3
$84,663
0
$0
0
$0
Aggregated Statistics For Year 2001 (Based on 2 partial tracts)
A) FHA, FSA/RHS & VA Home Purchase Loans
B) Conventional Home Purchase Loans
C) Refinancings
D) Home Improvement Loans
F) Non-occupant Loans on < 5 Family Dwellings (A B C & D)
Number
Average Value
Number
Average Value
Number
Average Value
Number
Average Value
Number
Average Value
LOANS ORIGINATED
7
$71,996
14
$75,959
17
$74,605
13
$12,751
3
$52,917
APPLICATIONS APPROVED, NOT ACCEPTED
0
$0
4
$51,300
4
$68,092
2
$17,880
0
$0
APPLICATIONS DENIED
2
$61,825
14
$49,390
22
$64,607
8
$12,281
1
$19,380
APPLICATIONS WITHDRAWN
0
$0
2
$94,075
16
$70,704
3
$11,810
0
$0
FILES CLOSED FOR INCOMPLETENESS
0
$0
0
$0
2
$53,470
1
$25,400
0
$0
Aggregated Statistics For Year 2000 (Based on 2 partial tracts)
A) FHA, FSA/RHS & VA Home Purchase Loans
B) Conventional Home Purchase Loans
C) Refinancings
D) Home Improvement Loans
F) Non-occupant Loans on < 5 Family Dwellings (A B C & D)
Number
Average Value
Number
Average Value
Number
Average Value
Number
Average Value
Number
Average Value
LOANS ORIGINATED
4
$70,182
14
$72,736
10
$51,834
10
$17,746
1
$76,200
APPLICATIONS APPROVED, NOT ACCEPTED
0
$0
6
$57,650
4
$40,772
3
$38,767
0
$0
APPLICATIONS DENIED
0
$0
23
$40,162
14
$41,894
5
$23,328
0
$0
APPLICATIONS WITHDRAWN
0
$0
2
$94,245
5
$34,556
0
$0
0
$0
FILES CLOSED FOR INCOMPLETENESS
1
$50,130
0
$0
1
$50,460
0
$0
0
$0
Aggregated Statistics For Year 1999 (Based on 1 partial tract)
A) FHA, FSA/RHS & VA Home Purchase Loans
B) Conventional Home Purchase Loans
C) Refinancings
D) Home Improvement Loans
F) Non-occupant Loans on < 5 Family Dwellings (A B C & D)

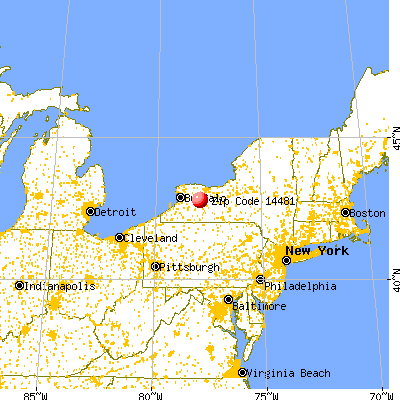


 Nearest zip codes: 14530, 14533, 14539, 14510, 14592, 14549.


