Estimated zip code population in 2022: 18,083
Zip code population in 2010: 18,057
Zip code population in 2000: 15,919
Houses and condos: 7,818
Renter-occupied apartments: 1,454
% of renters here:
19%State:
46%
March 2022 cost of living index in zip code 14559: 102.2
(near average, U.S. average is 100)
Land area: 42.5
sq. mi.
Water area: 0.3
sq. mi.
Population density: 425 people per square mile (low).
OSM Map
General Map
Google Map
MSN Map
OSM Map
General Map
Google Map
MSN Map
OSM Map
General Map
Google Map
MSN Map
OSM Map
General Map
Google Map
MSN Map
Please wait while loading the map...
Real estate property taxes paid for housing units in 2022:
This zip code:
3.1% ($6,400)New York:
1.5% ($6,180)
Median real estate property taxes paid for housing units with mortgages in 2022: $6,721 (3.0%)
Median real estate property taxes paid for housing units with no mortgage in 2022: $5,886 (3.0%)
Profiles of local businesses
Business Search - 14 Million verified businesses
Males: 9,232 Females: 8,850
For population 25 years and over in 14559:
High school or higher: 95.2%Bachelor's degree or higher: 38.7%Graduate or professional degree: 16.9%Unemployed: 4.0%Mean travel time to work (commute): 21.1 minutes
For population 15 years and over in 14559:
Never married: 26.7%Now married: 56.9%Separated: 1.0%Widowed: 5.4%Divorced: 10.1%
Zip code 14559 compared to state average:
Median house value below state average. Black race population percentage significantly below state average. Hispanic race population percentage significantly below state average. Median age above state average. Foreign-born population percentage significantly below state average. Renting percentage significantly below state average. Length of stay since moving in above state average. Number of rooms per house above state average. House age below state average. 16,903 93.5% White 453 2.5% Two or more races 335 1.9% Black 296 1.6% Hispanic or Latino 69 0.4% Asian 20 0.1% Some other race 3 0.02% American Indian
Data:
Median household income ($)
Median household income (% change since 2000)
Household income diversity
Ratio of average income to average house value (%)
Ratio of average income to average rent
Median household income ($) - White
Median household income ($) - Black or African American
Median household income ($) - Asian
Median household income ($) - Hispanic or Latino
Median household income ($) - American Indian and Alaska Native
Median household income ($) - Multirace
Median household income ($) - Other Race
Median household income for houses/condos with a mortgage ($)
Median household income for apartments without a mortgage ($)
Races - White alone (%)
Races - White alone (% change since 2000)
Races - Black alone (%)
Races - Black alone (% change since 2000)
Races - American Indian alone (%)
Races - American Indian alone (% change since 2000)
Races - Asian alone (%)
Races - Asian alone (% change since 2000)
Races - Hispanic (%)
Races - Hispanic (% change since 2000)
Races - Native Hawaiian and Other Pacific Islander alone (%)
Races - Native Hawaiian and Other Pacific Islander alone (% change since 2000)
Races - Two or more races (%)
Races - Two or more races (% change since 2000)
Races - Other race alone (%)
Races - Other race alone (% change since 2000)
Racial diversity
Unemployment (%)
Unemployment (% change since 2000)
Unemployment (%) - White
Unemployment (%) - Black or African American
Unemployment (%) - Asian
Unemployment (%) - Hispanic or Latino
Unemployment (%) - American Indian and Alaska Native
Unemployment (%) - Multirace
Unemployment (%) - Other Race
Population density (people per square mile)
Population - Males (%)
Population - Females (%)
Population - Males (%) - White
Population - Males (%) - Black or African American
Population - Males (%) - Asian
Population - Males (%) - Hispanic or Latino
Population - Males (%) - American Indian and Alaska Native
Population - Males (%) - Multirace
Population - Males (%) - Other Race
Population - Females (%) - White
Population - Females (%) - Black or African American
Population - Females (%) - Asian
Population - Females (%) - Hispanic or Latino
Population - Females (%) - American Indian and Alaska Native
Population - Females (%) - Multirace
Population - Females (%) - Other Race
Coronavirus confirmed cases (May 21, 2024)
Deaths caused by coronavirus (May 21, 2024)
Coronavirus confirmed cases (per 100k population) (May 21, 2024)
Deaths caused by coronavirus (per 100k population) (May 21, 2024)
Daily increase in number of cases (May 21, 2024)
Weekly increase in number of cases (May 21, 2024)
Cases doubled (in days) (May 21, 2024)
Hospitalized patients (Apr 18, 2022)
Negative test results (Apr 18, 2022)
Total test results (Apr 18, 2022)
COVID Vaccine doses distributed (per 100k population) (Sep 19, 2023)
COVID Vaccine doses administered (per 100k population) (Sep 19, 2023)
COVID Vaccine doses distributed (Sep 19, 2023)
COVID Vaccine doses administered (Sep 19, 2023)
Likely homosexual households (%)
Likely homosexual households (% change since 2000)
Likely homosexual households - Lesbian couples (%)
Likely homosexual households - Lesbian couples (% change since 2000)
Likely homosexual households - Gay men (%)
Likely homosexual households - Gay men (% change since 2000)
Cost of living index
Median gross rent ($)
Median contract rent ($)
Median monthly housing costs ($)
Median house or condo value ($)
Median house or condo value ($ change since 2000)
Mean house or condo value by units in structure - 1, detached ($)
Mean house or condo value by units in structure - 1, attached ($)
Mean house or condo value by units in structure - 2 ($)
Mean house or condo value by units in structure by units in structure - 3 or 4 ($)
Mean house or condo value by units in structure - 5 or more ($)
Mean house or condo value by units in structure - Boat, RV, van, etc. ($)
Mean house or condo value by units in structure - Mobile home ($)
Median house or condo value ($) - White
Median house or condo value ($) - Black or African American
Median house or condo value ($) - Asian
Median house or condo value ($) - Hispanic or Latino
Median house or condo value ($) - American Indian and Alaska Native
Median house or condo value ($) - Multirace
Median house or condo value ($) - Other Race
Median resident age
Resident age diversity
Median resident age - Males
Median resident age - Females
Median resident age - White
Median resident age - Black or African American
Median resident age - Asian
Median resident age - Hispanic or Latino
Median resident age - American Indian and Alaska Native
Median resident age - Multirace
Median resident age - Other Race
Median resident age - Males - White
Median resident age - Males - Black or African American
Median resident age - Males - Asian
Median resident age - Males - Hispanic or Latino
Median resident age - Males - American Indian and Alaska Native
Median resident age - Males - Multirace
Median resident age - Males - Other Race
Median resident age - Females - White
Median resident age - Females - Black or African American
Median resident age - Females - Asian
Median resident age - Females - Hispanic or Latino
Median resident age - Females - American Indian and Alaska Native
Median resident age - Females - Multirace
Median resident age - Females - Other Race
Commute - mean travel time to work (minutes)
Travel time to work - Less than 5 minutes (%)
Travel time to work - Less than 5 minutes (% change since 2000)
Travel time to work - 5 to 9 minutes (%)
Travel time to work - 5 to 9 minutes (% change since 2000)
Travel time to work - 10 to 19 minutes (%)
Travel time to work - 10 to 19 minutes (% change since 2000)
Travel time to work - 20 to 29 minutes (%)
Travel time to work - 20 to 29 minutes (% change since 2000)
Travel time to work - 30 to 39 minutes (%)
Travel time to work - 30 to 39 minutes (% change since 2000)
Travel time to work - 40 to 59 minutes (%)
Travel time to work - 40 to 59 minutes (% change since 2000)
Travel time to work - 60 to 89 minutes (%)
Travel time to work - 60 to 89 minutes (% change since 2000)
Travel time to work - 90 or more minutes (%)
Travel time to work - 90 or more minutes (% change since 2000)
Marital status - Never married (%)
Marital status - Now married (%)
Marital status - Separated (%)
Marital status - Widowed (%)
Marital status - Divorced (%)
Median family income ($)
Median family income (% change since 2000)
Median non-family income ($)
Median non-family income (% change since 2000)
Median per capita income ($)
Median per capita income (% change since 2000)
Median family income ($) - White
Median family income ($) - Black or African American
Median family income ($) - Asian
Median family income ($) - Hispanic or Latino
Median family income ($) - American Indian and Alaska Native
Median family income ($) - Multirace
Median family income ($) - Other Race
Median year house/condo built
Median year apartment built
Year house built - Built 2005 or later (%)
Year house built - Built 2000 to 2004 (%)
Year house built - Built 1990 to 1999 (%)
Year house built - Built 1980 to 1989 (%)
Year house built - Built 1970 to 1979 (%)
Year house built - Built 1960 to 1969 (%)
Year house built - Built 1950 to 1959 (%)
Year house built - Built 1940 to 1949 (%)
Year house built - Built 1939 or earlier (%)
Average household size
Household density (households per square mile)
Average household size - White
Average household size - Black or African American
Average household size - Asian
Average household size - Hispanic or Latino
Average household size - American Indian and Alaska Native
Average household size - Multirace
Average household size - Other Race
Occupied housing units (%)
Vacant housing units (%)
Owner occupied housing units (%)
Renter occupied housing units (%)
Vacancy status - For rent (%)
Vacancy status - For sale only (%)
Vacancy status - Rented or sold, not occupied (%)
Vacancy status - For seasonal, recreational, or occasional use (%)
Vacancy status - For migrant workers (%)
Vacancy status - Other vacant (%)
Residents with income below the poverty level (%)
Residents with income below 50% of the poverty level (%)
Children below poverty level (%)
Poor families by family type - Married-couple family (%)
Poor families by family type - Male, no wife present (%)
Poor families by family type - Female, no husband present (%)
Poverty status for native-born residents (%)
Poverty status for foreign-born residents (%)
Poverty among high school graduates not in families (%)
Poverty among people who did not graduate high school not in families (%)
Residents with income below the poverty level (%) - White
Residents with income below the poverty level (%) - Black or African American
Residents with income below the poverty level (%) - Asian
Residents with income below the poverty level (%) - Hispanic or Latino
Residents with income below the poverty level (%) - American Indian and Alaska Native
Residents with income below the poverty level (%) - Multirace
Residents with income below the poverty level (%) - Other Race
Air pollution - Air Quality Index (AQI)
Air pollution - CO
Air pollution - NO2
Air pollution - SO2
Air pollution - Ozone
Air pollution - PM10
Air pollution - PM25
Air pollution - Pb
Crime - Murders per 100,000 population
Crime - Rapes per 100,000 population
Crime - Robberies per 100,000 population
Crime - Assaults per 100,000 population
Crime - Burglaries per 100,000 population
Crime - Thefts per 100,000 population
Crime - Auto thefts per 100,000 population
Crime - Arson per 100,000 population
Crime - City-data.com crime index
Crime - Violent crime index
Crime - Property crime index
Crime - Murders per 100,000 population (5 year average)
Crime - Rapes per 100,000 population (5 year average)
Crime - Robberies per 100,000 population (5 year average)
Crime - Assaults per 100,000 population (5 year average)
Crime - Burglaries per 100,000 population (5 year average)
Crime - Thefts per 100,000 population (5 year average)
Crime - Auto thefts per 100,000 population (5 year average)
Crime - Arson per 100,000 population (5 year average)
Crime - City-data.com crime index (5 year average)
Crime - Violent crime index (5 year average)
Crime - Property crime index (5 year average)
1996 Presidential Elections Results (%) - Democratic Party (Clinton)
1996 Presidential Elections Results (%) - Republican Party (Dole)
1996 Presidential Elections Results (%) - Other
2000 Presidential Elections Results (%) - Democratic Party (Gore)
2000 Presidential Elections Results (%) - Republican Party (Bush)
2000 Presidential Elections Results (%) - Other
2004 Presidential Elections Results (%) - Democratic Party (Kerry)
2004 Presidential Elections Results (%) - Republican Party (Bush)
2004 Presidential Elections Results (%) - Other
2008 Presidential Elections Results (%) - Democratic Party (Obama)
2008 Presidential Elections Results (%) - Republican Party (McCain)
2008 Presidential Elections Results (%) - Other
2012 Presidential Elections Results (%) - Democratic Party (Obama)
2012 Presidential Elections Results (%) - Republican Party (Romney)
2012 Presidential Elections Results (%) - Other
2016 Presidential Elections Results (%) - Democratic Party (Clinton)
2016 Presidential Elections Results (%) - Republican Party (Trump)
2016 Presidential Elections Results (%) - Other
2020 Presidential Elections Results (%) - Democratic Party (Biden)
2020 Presidential Elections Results (%) - Republican Party (Trump)
2020 Presidential Elections Results (%) - Other
Ancestries Reported - Arab (%)
Ancestries Reported - Czech (%)
Ancestries Reported - Danish (%)
Ancestries Reported - Dutch (%)
Ancestries Reported - English (%)
Ancestries Reported - French (%)
Ancestries Reported - French Canadian (%)
Ancestries Reported - German (%)
Ancestries Reported - Greek (%)
Ancestries Reported - Hungarian (%)
Ancestries Reported - Irish (%)
Ancestries Reported - Italian (%)
Ancestries Reported - Lithuanian (%)
Ancestries Reported - Norwegian (%)
Ancestries Reported - Polish (%)
Ancestries Reported - Portuguese (%)
Ancestries Reported - Russian (%)
Ancestries Reported - Scotch-Irish (%)
Ancestries Reported - Scottish (%)
Ancestries Reported - Slovak (%)
Ancestries Reported - Subsaharan African (%)
Ancestries Reported - Swedish (%)
Ancestries Reported - Swiss (%)
Ancestries Reported - Ukrainian (%)
Ancestries Reported - United States (%)
Ancestries Reported - Welsh (%)
Ancestries Reported - West Indian (%)
Ancestries Reported - Other (%)
Educational Attainment - No schooling completed (%)
Educational Attainment - Less than high school (%)
Educational Attainment - High school or equivalent (%)
Educational Attainment - Less than 1 year of college (%)
Educational Attainment - 1 or more years of college (%)
Educational Attainment - Associate degree (%)
Educational Attainment - Bachelor's degree (%)
Educational Attainment - Master's degree (%)
Educational Attainment - Professional school degree (%)
Educational Attainment - Doctorate degree (%)
School Enrollment - Nursery, preschool (%)
School Enrollment - Kindergarten (%)
School Enrollment - Grade 1 to 4 (%)
School Enrollment - Grade 5 to 8 (%)
School Enrollment - Grade 9 to 12 (%)
School Enrollment - College undergrad (%)
School Enrollment - Graduate or professional (%)
School Enrollment - Not enrolled in school (%)
School enrollment - Public schools (%)
School enrollment - Private schools (%)
School enrollment - Not enrolled (%)
Median number of rooms in houses and condos
Median number of rooms in apartments
Housing units lacking complete plumbing facilities (%)
Housing units lacking complete kitchen facilities (%)
Density of houses
Urban houses (%)
Rural houses (%)
Households with people 60 years and over (%)
Households with people 65 years and over (%)
Households with people 75 years and over (%)
Households with one or more nonrelatives (%)
Households with no nonrelatives (%)
Population in households (%)
Family households (%)
Nonfamily households (%)
Population in families (%)
Family households with own children (%)
Median number of bedrooms in owner occupied houses
Mean number of bedrooms in owner occupied houses
Median number of bedrooms in renter occupied houses
Mean number of bedrooms in renter occupied houses
Median number of vehichles in owner occupied houses
Mean number of vehichles in owner occupied houses
Median number of vehichles in renter occupied houses
Mean number of vehichles in renter occupied houses
Mortgage status - with mortgage (%)
Mortgage status - with second mortgage (%)
Mortgage status - with home equity loan (%)
Mortgage status - with both second mortgage and home equity loan (%)
Mortgage status - without a mortgage (%)
Average family size
Average family size - White
Average family size - Black or African American
Average family size - Asian
Average family size - Hispanic or Latino
Average family size - American Indian and Alaska Native
Average family size - Multirace
Average family size - Other Race
Geographical mobility - Same house 1 year ago (%)
Geographical mobility - Moved within same county (%)
Geographical mobility - Moved from different county within same state (%)
Geographical mobility - Moved from different state (%)
Geographical mobility - Moved from abroad (%)
Place of birth - Born in state of residence (%)
Place of birth - Born in other state (%)
Place of birth - Native, outside of US (%)
Place of birth - Foreign born (%)
Housing units in structures - 1, detached (%)
Housing units in structures - 1, attached (%)
Housing units in structures - 2 (%)
Housing units in structures - 3 or 4 (%)
Housing units in structures - 5 to 9 (%)
Housing units in structures - 10 to 19 (%)
Housing units in structures - 20 to 49 (%)
Housing units in structures - 50 or more (%)
Housing units in structures - Mobile home (%)
Housing units in structures - Boat, RV, van, etc. (%)
House/condo owner moved in on average (years ago)
Renter moved in on average (years ago)
Year householder moved into unit - Moved in 1999 to March 2000 (%)
Year householder moved into unit - Moved in 1995 to 1998 (%)
Year householder moved into unit - Moved in 1990 to 1994 (%)
Year householder moved into unit - Moved in 1980 to 1989 (%)
Year householder moved into unit - Moved in 1970 to 1979 (%)
Year householder moved into unit - Moved in 1969 or earlier (%)
Means of transportation to work - Drove car alone (%)
Means of transportation to work - Carpooled (%)
Means of transportation to work - Public transportation (%)
Means of transportation to work - Bus or trolley bus (%)
Means of transportation to work - Streetcar or trolley car (%)
Means of transportation to work - Subway or elevated (%)
Means of transportation to work - Railroad (%)
Means of transportation to work - Ferryboat (%)
Means of transportation to work - Taxicab (%)
Means of transportation to work - Motorcycle (%)
Means of transportation to work - Bicycle (%)
Means of transportation to work - Walked (%)
Means of transportation to work - Other means (%)
Working at home (%)
Industry diversity
Most Common Industries - Agriculture, forestry, fishing and hunting, and mining (%)
Most Common Industries - Agriculture, forestry, fishing and hunting (%)
Most Common Industries - Mining, quarrying, and oil and gas extraction (%)
Most Common Industries - Construction (%)
Most Common Industries - Manufacturing (%)
Most Common Industries - Wholesale trade (%)
Most Common Industries - Retail trade (%)
Most Common Industries - Transportation and warehousing, and utilities (%)
Most Common Industries - Transportation and warehousing (%)
Most Common Industries - Utilities (%)
Most Common Industries - Information (%)
Most Common Industries - Finance and insurance, and real estate and rental and leasing (%)
Most Common Industries - Finance and insurance (%)
Most Common Industries - Real estate and rental and leasing (%)
Most Common Industries - Professional, scientific, and management, and administrative and waste management services (%)
Most Common Industries - Professional, scientific, and technical services (%)
Most Common Industries - Management of companies and enterprises (%)
Most Common Industries - Administrative and support and waste management services (%)
Most Common Industries - Educational services, and health care and social assistance (%)
Most Common Industries - Educational services (%)
Most Common Industries - Health care and social assistance (%)
Most Common Industries - Arts, entertainment, and recreation, and accommodation and food services (%)
Most Common Industries - Arts, entertainment, and recreation (%)
Most Common Industries - Accommodation and food services (%)
Most Common Industries - Other services, except public administration (%)
Most Common Industries - Public administration (%)
Occupation diversity
Most Common Occupations - Management, business, science, and arts occupations (%)
Most Common Occupations - Management, business, and financial occupations (%)
Most Common Occupations - Management occupations (%)
Most Common Occupations - Business and financial operations occupations (%)
Most Common Occupations - Computer, engineering, and science occupations (%)
Most Common Occupations - Computer and mathematical occupations (%)
Most Common Occupations - Architecture and engineering occupations (%)
Most Common Occupations - Life, physical, and social science occupations (%)
Most Common Occupations - Education, legal, community service, arts, and media occupations (%)
Most Common Occupations - Community and social service occupations (%)
Most Common Occupations - Legal occupations (%)
Most Common Occupations - Education, training, and library occupations (%)
Most Common Occupations - Arts, design, entertainment, sports, and media occupations (%)
Most Common Occupations - Healthcare practitioners and technical occupations (%)
Most Common Occupations - Health diagnosing and treating practitioners and other technical occupations (%)
Most Common Occupations - Health technologists and technicians (%)
Most Common Occupations - Service occupations (%)
Most Common Occupations - Healthcare support occupations (%)
Most Common Occupations - Protective service occupations (%)
Most Common Occupations - Fire fighting and prevention, and other protective service workers including supervisors (%)
Most Common Occupations - Law enforcement workers including supervisors (%)
Most Common Occupations - Food preparation and serving related occupations (%)
Most Common Occupations - Building and grounds cleaning and maintenance occupations (%)
Most Common Occupations - Personal care and service occupations (%)
Most Common Occupations - Sales and office occupations (%)
Most Common Occupations - Sales and related occupations (%)
Most Common Occupations - Office and administrative support occupations (%)
Most Common Occupations - Natural resources, construction, and maintenance occupations (%)
Most Common Occupations - Farming, fishing, and forestry occupations (%)
Most Common Occupations - Construction and extraction occupations (%)
Most Common Occupations - Installation, maintenance, and repair occupations (%)
Most Common Occupations - Production, transportation, and material moving occupations (%)
Most Common Occupations - Production occupations (%)
Most Common Occupations - Transportation occupations (%)
Most Common Occupations - Material moving occupations (%)
People in Group quarters - Institutionalized population (%)
People in Group quarters - Correctional institutions (%)
People in Group quarters - Federal prisons and detention centers (%)
People in Group quarters - Halfway houses (%)
People in Group quarters - Local jails and other confinement facilities (including police lockups) (%)
People in Group quarters - Military disciplinary barracks (%)
People in Group quarters - State prisons (%)
People in Group quarters - Other types of correctional institutions (%)
People in Group quarters - Nursing homes (%)
People in Group quarters - Hospitals/wards, hospices, and schools for the handicapped (%)
People in Group quarters - Hospitals/wards and hospices for chronically ill (%)
People in Group quarters - Hospices or homes for chronically ill (%)
People in Group quarters - Military hospitals or wards for chronically ill (%)
People in Group quarters - Other hospitals or wards for chronically ill (%)
People in Group quarters - Hospitals or wards for drug/alcohol abuse (%)
People in Group quarters - Mental (Psychiatric) hospitals or wards (%)
People in Group quarters - Schools, hospitals, or wards for the mentally retarded (%)
People in Group quarters - Schools, hospitals, or wards for the physically handicapped (%)
People in Group quarters - Institutions for the deaf (%)
People in Group quarters - Institutions for the blind (%)
People in Group quarters - Orthopedic wards and institutions for the physically handicapped (%)
People in Group quarters - Wards in general hospitals for patients who have no usual home elsewhere (%)
People in Group quarters - Wards in military hospitals for patients who have no usual home elsewhere (%)
People in Group quarters - Juvenile institutions (%)
People in Group quarters - Long-term care (%)
People in Group quarters - Homes for abused, dependent, and neglected children (%)
People in Group quarters - Residential treatment centers for emotionally disturbed children (%)
People in Group quarters - Training schools for juvenile delinquents (%)
People in Group quarters - Short-term care, detention or diagnostic centers for delinquent children (%)
People in Group quarters - Type of juvenile institution unknown (%)
People in Group quarters - Noninstitutionalized population (%)
People in Group quarters - College dormitories (includes college quarters off campus) (%)
People in Group quarters - Military quarters (%)
People in Group quarters - On base (%)
People in Group quarters - Barracks, unaccompanied personnel housing (UPH), (Enlisted/Officer), ;and similar group living quarters for military personnel (%)
People in Group quarters - Transient quarters for temporary residents (%)
People in Group quarters - Military ships (%)
People in Group quarters - Group homes (%)
People in Group quarters - Homes or halfway houses for drug/alcohol abuse (%)
People in Group quarters - Homes for the mentally ill (%)
People in Group quarters - Homes for the mentally retarded (%)
People in Group quarters - Homes for the physically handicapped (%)
People in Group quarters - Other group homes (%)
People in Group quarters - Religious group quarters (%)
People in Group quarters - Dormitories (%)
People in Group quarters - Agriculture workers' dormitories on farms (%)
People in Group quarters - Job Corps and vocational training facilities (%)
People in Group quarters - Other workers' dormitories (%)
People in Group quarters - Crews of maritime vessels (%)
People in Group quarters - Other nonhousehold living situations (%)
People in Group quarters - Other noninstitutional group quarters (%)
Residents speaking English at home (%)
Residents speaking English at home - Born in the United States (%)
Residents speaking English at home - Native, born elsewhere (%)
Residents speaking English at home - Foreign born (%)
Residents speaking Spanish at home (%)
Residents speaking Spanish at home - Born in the United States (%)
Residents speaking Spanish at home - Native, born elsewhere (%)
Residents speaking Spanish at home - Foreign born (%)
Residents speaking other language at home (%)
Residents speaking other language at home - Born in the United States (%)
Residents speaking other language at home - Native, born elsewhere (%)
Residents speaking other language at home - Foreign born (%)
Class of Workers - Employee of private company (%)
Class of Workers - Self-employed in own incorporated business (%)
Class of Workers - Private not-for-profit wage and salary workers (%)
Class of Workers - Local government workers (%)
Class of Workers - State government workers (%)
Class of Workers - Federal government workers (%)
Class of Workers - Self-employed workers in own not incorporated business and Unpaid family workers (%)
House heating fuel used in houses and condos - Utility gas (%)
House heating fuel used in houses and condos - Bottled, tank, or LP gas (%)
House heating fuel used in houses and condos - Electricity (%)
House heating fuel used in houses and condos - Fuel oil, kerosene, etc. (%)
House heating fuel used in houses and condos - Coal or coke (%)
House heating fuel used in houses and condos - Wood (%)
House heating fuel used in houses and condos - Solar energy (%)
House heating fuel used in houses and condos - Other fuel (%)
House heating fuel used in houses and condos - No fuel used (%)
House heating fuel used in apartments - Utility gas (%)
House heating fuel used in apartments - Bottled, tank, or LP gas (%)
House heating fuel used in apartments - Electricity (%)
House heating fuel used in apartments - Fuel oil, kerosene, etc. (%)
House heating fuel used in apartments - Coal or coke (%)
House heating fuel used in apartments - Wood (%)
House heating fuel used in apartments - Solar energy (%)
House heating fuel used in apartments - Other fuel (%)
House heating fuel used in apartments - No fuel used (%)
Armed forces status - In Armed Forces (%)
Armed forces status - Civilian (%)
Armed forces status - Civilian - Veteran (%)
Armed forces status - Civilian - Nonveteran (%)
Fatal accidents locations in years 2005-2021
Fatal accidents locations in 2005
Fatal accidents locations in 2006
Fatal accidents locations in 2007
Fatal accidents locations in 2008
Fatal accidents locations in 2009
Fatal accidents locations in 2010
Fatal accidents locations in 2011
Fatal accidents locations in 2012
Fatal accidents locations in 2013
Fatal accidents locations in 2014
Fatal accidents locations in 2015
Fatal accidents locations in 2016
Fatal accidents locations in 2017
Fatal accidents locations in 2018
Fatal accidents locations in 2019
Fatal accidents locations in 2020
Fatal accidents locations in 2021
Alcohol use - People drinking some alcohol every month (%)
Alcohol use - People not drinking at all (%)
Alcohol use - Average days/month drinking alcohol
Alcohol use - Average drinks/week
Alcohol use - Average days/year people drink much
Audiometry - Average condition of hearing (%)
Audiometry - People that can hear a whisper from across a quiet room (%)
Audiometry - People that can hear normal voice from across a quiet room (%)
Audiometry - Ears ringing, roaring, buzzing (%)
Audiometry - Had a job exposure to loud noise (%)
Audiometry - Had off-work exposure to loud noise (%)
Blood Pressure & Cholesterol - Has high blood pressure (%)
Blood Pressure & Cholesterol - Checking blood pressure at home (%)
Blood Pressure & Cholesterol - Frequently checking blood cholesterol (%)
Blood Pressure & Cholesterol - Has high cholesterol level (%)
Consumer Behavior - Money monthly spent on food at supermarket/grocery store
Consumer Behavior - Money monthly spent on food at other stores
Consumer Behavior - Money monthly spent on eating out
Consumer Behavior - Money monthly spent on carryout/delivered foods
Consumer Behavior - Income spent on food at supermarket/grocery store (%)
Consumer Behavior - Income spent on food at other stores (%)
Consumer Behavior - Income spent on eating out (%)
Consumer Behavior - Income spent on carryout/delivered foods (%)
Current Health Status - General health condition (%)
Current Health Status - Blood donors (%)
Current Health Status - Has blood ever tested for HIV virus (%)
Current Health Status - Left-handed people (%)
Dermatology - People using sunscreen (%)
Diabetes - Diabetics (%)
Diabetes - Had a blood test for high blood sugar (%)
Diabetes - People taking insulin (%)
Diet Behavior & Nutrition - Diet health (%)
Diet Behavior & Nutrition - Milk product consumption (# of products/month)
Diet Behavior & Nutrition - Meals not home prepared (#/week)
Diet Behavior & Nutrition - Meals from fast food or pizza place (#/week)
Diet Behavior & Nutrition - Ready-to-eat foods (#/month)
Diet Behavior & Nutrition - Frozen meals/pizza (#/month)
Drug Use - People that ever used marijuana or hashish (%)
Drug Use - Ever used hard drugs (%)
Drug Use - Ever used any form of cocaine (%)
Drug Use - Ever used heroin (%)
Drug Use - Ever used methamphetamine (%)
Health Insurance - People covered by health insurance (%)
Kidney Conditions-Urology - Avg. # of times urinating at night
Medical Conditions - People with asthma (%)
Medical Conditions - People with anemia (%)
Medical Conditions - People with psoriasis (%)
Medical Conditions - People with overweight (%)
Medical Conditions - Elderly people having difficulties in thinking or remembering (%)
Medical Conditions - People who ever received blood transfusion (%)
Medical Conditions - People having trouble seeing even with glass/contacts (%)
Medical Conditions - People with arthritis (%)
Medical Conditions - People with gout (%)
Medical Conditions - People with congestive heart failure (%)
Medical Conditions - People with coronary heart disease (%)
Medical Conditions - People with angina pectoris (%)
Medical Conditions - People who ever had heart attack (%)
Medical Conditions - People who ever had stroke (%)
Medical Conditions - People with emphysema (%)
Medical Conditions - People with thyroid problem (%)
Medical Conditions - People with chronic bronchitis (%)
Medical Conditions - People with any liver condition (%)
Medical Conditions - People who ever had cancer or malignancy (%)
Mental Health - People who have little interest in doing things (%)
Mental Health - People feeling down, depressed, or hopeless (%)
Mental Health - People who have trouble sleeping or sleeping too much (%)
Mental Health - People feeling tired or having little energy (%)
Mental Health - People with poor appetite or overeating (%)
Mental Health - People feeling bad about themself (%)
Mental Health - People who have trouble concentrating on things (%)
Mental Health - People moving or speaking slowly or too fast (%)
Mental Health - People having thoughts they would be better off dead (%)
Oral Health - Average years since last visit a dentist
Oral Health - People embarrassed because of mouth (%)
Oral Health - People with gum disease (%)
Oral Health - General health of teeth and gums (%)
Oral Health - Average days a week using dental floss/device
Oral Health - Average days a week using mouthwash for dental problem
Oral Health - Average number of teeth
Pesticide Use - Households using pesticides to control insects (%)
Pesticide Use - Households using pesticides to kill weeds (%)
Physical Activity - People doing vigorous-intensity work activities (%)
Physical Activity - People doing moderate-intensity work activities (%)
Physical Activity - People walking or bicycling (%)
Physical Activity - People doing vigorous-intensity recreational activities (%)
Physical Activity - People doing moderate-intensity recreational activities (%)
Physical Activity - Average hours a day doing sedentary activities
Physical Activity - Average hours a day watching TV or videos
Physical Activity - Average hours a day using computer
Physical Functioning - People having limitations keeping them from working (%)
Physical Functioning - People limited in amount of work they can do (%)
Physical Functioning - People that need special equipment to walk (%)
Physical Functioning - People experiencing confusion/memory problems (%)
Physical Functioning - People requiring special healthcare equipment (%)
Prescription Medications - Average number of prescription medicines taking
Preventive Aspirin Use - Adults 40+ taking low-dose aspirin (%)
Reproductive Health - Vaginal deliveries (%)
Reproductive Health - Cesarean deliveries (%)
Reproductive Health - Deliveries resulted in a live birth (%)
Reproductive Health - Pregnancies resulted in a delivery (%)
Reproductive Health - Women breastfeeding newborns (%)
Reproductive Health - Women that had a hysterectomy (%)
Reproductive Health - Women that had both ovaries removed (%)
Reproductive Health - Women that have ever taken birth control pills (%)
Reproductive Health - Women taking birth control pills (%)
Reproductive Health - Women that have ever used Depo-Provera or injectables (%)
Reproductive Health - Women that have ever used female hormones (%)
Sexual Behavior - People 18+ that ever had sex (vaginal, anal, or oral) (%)
Sexual Behavior - Males 18+ that ever had vaginal sex with a woman (%)
Sexual Behavior - Males 18+ that ever performed oral sex on a woman (%)
Sexual Behavior - Males 18+ that ever had anal sex with a woman (%)
Sexual Behavior - Males 18+ that ever had any sex with a man (%)
Sexual Behavior - Females 18+ that ever had vaginal sex with a man (%)
Sexual Behavior - Females 18+ that ever performed oral sex on a man (%)
Sexual Behavior - Females 18+ that ever had anal sex with a man (%)
Sexual Behavior - Females 18+ that ever had any kind of sex with a woman (%)
Sexual Behavior - Average age people first had sex
Sexual Behavior - Average number of female sex partners in lifetime (males 18+)
Sexual Behavior - Average number of female vaginal sex partners in lifetime (males 18+)
Sexual Behavior - Average age people first performed oral sex on a woman (18+)
Sexual Behavior - Average number of woman performed oral sex on in lifetime (18+)
Sexual Behavior - Average number of male sex partners in lifetime (males 18+)
Sexual Behavior - Average number of male anal sex partners in lifetime (males 18+)
Sexual Behavior - Average age people first performed oral sex on a man (18+)
Sexual Behavior - Average number of male oral sex partners in lifetime (18+)
Sexual Behavior - People using protection when performing oral sex (%)
Sexual Behavior - Average number of times people have vaginal or anal sex a year
Sexual Behavior - People having sex without condom (%)
Sexual Behavior - Average number of male sex partners in lifetime (females 18+)
Sexual Behavior - Average number of male vaginal sex partners in lifetime (females 18+)
Sexual Behavior - Average number of female sex partners in lifetime (females 18+)
Sexual Behavior - Circumcised males 18+ (%)
Sleep Disorders - Average hours sleeping at night
Sleep Disorders - People that has trouble sleeping (%)
Smoking-Cigarette Use - People smoking cigarettes (%)
Taste & Smell - People 40+ having problems with smell (%)
Taste & Smell - People 40+ having problems with taste (%)
Taste & Smell - People 40+ that ever had wisdom teeth removed (%)
Taste & Smell - People 40+ that ever had tonsils teeth removed (%)
Taste & Smell - People 40+ that ever had a loss of consciousness because of a head injury (%)
Taste & Smell - People 40+ that ever had a broken nose or other serious injury to face or skull (%)
Taste & Smell - People 40+ that ever had two or more sinus infections (%)
Weight - Average height (inches)
Weight - Average weight (pounds)
Weight - Average BMI
Weight - People that are obese (%)
Weight - People that ever were obese (%)
Weight - People trying to lose weight (%)
Urban population: 11,658
Rural population: 6,424
Estimated median house/condo value in 2022: $209,530
14559:
$209,530New York:
$400,400
According to our research of New York and other state lists, there were 11 registered sex offenders living in 14559 zip code as of May 21, 2024 . The ratio of all residents to sex offenders in zip code 14559 is 1,699 to 1.The ratio of registered sex offenders to all residents in this zip code is lower than the state average.
Median resident age: This zip code:
45.1 yearsNew York median age:
40.0 years
Average household size: This zip code:
2.4 peopleNew York:
2.5 people
Averages for the 2020 tax year for zip code 14559, filed in 2021:
Average Adjusted Gross Income (AGI) in 2020: $74,216 (Individual Income Tax Returns) Here:
$74,216State:
$90,930
Salary/wage: $62,879 (reported on 80.1% of returns )Here:
$62,879State:
$72,104
(% of AGI for various income ranges: 1032.2% for AGIs below $25k , 3392.2% for AGIs $25k-50k , 5919.2% for AGIs $50k-75k , 8652.3% for AGIs $75k-100k , 17119.7% for AGIs $100k-200k , 65204.3% for AGIs over 200k ) Taxable interest for individuals: $1,086 (reported on 53.4% of returns )This zip code:
$1,086New York:
$3,075
(% of AGI for various income ranges: 22.8% for AGIs below $25k , 25.2% for AGIs $25k-50k , 54.0% for AGIs $50k-75k , 57.9% for AGIs $75k-100k , 136.5% for AGIs $100k-200k , 1561.4% for AGIs over 200k ) Ordinary dividends: $4,437 (reported on 27.2% of returns )(% of AGI for various income ranges: 35.6% for AGIs below $25k , 57.9% for AGIs $25k-50k , 96.9% for AGIs $50k-75k , 121.2% for AGIs $75k-100k , 280.3% for AGIs $100k-200k , 3467.9% for AGIs over 200k ) Net capital gain/loss in AGI: +$13,386 (reported on 22.8% of returns )Here:
+$13,386State:
+$44,925
(% of AGI for various income ranges: 14.7% for AGIs below $25k , 37.0% for AGIs $25k-50k , 91.5% for AGIs $50k-75k , 205.6% for AGIs $75k-100k , 519.3% for AGIs $100k-200k , 14093.6% for AGIs over 200k ) Profit/loss from business: +$12,560 (reported on 13.2% of returns )Here:
+$12,560State:
+$14,940
(% of AGI for various income ranges: 83.5% for AGIs below $25k , 108.6% for AGIs $25k-50k , 140.6% for AGIs $50k-75k , 235.2% for AGIs $75k-100k , 449.6% for AGIs $100k-200k , 3074.3% for AGIs over 200k ) Taxable individual retirement arrangement distribution: $19,204 (reported on 14.9% of returns )14559:
$19,204New York:
$19,609
(% of AGI for various income ranges: 107.8% for AGIs below $25k , 171.8% for AGIs $25k-50k , 398.5% for AGIs $50k-75k , 547.3% for AGIs $75k-100k , 963.6% for AGIs $100k-200k , 2630.7% for AGIs over 200k ) Self-employed (Keogh) retirement plans: $20,800 (reported on 0.6% of returns )14559:
$20,800New York:
$32,497
(% of AGI for various income ranges: 39.1% for AGIs $100k-200k , 597.9% for AGIs over 200k ) Total itemized deductions: $28,421 (reported on 6.6% of returns )Here:
$28,421State:
$39,326
(% of AGI for various income ranges: 51.4% for AGIs below $25k , 100.4% for AGIs $25k-50k , 228.2% for AGIs $50k-75k , 407.1% for AGIs $75k-100k , 489.5% for AGIs $100k-200k , 3257.1% for AGIs over 200k ) Charity contributions: $8,709 (reported on 5.0% of returns )(% of AGI for various income ranges: 2.8% for AGIs below $25k , 6.4% for AGIs $25k-50k , 25.9% for AGIs $50k-75k , 73.2% for AGIs $75k-100k , 156.4% for AGIs $100k-200k , 1062.9% for AGIs over 200k ) Taxes paid: $8,616 (reported on 6.6% of returns )(% of AGI for various income ranges: 12.0% for AGIs below $25k , 25.5% for AGIs $25k-50k , 90.0% for AGIs $50k-75k , 161.8% for AGIs $75k-100k , 163.0% for AGIs $100k-200k , 622.1% for AGIs over 200k ) Earned income credit: $1,858 (reported on 8.2% of returns )(% of AGI for various income ranges: 43.8% for AGIs below $25k , 41.3% for AGIs $25k-50k ) Percentage of individuals using paid preparers for their 2020 taxes: 95.5%(% for various income ranges: 94.4% for AGIs below $25k , 95.2% for AGIs $25k-50k , 95.9% for AGIs $50k-75k , 95.3% for AGIs $75k-100k , 96.7% for AGIs $100k-200k , 97.7% for AGIs over 200k )
Averages for the 2012 tax year for zip code 14559, filed in 2013:
Average Adjusted Gross Income (AGI) in 2012: $61,945 (Individual Income Tax Returns) Here:
$61,945State:
$77,088
Salary/wage: $52,035 (reported on 83.4% of returns )Here:
$52,035State:
$60,593
(% of AGI for various income ranges: 69.4% for AGIs below $25k , 73.8% for AGIs $25k-50k , 73.7% for AGIs $50k-75k , 75.2% for AGIs $75k-100k , 77.0% for AGIs $100k-200k , 48.7% for AGIs over 200k ) Taxable interest for individuals: $723 (reported on 55.4% of returns )This zip code:
$723New York:
$3,125
(% of AGI for various income ranges: 1.1% for AGIs below $25k , 0.6% for AGIs $25k-50k , 0.7% for AGIs $50k-75k , 0.5% for AGIs $75k-100k , 0.5% for AGIs $100k-200k , 0.8% for AGIs over 200k ) Ordinary dividends: $3,186 (reported on 28.0% of returns )(% of AGI for various income ranges: 1.9% for AGIs below $25k , 1.2% for AGIs $25k-50k , 1.1% for AGIs $50k-75k , 1.0% for AGIs $75k-100k , 0.9% for AGIs $100k-200k , 3.0% for AGIs over 200k ) Net capital gain/loss in AGI: +$13,390 (reported on 19.6% of returns )Here:
+$13,390State:
+$42,474
(% of AGI for various income ranges: 0.3% for AGIs $25k-50k , 0.4% for AGIs $50k-75k , 0.6% for AGIs $75k-100k , 1.0% for AGIs $100k-200k , 19.9% for AGIs over 200k ) Profit/loss from business: +$12,919 (reported on 12.9% of returns )Here:
+$12,919State:
+$16,168
(% of AGI for various income ranges: 4.5% for AGIs below $25k , 2.9% for AGIs $25k-50k , 1.8% for AGIs $50k-75k , 2.2% for AGIs $75k-100k , 2.0% for AGIs $100k-200k , 4.1% for AGIs over 200k ) Taxable individual retirement arrangement distribution: $14,518 (reported on 15.2% of returns )14559:
$14,518New York:
$17,621
(% of AGI for various income ranges: 5.2% for AGIs below $25k , 4.8% for AGIs $25k-50k , 3.8% for AGIs $50k-75k , 3.7% for AGIs $75k-100k , 3.5% for AGIs $100k-200k , 2.0% for AGIs over 200k ) Self-employment retirement plans: $16,533 (reported on 0.7% of returns )14559:
$16,533New York:
$27,330
Total itemized deductions: $20,940 (20% of AGI, reported on 41.8% of returns )Here:
$20,940State:
$34,985
Here:
19.6% of AGIState:
21.3% of AGI
(% of AGI for various income ranges: 10.5% for AGIs below $25k , 11.3% for AGIs $25k-50k , 14.5% for AGIs $50k-75k , 15.2% for AGIs $75k-100k , 16.5% for AGIs $100k-200k , 12.2% for AGIs over 200k ) Charity contributions: $2,818 (reported on 36.9% of returns )(% of AGI for various income ranges: 0.8% for AGIs below $25k , 1.3% for AGIs $25k-50k , 1.6% for AGIs $50k-75k , 1.8% for AGIs $75k-100k , 2.0% for AGIs $100k-200k , 1.6% for AGIs over 200k ) Taxes paid: $11,620 (reported on 41.8% of returns )14559:
$11,620State:
$18,656
(% of AGI for various income ranges: 3.8% for AGIs below $25k , 5.2% for AGIs $25k-50k , 7.1% for AGIs $50k-75k , 8.2% for AGIs $75k-100k , 9.8% for AGIs $100k-200k , 8.1% for AGIs over 200k ) Earned income credit: $1,874 (reported on 9.7% of returns )(% of AGI for various income ranges: 3.2% for AGIs below $25k , 0.7% for AGIs $25k-50k ) Percentage of individuals using paid preparers for their 2012 taxes: 54.7%(% for various income ranges: 46.2% for AGIs below $25k , 53.1% for AGIs $25k-50k , 61.9% for AGIs $50k-75k , 60.0% for AGIs $75k-100k , 60.6% for AGIs $100k-200k , 80.0% for AGIs over 200k )
Averages for the 2004 tax year for zip code 14559, filed in 2005:
Average Adjusted Gross Income (AGI) in 2004: $49,402 (Individual Income Tax Returns) Here:
$49,402State:
$59,519
Salary/wage: $44,591 (reported on 85.8% of returns )Here:
$44,591State:
$50,673
(% of AGI for various income ranges: 100.0% for AGIs below $10k , 68.0% for AGIs $10k-25k , 75.3% for AGIs $25k-50k , 79.9% for AGIs $50k-75k , 81.6% for AGIs $75k-100k , 75.6% for AGIs over 100k ) Taxable interest for individuals: $907 (reported on 67.9% of returns )This zip code:
$907New York:
$2,377
(% of AGI for various income ranges: 5.4% for AGIs below $10k , 2.2% for AGIs $10k-25k , 1.3% for AGIs $25k-50k , 0.9% for AGIs $50k-75k , 0.7% for AGIs $75k-100k , 1.4% for AGIs over 100k ) Taxable dividends: $1,572 (reported on 36.5% of returns )(% of AGI for various income ranges: 4.5% for AGIs below $10k , 1.8% for AGIs $10k-25k , 1.1% for AGIs $25k-50k , 0.9% for AGIs $50k-75k , 0.7% for AGIs $75k-100k , 1.3% for AGIs over 100k ) Net capital gain/loss: +$3,264 (reported on 25.8% of returns )Here:
+$3,264State:
+$23,581
(% of AGI for various income ranges: -2.7% for AGIs below $10k , 0.4% for AGIs $10k-25k , 0.5% for AGIs $25k-50k , 0.7% for AGIs $50k-75k , 0.7% for AGIs $75k-100k , 3.9% for AGIs over 100k ) Profit/loss from business: +$11,390 (reported on 13.5% of returns )Here:
+$11,390State:
+$13,809
(% of AGI for various income ranges: 3.0% for AGIs below $10k , 4.2% for AGIs $10k-25k , 2.4% for AGIs $25k-50k , 1.8% for AGIs $50k-75k , 2.2% for AGIs $75k-100k , 4.5% for AGIs over 100k ) Profit/loss from farming: +$3,294 (reported on 0.2% of returns )
Here : State :
IRA payment deduction: $3,112 (reported on 2.6% of returns )14559:
$3,112New York:
$3,115
(% of AGI for various income ranges: 0.3% for AGIs $10k-25k , 0.3% for AGIs $25k-50k , 0.2% for AGIs $50k-75k , 0.1% for AGIs $75k-100k , 0.1% for AGIs over 100k ) Self-employed pension: $13,419 (reported on 1.0% of returns )Here:
$13,419New York:
$19,016
(% of AGI for various income ranges: 0.2% for AGIs $25k-50k , 0.1% for AGIs $50k-75k , 0.2% for AGIs $75k-100k , 0.6% for AGIs over 100k ) Total itemized deductions: $17,556 (22% of AGI, reported on 45.4% of returns )Here:
$17,556State:
$25,864
Here:
21.8% of AGIState:
21.9% of AGI
(% of AGI for various income ranges: 13.0% for AGIs below $10k , 10.8% for AGIs $10k-25k , 14.6% for AGIs $25k-50k , 17.2% for AGIs $50k-75k , 17.5% for AGIs $75k-100k , 16.6% for AGIs over 100k ) Charity contributions deductions: $2,488 (3% of AGI, reported on 43.1% of returns )Here:
3.0% of AGIState:
3.6% of AGI
(% of AGI for various income ranges: 0.9% for AGIs below $10k , 1.2% for AGIs $10k-25k , 1.9% for AGIs $25k-50k , 2.2% for AGIs $50k-75k , 2.4% for AGIs $75k-100k , 2.4% for AGIs over 100k ) Total tax: $6,528 (reported on 79.8% of returns )14559:
$6,528State:
$11,730
(% of AGI for various income ranges: 2.6% for AGIs below $10k , 4.3% for AGIs $10k-25k , 7.0% for AGIs $25k-50k , 8.2% for AGIs $50k-75k , 9.6% for AGIs $75k-100k , 15.7% for AGIs over 100k ) Earned income credit: $1,486 (reported on 8.3% of returns )Percentage of individuals using paid preparers for their 2004 taxes: 59.2%(% for various income ranges: 48.8% for AGIs below $10k , 57.8% for AGIs $10k-25k , 61.4% for AGIs $25k-50k , 64.9% for AGIs $50k-75k , 61.8% for AGIs $75k-100k , 63.6% for AGIs over 100k )
Estimated median household income in 2022: This zip code:
$87,918New York:
$79,557
Nearest zip codes: 14514 ,
14468 ,
14624 ,
14626 ,
14428 ,
14420 .
Percentage of family households: This zip code:
48.0%New York:
41.3%
Percentage of households with unmarried partners: This zip code:
7.4%New York:
42.3%
Likely homosexual households (counted as self-reported same-sex unmarried-partner households)
Lesbian couples: 0.0% of all households Gay men: 0.1% of all households
Household received Food Stamps/SNAP in the past 12 months: 506Household did not receive Food Stamps/SNAP in the past 12 months: 6,895
Women who had a birth in the past 12 months: 90 (53 now married , 38 unmarried) Women who did not have a birth in the past 12 months: 3,320 (1,376 now married , 1,936 unmarried)
Housing units in zip code 14559 with a mortgage: 3,898 (570
second mortgage , 8
home equity loan , 550
both second mortgage and home equity loan )
Houses without a mortgage: 185
Median monthly owner costs for units with a mortgage: $1,628
Median monthly owner costs for units without a mortgage: $715
Residents with income below the poverty level in 2022:
This zip code:
4.9%Whole state:
14.3%
Residents with income below 50% of the poverty level in 2022:
This zip code:
3.0%Whole state:
6.8%
Median number of rooms in houses and condos: Median number of rooms in apartments: Notable locations in this zip code not listed on our city pages
Click to draw/clear zip code borders Notable locations in zip code 14559: (A) , Salmon Creek Country Club (B) , Pinewood Country Club (C) , Cardinal Creek Country Club (D) , Buttonwood Golf Course (E) , Spencerport Waterworks (F) , Bridle Wreath Farm (G) , Cobble Creek Farm (H) , Deconinck Farms (I) , Mariah Meadows Farm (J) , Springdale Farm (K) , Sweeney Farms (L) , Colby Homestead Farms (M) , Leibeck Farm (N) , Whittier Fruit Farm (O) , Robbs Farm (P) , Westover Center (Q) , Twin Hills Golf Course (R) , Ogden Industrial Isle (S) , Spencerport Wastewater Treatment Plant (T) . Display/hide their locations on the map
Shopping Center: (1) . Display/hide its location on the map
Church in zip code 14559: (A) . Display/hide its location on the map
Cemeteries: (1) , Fairfield Cemetery (2) , Castle Family Pioneer Cemetery (3) , Colby Street Cemetery (4) , Hoosic Hill Pioneer Cemetery (5) , Locust Grove Cemetery (6) , Parma Corners Cemetery (7) . Display/hide their locations on the map
Creek: (A) . Display/hide its location on the map
Park in zip code 14559: (1) . Display/hide its location on the map
Year house built (houses)
0 2020 or later588 2010 to 2019889 2000 to 20091,100 1990 to 1999980 1980 to 19891,032 1970 to 19791,056 1960 to 19691,256 1950 to 1959144 1940 to 1949782 1939 or earlier
Zip code 14559 household income distribution in 2022 178 Less than $10,00085 $10,000 to $14,999102 $15,000 to $19,999325 $20,000 to $24,999350 $25,000 to $29,99977 $30,000 to $34,999189 $35,000 to $39,999296 $40,000 to $44,999304 $45,000 to $49,999509 $50,000 to $59,999633 $60,000 to $74,999891 $75,000 to $99,9991,170 $100,000 to $124,999676 $125,000 to $149,999825 $150,000 to $199,999785 $200,000 or moreEstimate of home value of owner-occupied houses/condos in 2022 in zip code 14559 76 Less than $10,0009 $10,000 to $14,99919 $15,000 to $19,9997 $20,000 to $24,99920 $30,000 to $34,9999 $50,000 to $59,9997 $60,000 to $69,99924 $70,000 to $79,99944 $80,000 to $89,99932 $90,000 to $99,999334 $100,000 to $124,999627 $125,000 to $149,9991,000 $150,000 to $174,999492 $175,000 to $199,999929 $200,000 to $249,999671 $250,000 to $299,999834 $300,000 to $399,999437 $400,000 to $499,999130 $500,000 to $749,9997 $750,000 to $999,9996 $1,000,000 to $1,499,99921 $2,000,000 or moreRent paid by renters in 2022 in zip code 14559 6 $250 to $29911 $300 to $3498 $400 to $44913 $450 to $49951 $500 to $54923 $600 to $64972 $650 to $69935 $700 to $74978 $750 to $799180 $800 to $899228 $900 to $999385 $1,000 to $1,249167 $1,250 to $1,499114 $1,500 to $1,99986 No cash rent
Median gross rent in 2022: $1,098.
Estimated median house (or condo) value in 2022 for: White Non-Hispanic householders: $206,958Black or African American householders: $249,562Two or more races householders: $265,539Hispanic or Latino householders: $327,057Estimated median house or condo value in 2022: $209,530
14559:
$209,530New York:
$400,400
Lower value quartile - upper value quartile: $161,812 - $298,012
Mean price in 2022: Detached houses: $194,414Here:
$194,414State:
$476,719
Townhouses or other attached units: $156,013Here:
$156,013State:
$699,270
Housing units in structures:
One, detached: 6,073One, attached: 376Two: 2103 or 4: 3245 to 9: 31610 to 19: 11620 to 49: 11750 or more: 63Mobile homes: 173Unemployment : 4.0%
Means of transportation to work in zip code 14559 80.7% 7,467 Drove a car alone4.2% 388 Carpooled0.1% 11 Bus or trolley bus0.5% 42 Walked0.5% 45 Other means14.8% 1,366 Worked at homeTravel time to work (commute) in zip code 14559 151 Less than 5 minutes711 5 to 9 minutes893 10 to 14 minutes1,894 15 to 19 minutes1,808 20 to 24 minutes874 25 to 29 minutes931 30 to 34 minutes192 35 to 39 minutes107 40 to 44 minutes89 45 to 59 minutes153 60 to 89 minutes89 90 or more minutes
Percentage of zip code residents living and working in this county: 97.0%
Household type by relationship:
Households: 18,083
Male householders: 3,856 (749 living alone ), Female householders: 3,622 (1,086 living alone )4,166 spouses (4,084 opposite-sex spouses ), 674 unmarried partners , (666 opposite-sex unmarried partners ), 4,981 children (4,693 natural , 86 adopted , 196 stepchildren ), 327 grandchildren , 40 brothers or sisters , 89 parents , 0 foster children , 154 other relatives , 211 non-relatives In group quarters: 83 (-1 institutionalized population )
Size of family households: 2,490 2-persons , 1,140 3-persons , 1,085 4-persons , 397 5-persons , 42 6-persons , 50 7-or-more-persons
Size of nonfamily households: 1,834 1-person , 354 2-persons , 35 3-persons , 31 4-persons
2,427 married couples with children. single-parent households (388 men , 633 women ).
96.6% of residents of 14559 zip code speak English at home. of residents speak Spanish at home (56% very well, 38% well, 6% not well ).of residents speak other Indo-European language at home (74% very well, 17% well, 9% not well ).of residents speak Asian or Pacific Island language at home (100% very well ).of residents speak other language at home (100% very well ).
Foreign born population: 555 (3.1%)
(82.0%
of them are naturalized citizens )
This zip code:
3.1%Whole state:
22.7%
12% France 11% Greece 10% Sweden 9% Belarus 5% Austria 5% Romania 5% England 30% Italian 20% German 10% Irish 10% English 10% American 3% Polish 2% French
Year of entry for the foreign-born population
260 2010 or later 64 2000 to 2009 202 1990 to 1999 275 Before 1990
Facilities with environmental interests located in this zip code:
COLBY HOMESTEAD FARMS (263 COLBY STREET in SPENCERPORT, NY)
STATE MASTER (New York facility tracking) - National Pollutant Discharge Elimination System Permit National Pollutant Discharge Elimination System NON-MAJOR (Tracking pollutant discharge elimination systems) - permit Business SIC classification: GENERAL FARMS, PRIMARILY LIVESTOCK AND ANIMAL SPECIALTIESOrganizations: ROBERT COLBY (CONTACT/OWNER)
Alternative names: ROBERT COLBY
A.M. COSGROVE MS (2749 SPENCERPORT RD in SPENCERPORT, NY)
(National Center for Education Statistics) - STATE ID-261001060005 Organizations: SPENCERPORT CSD (SCHOOL DISTRICT)
CRANE-HOGAN STRUCTURAL SYSTEMS INC (1600 WESTSIDE DR in SPENCERPORT, NY)
(Resource Conservation and Recovery Act (tracking hazardous waste)) Organizations: DANIEL C HOGAN JAMES R CRANE (CONTACT/OPERATOR)
HUFF LANDFILL (4108 CANAL RD in SPENCERPORT, NY)
CRITERIA AND HAZARDOUS AIR POLLUTANT INVENTORY (Inventory of air pollution sources) Business SIC classification: REFUSE SYSTEMSBusiness NAICS classification: SOLID WASTE LANDFILL.
Housing units lacking complete plumbing facilities: 0.3%
Housing units lacking complete kitchen facilities: 0.6%
72.8% Utility gas 22.0% Electricity 2.7% Fuel oil, kerosene, etc. 1.8% Bottled, tank, or LP gas
Population in 1990: 14,137. Population change in the 1990s: +1,782 (+12.6%).
Place of birth for U.S.-born residents:
This state: 15,049Northeast: 623Midwest: 294South: 909West: 359
67% of the 14559 zip code residents lived in the same house 5 years ago.
Out of people who lived in different houses, 83% lived in this county.
Out of people who lived in different counties, 50% lived in New York.
94% of the 14559 zip code residents lived in the same house 1 year ago.
Out of people who lived in different houses, 67% moved from this county.
Out of people who lived in different houses, 10% moved from different county within same state.
Out of people who lived in different houses, 21% moved from different state.
Private vs. public school enrollment:
Students in private schools in grades 1 to 8 (elementary and middle school): 119
Students in private schools in grades 9 to 12 (high school): 174
Students in private undergraduate colleges: 204
Occupation by median earnings in the past 12 months ($)
104,305 Architecture and engineering occupations 78,171 Computer and mathematical occupations 72,237 Law enforcement workers including supervisors 68,890 Health diagnosing and treating practitioners and other technical occupations 67,030 Management occupations 66,943 Business and financial operations occupations
Companies with federal contracts located in this zip code:
BRIC ENGINEERED SYSTEMS LIMITE (409 SOUTH UNION STREET in SPENCERPORT, NY; small business)
$275,000 with Army for Electric Arc Welding Equipment. Signed on 2004-09-29. Completion date: 2005-01-31.
Top industries in this zip code by the number of employees in 2005:
Accommodation and Food Services: Limited-Service Restaurants (20-49 employees: 3 establishments, 10-19 employees: 3 establishments, 5-9 employees: 1 establishment, 1-4 employees: 4 establishments)Administrative and Support and Waste Management and Remediation Services: Solid Waste Collection (50-99: 1, 1-4: 1)Health Care and Social Assistance: Nursing Care Facilities (50-99: 1)Construction: Highway, Street, and Bridge Construction (50-99: 1)Health Care and Social Assistance: Offices of Dentists (20-49: 1, 10-19: 1, 5-9: 2, 1-4: 2)Accommodation and Food Services: Full-Service Restaurants (10-19: 3, 5-9: 1, 1-4: 4)
People in group quarters in 2010:
29 people in group homes intended for adults
27 people in nursing facilities/skilled-nursing facilities
13 people in residential treatment centers for adults
2 people in other noninstitutional facilities
People in group quarters in 2000:
46 people in agriculture workers' dormitories on farms
29 people in nursing homes
21 people in homes for the mentally retarded
14 people in homes for the mentally ill
Fatal accident statistics in 2014:
Fatal accident count: 2Vehicles involved in fatal accidents: 4Fatal accidents caused by drunken drivers: 0Fatalities: 2Persons involved in fatal accidents: 5Pedestrians involved in fatal accidents: 0
Fatal accident statistics in 2012:
Fatal accident count: 1Vehicles involved in fatal accidents: 3Fatal accidents caused by drunken drivers: 0Fatalities: 1Persons involved in fatal accidents: 4Pedestrians involved in fatal accidents: 0
Home Mortgage Disclosure Act Aggregated Statistics For Year 2009(Based on 12 partial tracts) A) FHA, FSA/RHS & VA B) Conventional C) Refinancings D) Home Improvement Loans F) Non-occupant Loans on Number Average Value Number Average Value Number Average Value Number Average Value Number Average Value
LOANS ORIGINATED 160 $128,997 154 $133,568 418 $127,347 56 $40,602 6 $162,883 APPLICATIONS APPROVED, NOT ACCEPTED 4 $97,340 11 $147,845 35 $136,542 9 $19,882 0 $0 APPLICATIONS DENIED 13 $115,196 12 $109,886 111 $132,456 23 $21,445 5 $89,766 APPLICATIONS WITHDRAWN 9 $111,156 16 $116,146 102 $138,288 5 $59,650 5 $116,924 FILES CLOSED FOR INCOMPLETENESS 1 $140,270 3 $134,040 24 $131,560 0 $0 0 $0
Aggregated Statistics For Year 2008(Based on 12 partial tracts) A) FHA, FSA/RHS & VA B) Conventional C) Refinancings D) Home Improvement Loans E) Loans on Dwellings For 5+ Families F) Non-occupant Loans on G) Loans On Manufactured Number Average Value Number Average Value Number Average Value Number Average Value Number Average Value Number Average Value Number Average Value
LOANS ORIGINATED 120 $126,645 234 $141,530 236 $114,431 66 $30,111 1 $254,540 15 $78,257 2 $32,795 APPLICATIONS APPROVED, NOT ACCEPTED 13 $153,836 25 $188,132 45 $123,590 12 $64,545 0 $0 5 $106,800 2 $33,775 APPLICATIONS DENIED 9 $132,120 32 $88,177 127 $124,321 50 $31,897 0 $0 7 $135,987 9 $28,707 APPLICATIONS WITHDRAWN 12 $110,083 6 $154,723 96 $132,447 4 $37,560 0 $0 1 $86,150 0 $0 FILES CLOSED FOR INCOMPLETENESS 1 $68,530 9 $109,260 22 $107,663 4 $45,795 0 $0 0 $0 0 $0
Aggregated Statistics For Year 2007(Based on 12 partial tracts) A) FHA, FSA/RHS & VA B) Conventional C) Refinancings D) Home Improvement Loans E) Loans on Dwellings For 5+ Families F) Non-occupant Loans on G) Loans On Manufactured Number Average Value Number Average Value Number Average Value Number Average Value Number Average Value Number Average Value Number Average Value
LOANS ORIGINATED 62 $128,340 339 $117,593 276 $101,000 123 $38,372 2 $1,313,780 22 $84,212 0 $0 APPLICATIONS APPROVED, NOT ACCEPTED 8 $104,838 30 $118,421 39 $113,597 29 $23,717 0 $0 6 $69,053 1 $3,920 APPLICATIONS DENIED 6 $134,608 47 $133,566 236 $132,462 93 $28,392 0 $0 17 $71,085 0 $0 APPLICATIONS WITHDRAWN 3 $225,003 15 $111,689 167 $115,172 16 $34,965 0 $0 5 $84,142 0 $0 FILES CLOSED FOR INCOMPLETENESS 1 $124,600 9 $120,271 35 $151,342 5 $29,554 0 $0 3 $94,460 0 $0
Aggregated Statistics For Year 2006(Based on 12 partial tracts) A) FHA, FSA/RHS & VA B) Conventional C) Refinancings D) Home Improvement Loans E) Loans on Dwellings For 5+ Families F) Non-occupant Loans on G) Loans On Manufactured Number Average Value Number Average Value Number Average Value Number Average Value Number Average Value Number Average Value Number Average Value
LOANS ORIGINATED 56 $122,001 451 $116,325 346 $88,311 147 $25,431 3 $6,608,777 31 $106,032 0 $0 APPLICATIONS APPROVED, NOT ACCEPTED 0 $0 45 $142,705 71 $97,270 20 $27,744 0 $0 7 $151,403 3 $72,767 APPLICATIONS DENIED 4 $109,160 50 $120,346 315 $99,673 78 $34,410 0 $0 21 $62,970 3 $86,283 APPLICATIONS WITHDRAWN 5 $139,868 36 $134,347 177 $104,622 15 $55,932 0 $0 3 $149,420 0 $0 FILES CLOSED FOR INCOMPLETENESS 2 $86,805 22 $104,123 69 $123,247 3 $44,453 0 $0 2 $132,260 0 $0
Aggregated Statistics For Year 2005(Based on 12 partial tracts) A) FHA, FSA/RHS & VA B) Conventional C) Refinancings D) Home Improvement Loans F) Non-occupant Loans on G) Loans On Manufactured Number Average Value Number Average Value Number Average Value Number Average Value Number Average Value Number Average Value
LOANS ORIGINATED 74 $115,763 395 $112,821 420 $101,126 132 $39,076 40 $91,915 1 $77,340 APPLICATIONS APPROVED, NOT ACCEPTED 1 $107,620 33 $119,875 55 $97,944 22 $34,618 1 $243,790 2 $63,680 APPLICATIONS DENIED 8 $142,952 33 $108,890 281 $113,703 75 $36,927 5 $68,462 4 $62,115 APPLICATIONS WITHDRAWN 5 $149,922 30 $103,522 198 $126,496 39 $122,925 6 $103,913 1 $52,870 FILES CLOSED FOR INCOMPLETENESS 1 $58,740 13 $142,355 99 $140,935 7 $76,883 0 $0 0 $0
Aggregated Statistics For Year 2004(Based on 12 partial tracts) A) FHA, FSA/RHS & VA B) Conventional C) Refinancings D) Home Improvement Loans E) Loans on Dwellings For 5+ Families F) Non-occupant Loans on G) Loans On Manufactured Number Average Value Number Average Value Number Average Value Number Average Value Number Average Value Number Average Value Number Average Value
LOANS ORIGINATED 66 $118,712 389 $126,381 522 $100,223 127 $33,109 1 $399,040 33 $91,071 5 $53,670 APPLICATIONS APPROVED, NOT ACCEPTED 5 $104,070 30 $155,508 71 $97,289 26 $30,885 0 $0 3 $87,583 3 $48,330 APPLICATIONS DENIED 3 $111,333 35 $86,191 230 $114,016 70 $51,896 0 $0 7 $119,261 16 $59,392 APPLICATIONS WITHDRAWN 4 $132,790 21 $152,565 230 $108,690 24 $70,009 1 $12,454,760 6 $125,062 0 $0 FILES CLOSED FOR INCOMPLETENESS 1 $99,860 7 $107,800 80 $117,003 8 $29,416 0 $0 0 $0 0 $0
Aggregated Statistics For Year 2003(Based on 12 partial tracts) A) FHA, FSA/RHS & VA B) Conventional C) Refinancings D) Home Improvement Loans E) Loans on Dwellings For 5+ Families F) Non-occupant Loans on Number Average Value Number Average Value Number Average Value Number Average Value Number Average Value Number Average Value
LOANS ORIGINATED 71 $101,772 431 $119,132 1,223 $101,764 70 $13,904 4 $1,459,752 42 $86,399 APPLICATIONS APPROVED, NOT ACCEPTED 3 $107,097 36 $123,543 186 $102,322 17 $25,855 0 $0 4 $67,322 APPLICATIONS DENIED 10 $87,779 31 $97,366 359 $103,092 51 $16,534 0 $0 14 $82,764 APPLICATIONS WITHDRAWN 6 $75,152 35 $102,431 236 $111,253 20 $31,977 0 $0 9 $82,688 FILES CLOSED FOR INCOMPLETENESS 4 $87,935 12 $348,302 69 $95,460 5 $22,106 0 $0 3 $34,600
Aggregated Statistics For Year 2002(Based on 12 partial tracts) A) FHA, FSA/RHS & VA B) Conventional C) Refinancings D) Home Improvement Loans E) Loans on Dwellings For 5+ Families F) Non-occupant Loans on Number Average Value Number Average Value Number Average Value Number Average Value Number Average Value Number Average Value
LOANS ORIGINATED 77 $100,788 407 $107,685 740 $99,735 65 $12,542 1 $241,840 22 $78,053 APPLICATIONS APPROVED, NOT ACCEPTED 1 $93,110 41 $120,473 132 $98,506 21 $15,402 0 $0 5 $97,014 APPLICATIONS DENIED 14 $94,873 24 $84,819 226 $92,662 40 $18,377 0 $0 8 $89,436 APPLICATIONS WITHDRAWN 7 $122,129 25 $155,791 191 $101,571 11 $32,464 0 $0 4 $56,465 FILES CLOSED FOR INCOMPLETENESS 3 $105,850 8 $110,794 43 $86,459 1 $35,240 0 $0 0 $0
Aggregated Statistics For Year 2001(Based on 12 partial tracts) A) FHA, FSA/RHS & VA B) Conventional C) Refinancings D) Home Improvement Loans E) Loans on Dwellings For 5+ Families F) Non-occupant Loans on Number Average Value Number Average Value Number Average Value Number Average Value Number Average Value Number Average Value
LOANS ORIGINATED 101 $96,955 439 $110,355 620 $97,482 89 $15,862 2 $269,420 21 $58,050 APPLICATIONS APPROVED, NOT ACCEPTED 3 $98,130 29 $142,700 67 $77,633 36 $18,714 0 $0 0 $0 APPLICATIONS DENIED 6 $110,992 29 $90,357 215 $76,846 47 $18,465 0 $0 9 $40,062 APPLICATIONS WITHDRAWN 2 $82,295 21 $107,731 187 $95,742 16 $25,199 0 $0 1 $84,640 FILES CLOSED FOR INCOMPLETENESS 0 $0 5 $106,508 32 $104,527 2 $17,915 0 $0 1 $77,390
Aggregated Statistics For Year 2000(Based on 12 partial tracts) A) FHA, FSA/RHS & VA B) Conventional C) Refinancings D) Home Improvement Loans E) Loans on Dwellings For 5+ Families F) Non-occupant Loans on Number Average Value Number Average Value Number Average Value Number Average Value Number Average Value Number Average Value
LOANS ORIGINATED 97 $94,664 326 $109,925 176 $74,145 104 $17,098 3 $988,813 9 $74,166 APPLICATIONS APPROVED, NOT ACCEPTED 1 $90,070 22 $80,857 60 $67,772 33 $16,320 0 $0 0 $0 APPLICATIONS DENIED 13 $97,096 31 $109,757 160 $69,891 42 $19,415 0 $0 5 $88,240 APPLICATIONS WITHDRAWN 4 $98,972 16 $120,551 72 $60,137 10 $37,704 0 $0 0 $0 FILES CLOSED FOR INCOMPLETENESS 4 $106,488 10 $192,678 31 $109,119 4 $27,582 0 $0 1 $138,150
Aggregated Statistics For Year 1999(Based on 6 partial tracts) A) FHA, FSA/RHS & VA B) Conventional C) Refinancings D) Home Improvement Loans E) Loans on Dwellings For 5+ Families F) Non-occupant Loans on Number Average Value Number Average Value Number Average Value Number Average Value Number Average Value Number Average Value
LOANS ORIGINATED 50 $88,868 185 $101,641 208 $84,627 55 $14,490 0 $0 8 $58,305 APPLICATIONS APPROVED, NOT ACCEPTED 3 $68,347 10 $103,623 36 $94,482 14 $11,089 0 $0 0 $0 APPLICATIONS DENIED 3 $78,900 16 $73,582 75 $72,250 34 $20,185 0 $0 1 $120,910 APPLICATIONS WITHDRAWN 3 $97,947 12 $84,538 56 $75,777 21 $72,856 1 $74,440 2 $99,910 FILES CLOSED FOR INCOMPLETENESS 1 $58,810 3 $99,143 18 $79,766 0 $0 0 $0 0 $0
Detailed HMDA statistics for the following Tracts:
0148.02
,
0149.01 ,
0149.03 ,
0149.04
Private Mortgage Insurance Companies Aggregated Statistics For Year 2009(Based on 12 partial tracts) A) Conventional B) Refinancings C) Non-occupant Loans on Number Average Value Number Average Value Number Average Value
LOANS ORIGINATED 31 $159,983 31 $151,277 0 $0 APPLICATIONS APPROVED, NOT ACCEPTED 6 $114,998 6 $113,602 1 $73,760 APPLICATIONS DENIED 4 $139,415 1 $197,100 0 $0 APPLICATIONS WITHDRAWN 4 $175,220 1 $158,410 0 $0 FILES CLOSED FOR INCOMPLETENESS 0 $0 1 $190,910 0 $0
Aggregated Statistics For Year 2008(Based on 12 partial tracts) A) Conventional B) Refinancings C) Non-occupant Loans on Number Average Value Number Average Value Number Average Value
LOANS ORIGINATED 82 $152,511 28 $137,474 1 $100,360 APPLICATIONS APPROVED, NOT ACCEPTED 19 $195,601 10 $178,864 0 $0 APPLICATIONS DENIED 4 $152,628 5 $146,340 0 $0 APPLICATIONS WITHDRAWN 4 $93,690 2 $110,625 0 $0 FILES CLOSED FOR INCOMPLETENESS 2 $79,355 0 $0 0 $0
Aggregated Statistics For Year 2007(Based on 12 partial tracts) A) Conventional B) Refinancings C) Non-occupant Loans on Number Average Value Number Average Value Number Average Value
LOANS ORIGINATED 108 $126,302 34 $147,641 7 $78,279 APPLICATIONS APPROVED, NOT ACCEPTED 15 $148,306 4 $173,700 0 $0 APPLICATIONS DENIED 0 $0 0 $0 0 $0 APPLICATIONS WITHDRAWN 1 $326,480 5 $127,464 0 $0 FILES CLOSED FOR INCOMPLETENESS 0 $0 0 $0 0 $0
Aggregated Statistics For Year 2006(Based on 12 partial tracts) A) Conventional B) Refinancings C) Non-occupant Loans on Number Average Value Number Average Value Number Average Value
LOANS ORIGINATED 78 $116,271 25 $136,814 1 $101,580 APPLICATIONS APPROVED, NOT ACCEPTED 14 $141,195 14 $120,619 0 $0 APPLICATIONS DENIED 2 $169,290 0 $0 0 $0 APPLICATIONS WITHDRAWN 3 $163,517 4 $91,095 0 $0 FILES CLOSED FOR INCOMPLETENESS 3 $117,393 0 $0 0 $0
Aggregated Statistics For Year 2005(Based on 12 partial tracts) A) Conventional B) Refinancings C) Non-occupant Loans on Number Average Value Number Average Value Number Average Value
LOANS ORIGINATED 83 $115,178 46 $132,406 7 $98,600 APPLICATIONS APPROVED, NOT ACCEPTED 21 $165,055 17 $134,531 2 $128,340 APPLICATIONS DENIED 4 $76,482 0 $0 0 $0 APPLICATIONS WITHDRAWN 1 $396,840 6 $155,408 0 $0 FILES CLOSED FOR INCOMPLETENESS 0 $0 2 $88,175 0 $0
Aggregated Statistics For Year 2004(Based on 12 partial tracts) A) Conventional B) Refinancings C) Non-occupant Loans on Number Average Value Number Average Value Number Average Value
LOANS ORIGINATED 119 $123,436 61 $113,287 9 $87,727 APPLICATIONS APPROVED, NOT ACCEPTED 19 $157,415 15 $113,544 3 $68,913 APPLICATIONS DENIED 1 $308,390 1 $127,270 0 $0 APPLICATIONS WITHDRAWN 3 $204,423 9 $121,146 0 $0 FILES CLOSED FOR INCOMPLETENESS 3 $93,060 2 $96,990 1 $44,060
Aggregated Statistics For Year 2003(Based on 12 partial tracts) A) Conventional B) Refinancings C) Non-occupant Loans on Number Average Value Number Average Value Number Average Value
LOANS ORIGINATED 121 $130,773 206 $122,581 2 $75,575 APPLICATIONS APPROVED, NOT ACCEPTED 38 $138,399 38 $136,273 0 $0 APPLICATIONS DENIED 3 $107,510 5 $129,308 2 $158,710 APPLICATIONS WITHDRAWN 4 $232,422 4 $132,910 0 $0 FILES CLOSED FOR INCOMPLETENESS 0 $0 0 $0 0 $0
Aggregated Statistics For Year 2002(Based on 12 partial tracts) A) Conventional B) Refinancings C) Non-occupant Loans on Number Average Value Number Average Value Number Average Value
LOANS ORIGINATED 146 $111,693 118 $116,779 6 $93,882 APPLICATIONS APPROVED, NOT ACCEPTED 16 $148,999 34 $121,348 0 $0 APPLICATIONS DENIED 2 $79,805 4 $119,395 1 $131,800 APPLICATIONS WITHDRAWN 3 $116,480 5 $118,902 0 $0 FILES CLOSED FOR INCOMPLETENESS 0 $0 0 $0 0 $0
Aggregated Statistics For Year 2001(Based on 12 partial tracts) A) Conventional B) Refinancings C) Non-occupant Loans on Number Average Value Number Average Value Number Average Value
LOANS ORIGINATED 138 $128,603 76 $126,157 5 $68,006 APPLICATIONS APPROVED, NOT ACCEPTED 11 $137,124 6 $170,098 0 $0 APPLICATIONS DENIED 5 $107,260 4 $134,575 1 $117,290 APPLICATIONS WITHDRAWN 2 $194,975 0 $0 0 $0 FILES CLOSED FOR INCOMPLETENESS 0 $0 0 $0 0 $0
Aggregated Statistics For Year 2000(Based on 12 partial tracts) A) Conventional B) Refinancings C) Non-occupant Loans on Number Average Value Number Average Value Number Average Value
LOANS ORIGINATED 101 $113,519 7 $147,836 1 $124,600 APPLICATIONS APPROVED, NOT ACCEPTED 26 $141,692 7 $123,776 0 $0 APPLICATIONS DENIED 1 $80,280 1 $296,610 0 $0 APPLICATIONS WITHDRAWN 3 $89,873 0 $0 0 $0 FILES CLOSED FOR INCOMPLETENESS 0 $0 0 $0 0 $0
Aggregated Statistics For Year 1999(Based on 6 partial tracts) A) Conventional B) Refinancings Number Average Value Number Average Value
LOANS ORIGINATED 59 $106,664 22 $111,148 APPLICATIONS APPROVED, NOT ACCEPTED 8 $124,675 5 $126,988 APPLICATIONS DENIED 6 $116,578 2 $102,890 APPLICATIONS WITHDRAWN 1 $47,290 0 $0 FILES CLOSED FOR INCOMPLETENESS 2 $108,340 0 $0
Detailed PMIC statistics for the following Tracts:
0148.02
,
0149.01 ,
0149.03 ,
0149.04
2002 - 2018 National Fire Incident Reporting System (NFIRS) incidents See full 2006 National Fire Incident Reporting System statistics for zip code 14559, New York
Most common first names in zip code 14559 among deceased individuals Name Count Lived (average)
John 78 75.0 years William 70 76.4 years Mary 67 80.0 years Robert 60 72.4 years George 54 77.4 years Charles 53 78.4 years James 46 71.7 years Helen 45 81.4 years Margaret 39 79.9 years Frank 36 78.4 years
Most common last names in zip code 14559 among deceased individuals Last name Count Lived (average)
Smith 37 79.4 years Miller 16 76.9 years Brown 16 71.9 years Webster 12 74.4 years Hill 11 82.6 years Wright 11 79.5 years Wilson 11 74.4 years Adams 10 73.5 years Zarpentine 9 66.3 years Hall 9 82.0 years
Businesses in zip code 14559
Name Count Name Count
Chevrolet 1 McDonald's 1 Curves 1 Rite Aid 1 FedEx 1 Subway 1 MasterBrand Cabinets 4 Tim Hortons 2
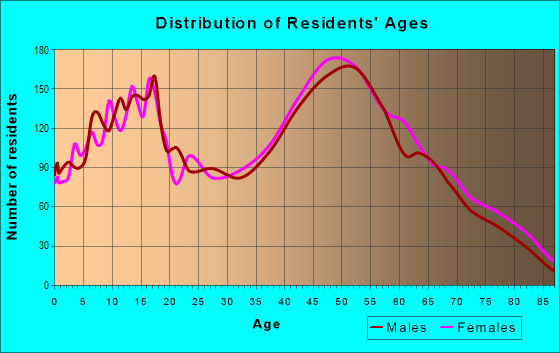
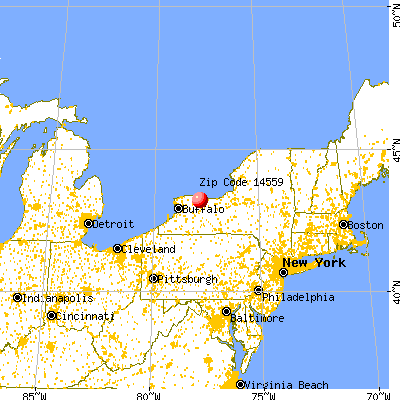


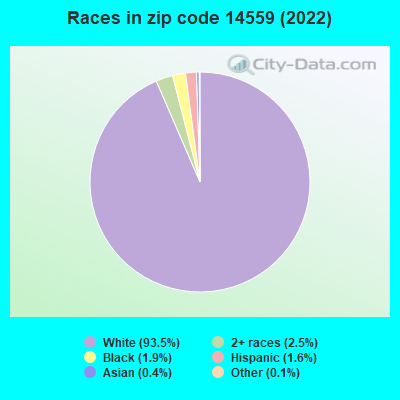


+$3,294
-$2,666
 Nearest zip codes: 14514, 14468, 14624, 14626, 14428, 14420.
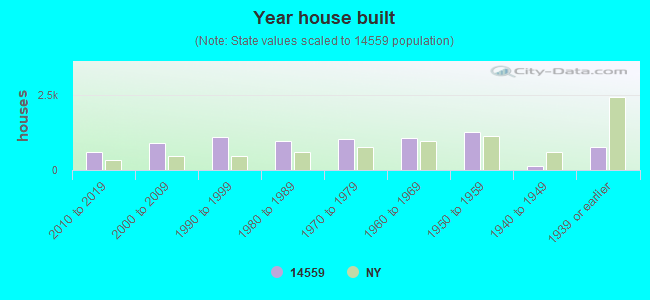

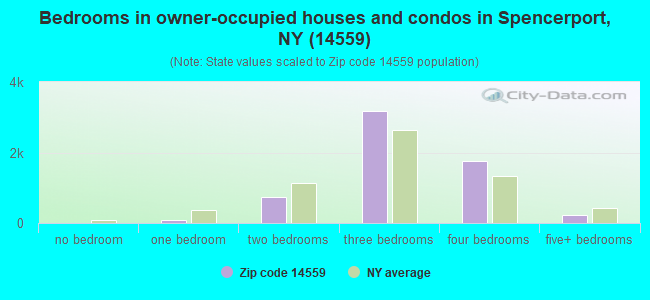
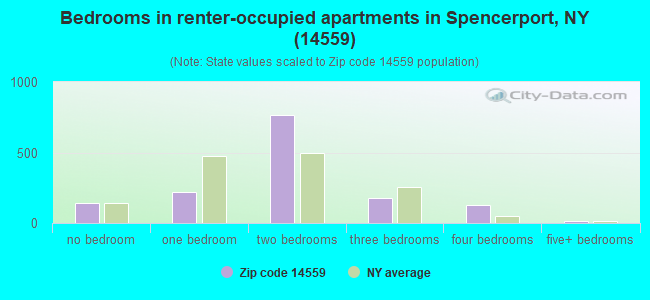
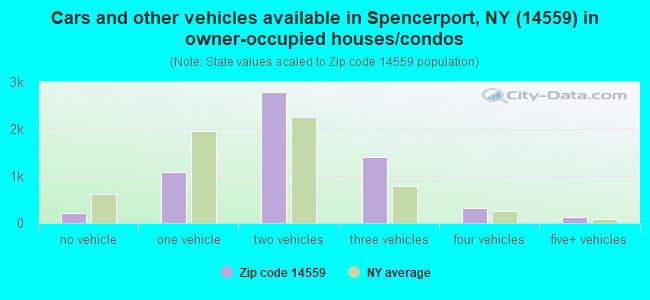
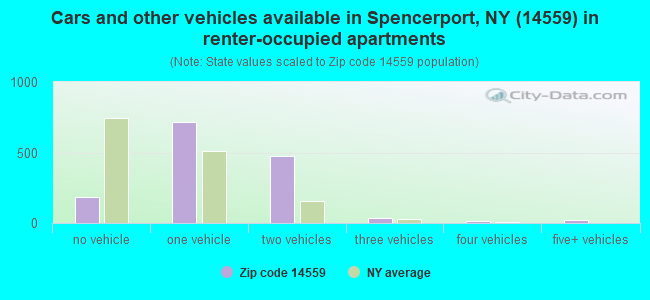


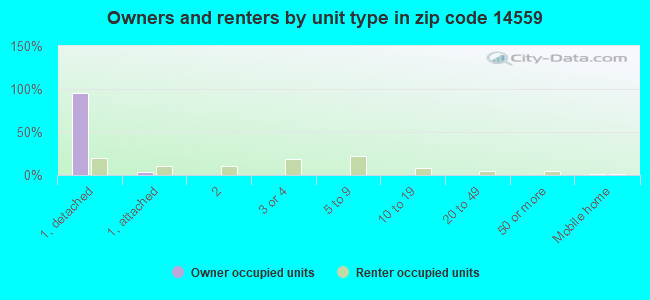
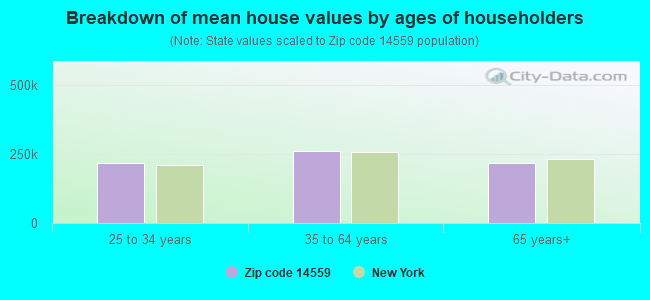


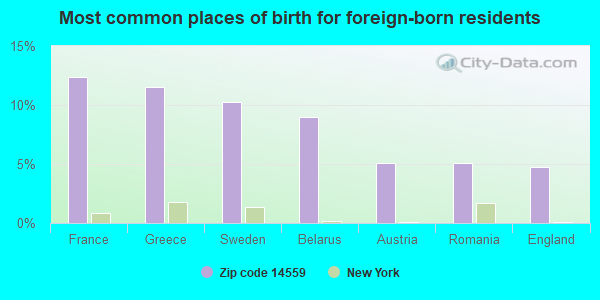
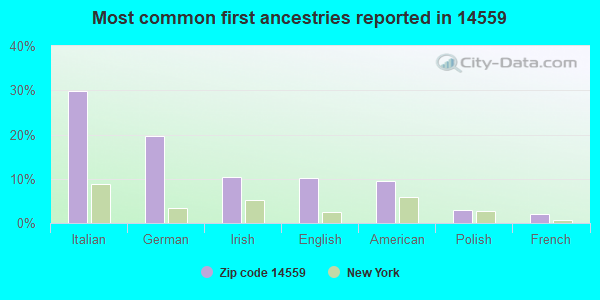
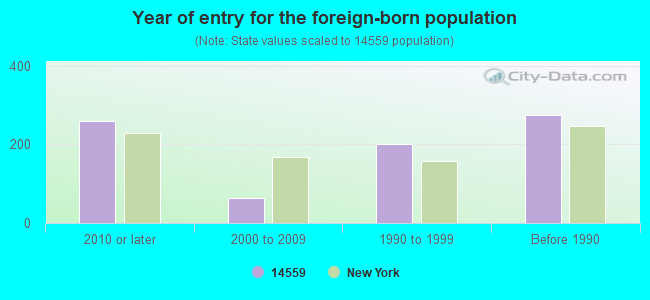


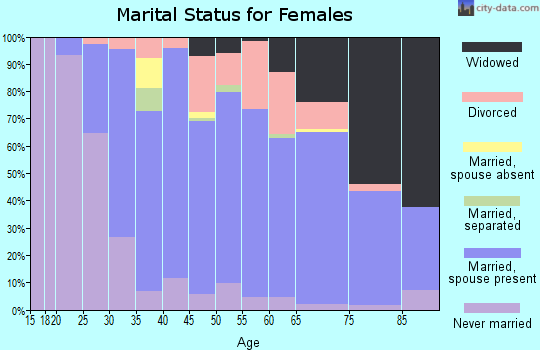
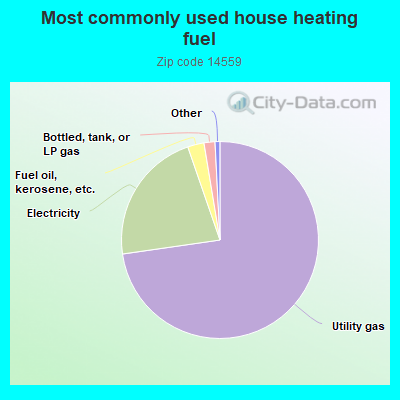
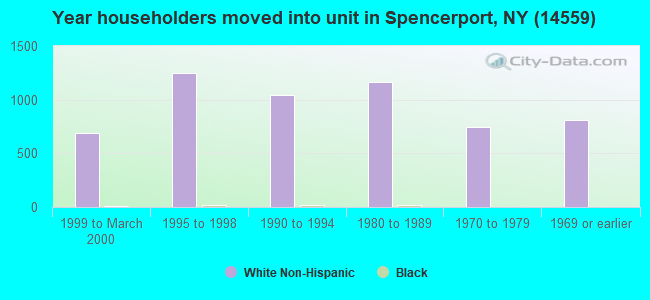
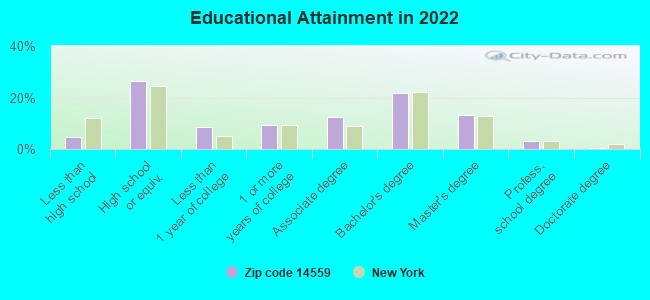
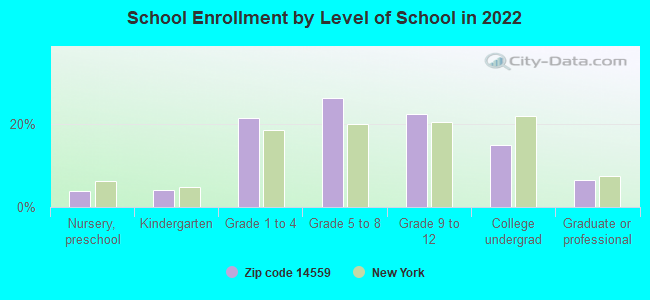
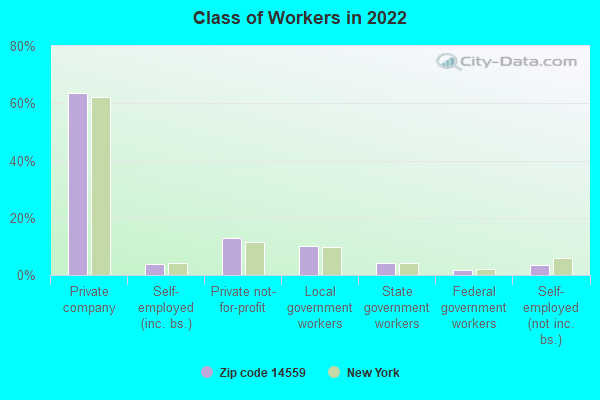
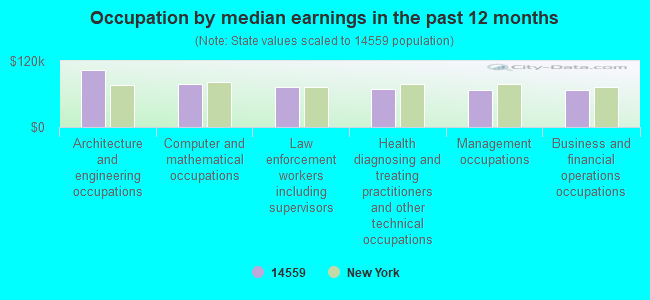
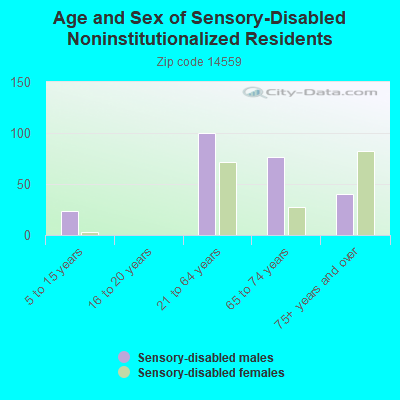
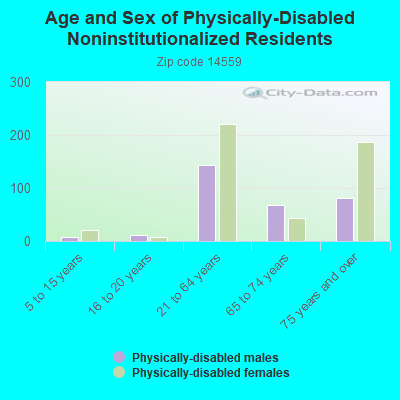
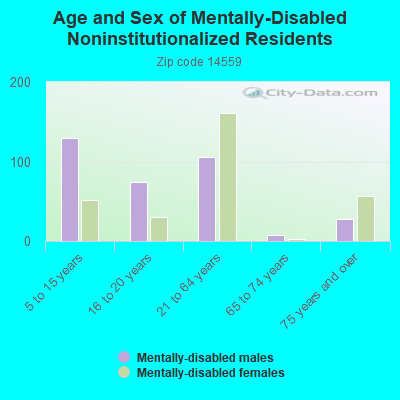
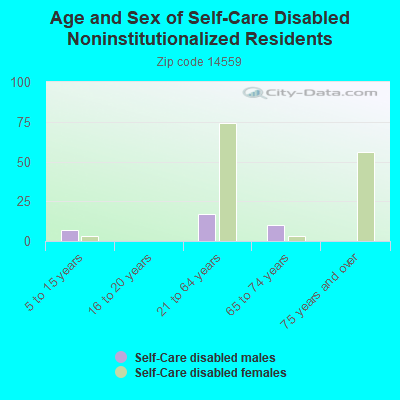
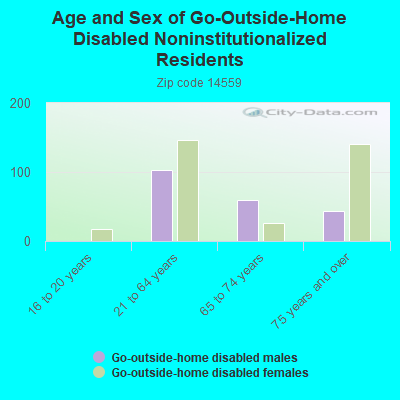
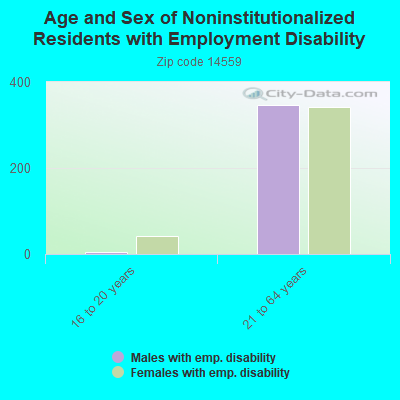
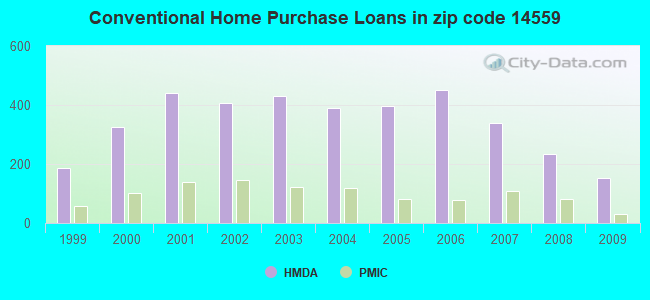
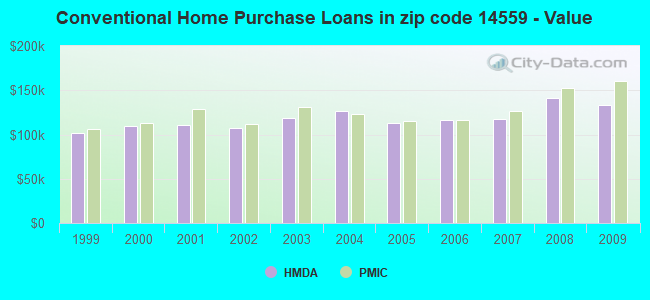
 According to the data from the years 2002 - 2018 the average number of fire incidents per year is 39. The highest number of fire incidents - 77 took place in 2008, and the least - 3 in 2002. The data has an increasing trend.
 When looking into fire subcategories, the most reports belonged to: Outside Fires (52.9%), and Structure Fires (34.8%).