Estimated zip code population in 2022: 1,285 Zip code population in 2010: 1,176 Zip code population in 2000: 1,119
Houses and condos: 688 Renter-occupied apartments: 63
% of renters here:
11%
State:
46%
March 2022 cost of living index in zip code 14571: 95.7 (near average, U.S. average is 100)
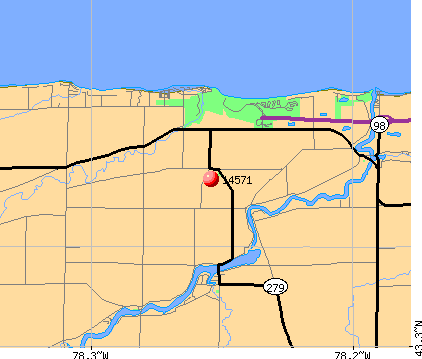
Land area: 18.4 sq. mi. Water area: 0.5 sq. mi.
Population density: 70 people per square mile
(very low).
OSM Map
General Map
Google Map
MSN Map
OSM Map
General Map
Google Map
MSN Map
OSM Map
General Map
Google Map
MSN Map
OSM Map
General Map
Google Map
MSN Map
Please wait while loading the map...
Real estate property taxes paid for housing units in 2022:
This zip code:
2.2% ($3,617)
New York:
1.5% ($6,180)
Median real estate property taxes paid for housing units with mortgages in 2022: $3,597 (2.2%) Median real estate property taxes paid for housing units with no mortgage in 2022: $3,635 (2.1%)
Averages for the 2020 tax year for zip code 14571, filed in 2021:
Average Adjusted Gross Income (AGI) in 2020: $58,570 (Individual Income Tax Returns)
Here:
$58,570
State:
$90,930
Salary/wage: $46,024 (reported on 77.3% of returns)
Here:
$46,024
State:
$72,104
(% of AGI for various income ranges: 1640.0% for AGIs below $25k, 4451.8% for AGIs $25k-50k, 6031.4% for AGIs $50k-75k, 7357.5% for AGIs $75k-100k, 19212.0% for AGIs $100k-200k)
Taxable interest for individuals: $728 (reported on 37.9% of returns)
This zip code:
$728
New York:
$3,075
(% of AGI for various income ranges: 24.5% for AGIs below $25k, 21.8% for AGIs $25k-50k, 42.9% for AGIs $50k-75k, 7.5% for AGIs $75k-100k, 196.0% for AGIs $100k-200k)
Ordinary dividends: $5,445 (reported on 16.7% of returns)
Here:
$5,445
State:
$11,095
(% of AGI for various income ranges: 55.5% for AGIs below $25k, 33.6% for AGIs $25k-50k, 87.1% for AGIs $50k-75k, 880.0% for AGIs $100k-200k)
Net capital gain/loss in AGI: +$5,810 (reported on 15.2% of returns)
Here:
+$5,810
State:
+$44,925
(% of AGI for various income ranges: 74.5% for AGIs below $25k, 41.4% for AGIs $50k-75k, 940.0% for AGIs $100k-200k)
Profit/loss from business: +$8,250 (reported on 9.1% of returns)
Here:
+$8,250
State:
+$14,940
(% of AGI for various income ranges: 119.1% for AGIs below $25k, 296.4% for AGIs $25k-50k, 54.3% for AGIs $50k-75k)
Taxable individual retirement arrangement distribution: $23,540 (reported on 7.6% of returns)
14571:
$23,540
New York:
$19,609
(% of AGI for various income ranges: 299.1% for AGIs $25k-50k, 2120.0% for AGIs $75k-100k)
Total itemized deductions: $21,825 (reported on 6.1% of returns)
Here:
$21,825
State:
$39,326
(% of AGI for various income ranges: 2182.5% for AGIs $75k-100k)
Charity contributions: $8,733 (reported on 4.5% of returns)
Here:
$8,733
State:
$15,420
(% of AGI for various income ranges: 655.0% for AGIs $75k-100k)
Taxes paid: $8,275 (reported on 6.1% of returns)
14571:
$8,275
State:
$9,183
(% of AGI for various income ranges: 827.5% for AGIs $75k-100k)
Earned income credit: $1,822 (reported on 13.6% of returns)
Here:
$1,822
State:
$2,138
(% of AGI for various income ranges: 72.7% for AGIs below $25k, 76.4% for AGIs $25k-50k)
Percentage of individuals using paid preparers for their 2020 taxes: 92.4%
Here:
92%
State:
95%
(% for various income ranges: 95.0% for AGIs below $25k, 90.0% for AGIs $25k-50k, 90.0% for AGIs $50k-75k, 100.0% for AGIs $75k-100k, 90.9% for AGIs $100k-200k)
Averages for the 2012 tax year for zip code 14571, filed in 2013:
Average Adjusted Gross Income (AGI) in 2012: $47,238 (Individual Income Tax Returns)
Here:
$47,238
State:
$77,088
Salary/wage: $41,498 (reported on 80.3% of returns)
Here:
$41,498
State:
$60,593
(% of AGI for various income ranges: 70.5% for AGIs below $25k, 67.4% for AGIs $25k-50k, 72.0% for AGIs $50k-75k, 76.2% for AGIs $75k-100k, 68.8% for AGIs $100k-200k)
Taxable interest for individuals: $752 (reported on 41.0% of returns)
This zip code:
$752
New York:
$3,125
(% of AGI for various income ranges: 0.3% for AGIs below $25k, 1.5% for AGIs $25k-50k, 0.1% for AGIs $50k-75k, 1.1% for AGIs $75k-100k, 0.3% for AGIs $100k-200k)
Ordinary dividends: $3,317 (reported on 19.7% of returns)
Here:
$3,317
State:
$10,299
(% of AGI for various income ranges: 1.4% for AGIs below $25k, 0.5% for AGIs $25k-50k, 1.6% for AGIs $50k-75k, 2.5% for AGIs $100k-200k)
Net capital gain/loss in AGI: +$700 (reported on 11.5% of returns)
Here:
+$700
State:
+$42,474
Profit/loss from business: +$5,414 (reported on 11.5% of returns)
Here:
+$5,414
State:
+$16,168
(% of AGI for various income ranges: 4.1% for AGIs below $25k, 3.9% for AGIs $25k-50k, 0.4% for AGIs $50k-75k)
Taxable individual retirement arrangement distribution: $12,150 (reported on 13.1% of returns)
14571:
$12,150
New York:
$17,621
(% of AGI for various income ranges: 4.4% for AGIs below $25k, 6.5% for AGIs $25k-50k, 9.5% for AGIs $75k-100k)
Total itemized deductions: $18,539 (22% of AGI, reported on 29.5% of returns)
Here:
$18,539
State:
$34,985
Here:
22.4% of AGI
State:
21.3% of AGI
(% of AGI for various income ranges: 7.8% for AGIs below $25k, 9.9% for AGIs $25k-50k, 10.4% for AGIs $50k-75k, 11.8% for AGIs $75k-100k, 14.5% for AGIs $100k-200k)
Charity contributions: $3,200 (reported on 19.7% of returns)
Here:
$3,200
State:
$5,572
(% of AGI for various income ranges: 1.1% for AGIs $25k-50k, 2.3% for AGIs $50k-75k, 2.0% for AGIs $100k-200k)
Taxes paid: $8,833 (reported on 29.5% of returns)
14571:
$8,833
State:
$18,656
(% of AGI for various income ranges: 2.0% for AGIs below $25k, 4.6% for AGIs $25k-50k, 4.6% for AGIs $50k-75k, 5.1% for AGIs $75k-100k, 8.1% for AGIs $100k-200k)
Earned income credit: $2,429 (reported on 11.5% of returns)
Here:
$2,429
State:
$2,230
(% of AGI for various income ranges: 5.1% for AGIs below $25k)
Percentage of individuals using paid preparers for their 2012 taxes: 63.9%
Here:
64%
State:
66%
(% for various income ranges: 62.5% for AGIs below $25k, 62.5% for AGIs $25k-50k, 66.7% for AGIs $50k-75k, 66.7% for AGIs $75k-100k, 66.7% for AGIs $100k-200k)
Averages for the 2004 tax year for zip code 14571, filed in 2005:
Average Adjusted Gross Income (AGI) in 2004: $37,642 (Individual Income Tax Returns)
Here:
$37,642
State:
$59,519
Salary/wage: $32,357 (reported on 83.9% of returns)
Here:
$32,357
State:
$50,673
(% of AGI for various income ranges: 107.5% for AGIs below $10k, 73.4% for AGIs $10k-25k, 72.5% for AGIs $25k-50k, 79.5% for AGIs $50k-75k, 73.0% for AGIs $75k-100k, 57.0% for AGIs over 100k)
Taxable interest for individuals: $1,178 (reported on 54.2% of returns)
This zip code:
$1,178
New York:
$2,377
(% of AGI for various income ranges: 2.6% for AGIs below $10k, 1.7% for AGIs $10k-25k, 2.2% for AGIs $25k-50k, 0.5% for AGIs $50k-75k, 1.0% for AGIs $75k-100k, 2.9% for AGIs over 100k)
Taxable dividends: $1,945 (reported on 30.3% of returns)
Here:
$1,945
State:
$5,394
(% of AGI for various income ranges: 3.4% for AGIs below $10k, 1.1% for AGIs $10k-25k, 1.5% for AGIs $25k-50k, 0.7% for AGIs $50k-75k, 1.2% for AGIs $75k-100k, 3.4% for AGIs over 100k)
Net capital gain/loss: +$2,035 (reported on 19.0% of returns)
Here:
+$2,035
State:
+$23,581
(% of AGI for various income ranges: -4.9% for AGIs below $10k, -0.3% for AGIs $10k-25k, 0.3% for AGIs $25k-50k, 0.6% for AGIs $50k-75k, 1.7% for AGIs $75k-100k, 3.5% for AGIs over 100k)
Profit/loss from business: +$3,797 (reported on 12.3% of returns)
Here:
+$3,797
State:
+$13,809
(% of AGI for various income ranges: 8.2% for AGIs $10k-25k, 0.3% for AGIs $25k-50k, 0.4% for AGIs $50k-75k, 0.5% for AGIs $75k-100k)
IRA payment deduction: $3,455 (reported on 1.8% of returns)
14571:
$3,455
New York:
$3,115
Total itemized deductions: $14,290 (22% of AGI, reported on 32.1% of returns)
Here:
$14,290
State:
$25,864
Here:
22.4% of AGI
State:
21.9% of AGI
(% of AGI for various income ranges: 6.6% for AGIs $10k-25k, 13.0% for AGIs $25k-50k, 11.6% for AGIs $50k-75k, 14.1% for AGIs $75k-100k, 14.7% for AGIs over 100k)
Charity contributions deductions: $1,825 (3% of AGI, reported on 28.5% of returns)
Here:
$1,825
State:
$4,439
Here:
2.7% of AGI
State:
3.6% of AGI
(% of AGI for various income ranges: 0.4% for AGIs $10k-25k, 1.1% for AGIs $25k-50k, 1.2% for AGIs $50k-75k, 1.9% for AGIs $75k-100k, 2.3% for AGIs over 100k)
Total tax: $4,468 (reported on 76.9% of returns)
14571:
$4,468
State:
$11,730
(% of AGI for various income ranges: 3.2% for AGIs below $10k, 4.4% for AGIs $10k-25k, 6.1% for AGIs $25k-50k, 9.3% for AGIs $50k-75k, 9.5% for AGIs $75k-100k, 16.8% for AGIs over 100k)
Earned income credit: $1,642 (reported on 13.5% of returns)
Here:
$1,642
State:
$1,757
Percentage of individuals using paid preparers for their 2004 taxes: 63.1%
Here:
63%
State:
67%
(% for various income ranges: 48.6% for AGIs below $10k, 62.8% for AGIs $10k-25k, 69.1% for AGIs $25k-50k, 62.2% for AGIs $50k-75k, 75.6% for AGIs $75k-100k, 65.5% for AGIs over 100k)
Household received Food Stamps/SNAP in the past 12 months: 111 Household did not receive Food Stamps/SNAP in the past 12 months: 454
Women who had a birth in the past 12 months: 36 (36 now married, 0 unmarried) Women who did not have a birth in the past 12 months: 216 (69 now married, 147 unmarried)
Housing units in zip code 14571 with a mortgage: 254 (21 second mortgage, 21 both second mortgage and home equity loan) Houses without a mortgage: 18
Median monthly owner costs for units with a mortgage: $1,472 Median monthly owner costs for units without a mortgage: $669
Residents with income below the poverty level in 2022:
This zip code:
10.2%
Whole state:
14.3%
Residents with income below 50% of the poverty level in 2022:
This zip code:
5.1%
Whole state:
6.8%
Median number of rooms in houses and condos:
Here:
5.9
State:
6.3
Median number of rooms in apartments:
Here:
3.3
State:
3.8
Notable locations in this zip code not listed on our city pages
Notable locations in zip code 14571: Albion Water Treatment Plant (A), Oak Orchard Yacht Club (B), Harbour Pointe Country Club (C), Riverview Campground (D), Red Breeze Campsite (E), Oak Orchard (F), Orchard Dale Fruit Farms (G), Carlton Fire Company (H). Display/hide their locations on the map
Cemeteries: Kenyonville Cemetery (1), Brown Cemetery (2), Waterport Cemetery (3), Fuller Cemetery (4), Carlton Cemetery (5). Display/hide their locations on the map
In group quarters: 106 (-1 institutionalized population)
Size of family households: 265 2-persons, 42 3-persons, 41 4-persons, 23 5-persons
Size of nonfamily households: 124 1-person, 69 2-persons, 2 3-persons
106 married couples with children.
0 single-parent households ().
98.0% of residents of 14571 zip code speak English at home.
2.9% of residents speak Spanish at home (100% not at all).
Foreign born population: 37 (2.9%) (0.0% of them are naturalized citizens)
:
2.9%
Whole state:
22.7%
87%Costa Rica
17%German
13%American
11%English
11%European
6%Irish
4%Scotch-Irish
3%Polish
Year of entry for the foreign-born population
412010 or later
22000 to 2009
01990 to 1999
0Before 1990
Facilities with environmental interests located in this zip code:
CIRCLE R FRUIT FARMS (13485 ROOSEVELT HWY in WATERPORT, NY)
STATE MASTER (New York facility tracking) - National Pollutant Discharge Elimination System Permit, (Resource Conservation and Recovery Act (tracking hazardous waste)) Business SIC classification: SERVICES
Housing units lacking complete plumbing facilities: 4.3% Housing units lacking complete kitchen facilities: 4.3%
39.6%Bottled, tank, or LP gas
35.1%Fuel oil, kerosene, etc.
12.0%Wood
7.7%Electricity
2.7%Coal or coke
1.8%Utility gas
1.6%Other fuel
Population in 1990: 1,669.
Place of birth for U.S.-born residents:
This state: 994
Northeast: 75
Midwest: 63
South: 98
West: 10
63% of the 14571 zip code residents lived in the same house 5 years ago. Out of people who lived in different houses, 56% lived in this county. Out of people who lived in different counties, 50% lived in New York.
92% of the 14571 zip code residents lived in the same house 1 year ago. Out of people who lived in different houses, 45% moved from this county. Out of people who lived in different houses, 54% moved from different county within same state.
Private vs. public school enrollment:
Students in private schools in grades 1 to 8 (elementary and middle school):
Here:
0.0%
New York:
15.6%
Students in private schools in grades 9 to 12 (high school): 13
Here:
73.5%
New York:
15.0%
Students in private undergraduate colleges: 18
Here:
21.0%
New York:
39.2%
Occupation by median earnings in the past 12 months ($)
79,487Installation, maintenance, and repair occupations
46,540Sales and related occupations
42,870Fire fighting and prevention, and other protective service workers including supervisors
40,187Farming, fishing, and forestry occupations
35,022Construction and extraction occupations
34,005Production occupations
Top industries in this zip code by the number of employees in 2005:
Arts, Entertainment, and Recreation: Fitness and Recreational Sports Centers (1-4 employees: 1 establishment)
Real Estate and Rental and Leasing: Other Activities Related to Real Estate (1-4: 1)
Construction: Highway, Street, and Bridge Construction (1-4: 1)
Accommodation and Food Services: Hotels (except Casino Hotels) and Motels (1-4: 1)
Health Care and Social Assistance: Child Day Care Services (1-4: 1)
Other Services (except Public Administration): Religious Organizations (1-4: 1)
Administrative and Support and Waste Management and Remediation Services: Septic Tank and Related Services (1-4: 1)
People in group quarters in 2010:
2 people in workers' group living quarters and job corps centers
Fatal accident statistics in 2014:
Fatal accident count: 1
Vehicles involved in fatal accidents: 2
Fatal accidents caused by drunken drivers: 0
Fatalities: 1
Persons involved in fatal accidents: 2
Pedestrians involved in fatal accidents: 0
Fatal accident statistics in 2013:
Fatal accident count: 2
Vehicles involved in fatal accidents: 4
Fatal accidents caused by drunken drivers: 0
Fatalities: 2
Persons involved in fatal accidents: 7
Pedestrians involved in fatal accidents: 0
Home Mortgage Disclosure Act Aggregated Statistics For Year 2009 (Based on 4 partial tracts)
A) FHA, FSA/RHS & VA Home Purchase Loans
B) Conventional Home Purchase Loans
C) Refinancings
D) Home Improvement Loans
F) Non-occupant Loans on < 5 Family Dwellings (A B C & D)
G) Loans On Manufactured Home Dwelling (A B C & D)
Number
Average Value
Number
Average Value
Number
Average Value
Number
Average Value
Number
Average Value
Number
Average Value
LOANS ORIGINATED
8
$87,058
8
$114,329
20
$98,035
5
$32,738
7
$99,406
1
$52,740
APPLICATIONS APPROVED, NOT ACCEPTED
1
$54,920
1
$54,370
2
$150,700
1
$68,750
1
$110,600
0
$0
APPLICATIONS DENIED
2
$76,660
1
$111,800
17
$109,623
6
$27,288
1
$50,690
1
$16,070
APPLICATIONS WITHDRAWN
1
$58,290
1
$167,720
8
$96,810
1
$24,170
0
$0
0
$0
FILES CLOSED FOR INCOMPLETENESS
0
$0
0
$0
2
$78,925
1
$49,140
0
$0
0
$0
Aggregated Statistics For Year 2008 (Based on 4 partial tracts)
A) FHA, FSA/RHS & VA Home Purchase Loans
B) Conventional Home Purchase Loans
C) Refinancings
D) Home Improvement Loans
F) Non-occupant Loans on < 5 Family Dwellings (A B C & D)
G) Loans On Manufactured Home Dwelling (A B C & D)
Number
Average Value
Number
Average Value
Number
Average Value
Number
Average Value
Number
Average Value
Number
Average Value
LOANS ORIGINATED
5
$77,904
10
$91,673
21
$84,302
4
$22,290
7
$97,243
1
$73,240
APPLICATIONS APPROVED, NOT ACCEPTED
1
$91,680
1
$76,500
3
$88,050
1
$16,990
0
$0
1
$25,020
APPLICATIONS DENIED
3
$100,473
5
$95,460
28
$90,237
13
$27,438
2
$83,305
2
$34,685
APPLICATIONS WITHDRAWN
1
$64,470
1
$78,190
9
$92,338
2
$58,235
0
$0
0
$0
FILES CLOSED FOR INCOMPLETENESS
1
$115,690
0
$0
2
$81,190
0
$0
0
$0
0
$0
Aggregated Statistics For Year 2007 (Based on 4 partial tracts)
A) FHA, FSA/RHS & VA Home Purchase Loans
B) Conventional Home Purchase Loans
C) Refinancings
D) Home Improvement Loans
F) Non-occupant Loans on < 5 Family Dwellings (A B C & D)
G) Loans On Manufactured Home Dwelling (A B C & D)
Number
Average Value
Number
Average Value
Number
Average Value
Number
Average Value
Number
Average Value
Number
Average Value
LOANS ORIGINATED
5
$72,142
21
$85,298
25
$87,300
12
$26,379
10
$90,610
2
$36,555
APPLICATIONS APPROVED, NOT ACCEPTED
0
$0
6
$69,513
7
$82,930
2
$26,945
1
$92,600
1
$40,020
APPLICATIONS DENIED
0
$0
5
$91,288
42
$87,178
13
$27,143
4
$50,310
2
$57,080
APPLICATIONS WITHDRAWN
1
$45,270
1
$210,500
23
$85,137
2
$47,450
2
$41,650
0
$0
FILES CLOSED FOR INCOMPLETENESS
0
$0
0
$0
3
$127,903
0
$0
0
$0
0
$0
Aggregated Statistics For Year 2006 (Based on 4 partial tracts)
A) FHA, FSA/RHS & VA Home Purchase Loans
B) Conventional Home Purchase Loans
C) Refinancings
D) Home Improvement Loans
F) Non-occupant Loans on < 5 Family Dwellings (A B C & D)
G) Loans On Manufactured Home Dwelling (A B C & D)
Number
Average Value
Number
Average Value
Number
Average Value
Number
Average Value
Number
Average Value
Number
Average Value
LOANS ORIGINATED
5
$91,454
20
$85,024
22
$75,294
14
$27,066
7
$81,714
3
$65,183
APPLICATIONS APPROVED, NOT ACCEPTED
0
$0
4
$59,980
8
$79,165
4
$33,825
2
$52,215
1
$15,370
APPLICATIONS DENIED
1
$70,010
8
$71,141
57
$86,303
16
$48,680
6
$65,985
2
$23,815
APPLICATIONS WITHDRAWN
0
$0
2
$85,175
25
$87,873
4
$68,990
1
$69,400
0
$0
FILES CLOSED FOR INCOMPLETENESS
0
$0
1
$47,060
5
$123,904
0
$0
1
$65,390
0
$0
Aggregated Statistics For Year 2005 (Based on 4 partial tracts)
A) FHA, FSA/RHS & VA Home Purchase Loans
B) Conventional Home Purchase Loans
C) Refinancings
D) Home Improvement Loans
F) Non-occupant Loans on < 5 Family Dwellings (A B C & D)
G) Loans On Manufactured Home Dwelling (A B C & D)
Number
Average Value
Number
Average Value
Number
Average Value
Number
Average Value
Number
Average Value
Number
Average Value
LOANS ORIGINATED
5
$88,242
23
$83,056
30
$74,541
15
$36,452
10
$96,551
2
$54,700
APPLICATIONS APPROVED, NOT ACCEPTED
1
$82,800
4
$66,315
9
$78,833
1
$19,770
1
$49,160
1
$74,590
APPLICATIONS DENIED
1
$41,270
7
$61,876
52
$79,861
17
$32,940
3
$52,063
4
$51,002
APPLICATIONS WITHDRAWN
0
$0
2
$54,310
30
$86,873
2
$130,900
1
$192,850
0
$0
FILES CLOSED FOR INCOMPLETENESS
0
$0
1
$22,310
6
$99,148
1
$30,030
0
$0
0
$0
Aggregated Statistics For Year 2004 (Based on 4 partial tracts)
A) FHA, FSA/RHS & VA Home Purchase Loans
B) Conventional Home Purchase Loans
C) Refinancings
D) Home Improvement Loans
F) Non-occupant Loans on < 5 Family Dwellings (A B C & D)
G) Loans On Manufactured Home Dwelling (A B C & D)
Number
Average Value
Number
Average Value
Number
Average Value
Number
Average Value
Number
Average Value
Number
Average Value
LOANS ORIGINATED
6
$90,372
18
$84,208
40
$81,473
10
$18,576
5
$58,258
1
$78,880
APPLICATIONS APPROVED, NOT ACCEPTED
1
$37,790
3
$40,770
9
$83,580
2
$21,045
1
$29,410
1
$15,420
APPLICATIONS DENIED
1
$101,120
7
$76,660
55
$79,483
17
$25,576
2
$46,740
1
$22,860
APPLICATIONS WITHDRAWN
1
$47,480
2
$76,675
28
$78,633
5
$51,542
1
$26,900
0
$0
FILES CLOSED FOR INCOMPLETENESS
0
$0
1
$147,010
8
$79,714
1
$39,700
0
$0
0
$0
Aggregated Statistics For Year 2003 (Based on 4 partial tracts)
A) FHA, FSA/RHS & VA Home Purchase Loans
B) Conventional Home Purchase Loans
C) Refinancings
D) Home Improvement Loans
F) Non-occupant Loans on < 5 Family Dwellings (A B C & D)
Number
Average Value
Number
Average Value
Number
Average Value
Number
Average Value
Number
Average Value
LOANS ORIGINATED
8
$75,025
27
$80,674
70
$76,507
8
$17,845
7
$63,514
APPLICATIONS APPROVED, NOT ACCEPTED
0
$0
2
$76,090
9
$76,928
2
$9,065
0
$0
APPLICATIONS DENIED
1
$97,890
4
$90,412
53
$75,358
9
$22,858
1
$102,270
APPLICATIONS WITHDRAWN
1
$49,270
3
$62,167
26
$83,996
1
$32,920
1
$53,140
FILES CLOSED FOR INCOMPLETENESS
0
$0
1
$38,700
5
$90,756
0
$0
1
$40,130
Aggregated Statistics For Year 1999 (Based on 1 partial tract)
A) FHA, FSA/RHS & VA Home Purchase Loans
B) Conventional Home Purchase Loans
C) Refinancings
D) Home Improvement Loans
F) Non-occupant Loans on < 5 Family Dwellings (A B C & D)
Detailed PMIC statistics for the following Tracts:4010.01
, 4010.02
2002 - 2018 National Fire Incident Reporting System (NFIRS) incidents
Based on the data from the years 2002 - 2018 the average number of fires per year is 7. The highest number of fires - 14 took place in 2012, and the least - 0 in 2003. The data has a declining trend.
When looking into fire subcategories, the most incidents belonged to: Outside Fires (36.6%), and Structure Fires (30.1%).
Fire incident types reported to NFIRS in Zip Code 14571

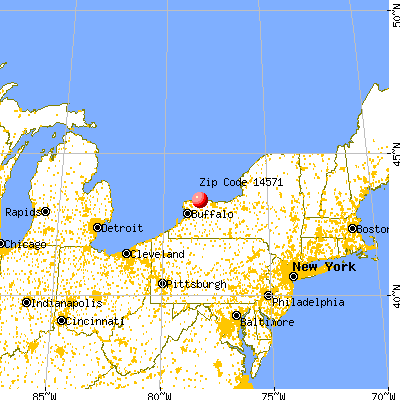


 Nearest zip codes: 14411, 14477, 14479, 14098, 14103, 14476.


 Based on the data from the years 2002 - 2018 the average number of fires per year is 7. The highest number of fires - 14 took place in 2012, and the least - 0 in 2003. The data has a declining trend.
 When looking into fire subcategories, the most incidents belonged to: Outside Fires (36.6%), and Structure Fires (30.1%).