Estimated zip code population in 2022: 12,518 Zip code population in 2010: 10,256 Zip code population in 2000: 6,197
Houses and condos: 5,061 Renter-occupied apartments: 969
% of renters here:
20%
State:
46%
March 2022 cost of living index in zip code 14586: 103.2 (near average, U.S. average is 100)
Land area: 11.1 sq. mi. Water area: 0.2 sq. mi.
Population density: 1,123 people per square mile
(low).
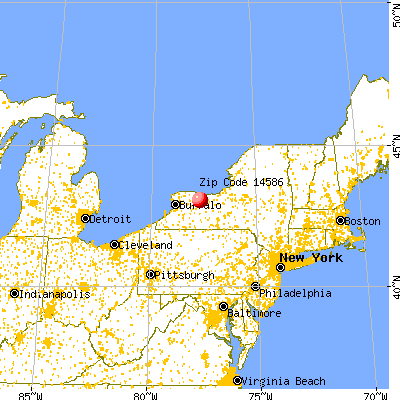
OSM Map
General Map
Google Map
MSN Map
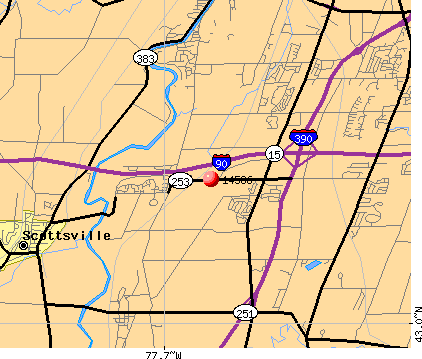
OSM Map
General Map
Google Map
MSN Map
OSM Map
General Map
Google Map
MSN Map
OSM Map
General Map
Google Map
MSN Map
Please wait while loading the map...
Real estate property taxes paid for housing units in 2022:
This zip code:
2.3% ($5,711)
New York:
1.5% ($6,180)
Median real estate property taxes paid for housing units with mortgages in 2022: $5,920 (2.3%) Median real estate property taxes paid for housing units with no mortgage in 2022: $5,011 (2.1%)
Estimated median house/condo value in 2022: $246,224
14586:
$246,224
New York:
$400,400
According to our research of New York and other state lists, there were 5 registered sex offenders living in 14586 zip code as of May 28, 2024. The ratio of all residents to sex offenders in zip code 14586 is 2,286 to 1. The ratio of registered sex offenders to all residents in this zip code is lower than the state average.
Median resident age:
This zip code:
38.9 years
New York median age:
40.0 years
Average household size:
This zip code:
2.6 people
New York:
2.5 people
Averages for the 2020 tax year for zip code 14586, filed in 2021:
Average Adjusted Gross Income (AGI) in 2020: $67,361 (Individual Income Tax Returns)
Here:
$67,361
State:
$90,930
Salary/wage: $62,153 (reported on 87.3% of returns)
Here:
$62,153
State:
$72,104
(% of AGI for various income ranges: 1202.0% for AGIs below $25k, 3659.0% for AGIs $25k-50k, 6924.2% for AGIs $50k-75k, 9651.3% for AGIs $75k-100k, 18912.2% for AGIs $100k-200k, 56643.3% for AGIs over 200k)
Taxable interest for individuals: $650 (reported on 44.5% of returns)
This zip code:
$650
New York:
$3,075
(% of AGI for various income ranges: 9.2% for AGIs below $25k, 15.1% for AGIs $25k-50k, 31.8% for AGIs $50k-75k, 61.1% for AGIs $75k-100k, 94.7% for AGIs $100k-200k, 386.7% for AGIs over 200k)
Ordinary dividends: $2,747 (reported on 20.0% of returns)
Here:
$2,747
State:
$11,095
(% of AGI for various income ranges: 19.7% for AGIs below $25k, 26.8% for AGIs $25k-50k, 55.6% for AGIs $50k-75k, 72.0% for AGIs $75k-100k, 193.0% for AGIs $100k-200k, 1033.3% for AGIs over 200k)
Net capital gain/loss in AGI: +$5,991 (reported on 18.9% of returns)
Here:
+$5,991
State:
+$44,925
(% of AGI for various income ranges: 4.3% for AGIs below $25k, 30.0% for AGIs $25k-50k, 59.5% for AGIs $50k-75k, 126.7% for AGIs $75k-100k, 247.8% for AGIs $100k-200k, 6061.7% for AGIs over 200k)
Profit/loss from business: +$10,006 (reported on 12.4% of returns)
Here:
+$10,006
State:
+$14,940
(% of AGI for various income ranges: 70.5% for AGIs below $25k, 69.8% for AGIs $25k-50k, 144.5% for AGIs $50k-75k, 186.9% for AGIs $75k-100k, 361.1% for AGIs $100k-200k, 2096.7% for AGIs over 200k)
Taxable individual retirement arrangement distribution: $17,488 (reported on 7.9% of returns)
14586:
$17,488
New York:
$19,609
(% of AGI for various income ranges: 53.0% for AGIs below $25k, 94.8% for AGIs $25k-50k, 135.1% for AGIs $50k-75k, 333.5% for AGIs $75k-100k, 539.9% for AGIs $100k-200k)
Self-employed (Keogh) retirement plans: $16,550 (reported on 0.3% of returns)
14586:
$16,550
New York:
$32,497
(% of AGI for various income ranges: 42.4% for AGIs $50k-75k)
Total itemized deductions: $24,569 (reported on 7.3% of returns)
Here:
$24,569
State:
$39,326
(% of AGI for various income ranges: 37.1% for AGIs below $25k, 96.4% for AGIs $25k-50k, 266.0% for AGIs $50k-75k, 435.5% for AGIs $75k-100k, 559.3% for AGIs $100k-200k, 1556.7% for AGIs over 200k)
Charity contributions: $7,425 (reported on 5.2% of returns)
Here:
$7,425
State:
$15,420
(% of AGI for various income ranges: 10.3% for AGIs $25k-50k, 37.3% for AGIs $50k-75k, 77.8% for AGIs $75k-100k, 168.1% for AGIs $100k-200k, 515.0% for AGIs over 200k)
Taxes paid: $8,556 (reported on 7.3% of returns)
14586:
$8,556
State:
$9,183
(% of AGI for various income ranges: 36.8% for AGIs $25k-50k, 107.7% for AGIs $50k-75k, 160.4% for AGIs $75k-100k, 190.8% for AGIs $100k-200k, 508.3% for AGIs over 200k)
Earned income credit: $2,099 (reported on 11.0% of returns)
Here:
$2,099
State:
$2,138
(% of AGI for various income ranges: 58.0% for AGIs below $25k, 62.4% for AGIs $25k-50k, 0.9% for AGIs $50k-75k)
Percentage of individuals using paid preparers for their 2020 taxes: 95.8%
Here:
96%
State:
95%
(% for various income ranges: 95.0% for AGIs below $25k, 96.4% for AGIs $25k-50k, 96.2% for AGIs $50k-75k, 94.8% for AGIs $75k-100k, 95.9% for AGIs $100k-200k, 100.0% for AGIs over 200k)
Averages for the 2012 tax year for zip code 14586, filed in 2013:
Average Adjusted Gross Income (AGI) in 2012: $59,872 (Individual Income Tax Returns)
Here:
$59,872
State:
$77,088
Salary/wage: $54,513 (reported on 90.2% of returns)
Here:
$54,513
State:
$60,593
(% of AGI for various income ranges: 79.4% for AGIs below $25k, 83.0% for AGIs $25k-50k, 82.1% for AGIs $50k-75k, 87.6% for AGIs $75k-100k, 87.7% for AGIs $100k-200k, 46.8% for AGIs over 200k)
Taxable interest for individuals: $539 (reported on 52.2% of returns)
This zip code:
$539
New York:
$3,125
(% of AGI for various income ranges: 0.9% for AGIs below $25k, 0.3% for AGIs $25k-50k, 0.4% for AGIs $50k-75k, 0.4% for AGIs $75k-100k, 0.5% for AGIs $100k-200k, 0.6% for AGIs over 200k)
Ordinary dividends: $1,922 (reported on 21.2% of returns)
Here:
$1,922
State:
$10,299
(% of AGI for various income ranges: 1.3% for AGIs below $25k, 0.7% for AGIs $25k-50k, 0.4% for AGIs $50k-75k, 0.6% for AGIs $75k-100k, 0.7% for AGIs $100k-200k, 0.8% for AGIs over 200k)
Net capital gain/loss in AGI: +$2,382 (reported on 14.8% of returns)
Here:
+$2,382
State:
+$42,474
(% of AGI for various income ranges: 0.1% for AGIs $50k-75k, 0.4% for AGIs $75k-100k, 0.9% for AGIs $100k-200k, 2.3% for AGIs over 200k)
Profit/loss from business: +$7,975 (reported on 11.9% of returns)
Here:
+$7,975
State:
+$16,168
(% of AGI for various income ranges: 3.9% for AGIs below $25k, 2.6% for AGIs $25k-50k, 1.5% for AGIs $50k-75k, 1.3% for AGIs $75k-100k, 1.4% for AGIs $100k-200k)
Taxable individual retirement arrangement distribution: $14,007 (reported on 8.9% of returns)
14586:
$14,007
New York:
$17,621
(% of AGI for various income ranges: 3.5% for AGIs below $25k, 2.4% for AGIs $25k-50k, 2.8% for AGIs $50k-75k, 1.9% for AGIs $75k-100k, 2.0% for AGIs $100k-200k)
Total itemized deductions: $18,906 (20% of AGI, reported on 45.5% of returns)
Here:
$18,906
State:
$34,985
Here:
20.3% of AGI
State:
21.3% of AGI
(% of AGI for various income ranges: 6.7% for AGIs below $25k, 11.7% for AGIs $25k-50k, 15.0% for AGIs $50k-75k, 16.4% for AGIs $75k-100k, 15.2% for AGIs $100k-200k, 14.5% for AGIs over 200k)
Charity contributions: $2,311 (reported on 37.8% of returns)
Here:
$2,311
State:
$5,572
(% of AGI for various income ranges: 0.6% for AGIs below $25k, 1.2% for AGIs $25k-50k, 1.6% for AGIs $50k-75k, 1.7% for AGIs $75k-100k, 1.6% for AGIs $100k-200k, 1.1% for AGIs over 200k)
Taxes paid: $9,231 (reported on 45.3% of returns)
14586:
$9,231
State:
$18,656
(% of AGI for various income ranges: 2.1% for AGIs below $25k, 4.6% for AGIs $25k-50k, 6.5% for AGIs $50k-75k, 8.0% for AGIs $75k-100k, 8.4% for AGIs $100k-200k, 6.7% for AGIs over 200k)
Earned income credit: $1,881 (reported on 9.8% of returns)
Here:
$1,881
State:
$2,230
(% of AGI for various income ranges: 3.3% for AGIs below $25k, 0.9% for AGIs $25k-50k)
Percentage of individuals using paid preparers for their 2012 taxes: 46.6%
Here:
47%
State:
66%
(% for various income ranges: 38.2% for AGIs below $25k, 46.2% for AGIs $25k-50k, 53.6% for AGIs $50k-75k, 48.5% for AGIs $75k-100k, 51.3% for AGIs $100k-200k, 80.0% for AGIs over 200k)
Averages for the 2004 tax year for zip code 14586, filed in 2005:
Average Adjusted Gross Income (AGI) in 2004: $48,802 (Individual Income Tax Returns)
Here:
$48,802
State:
$59,519
Salary/wage: $46,518 (reported on 91.2% of returns)
Here:
$46,518
State:
$50,673
(% of AGI for various income ranges: 122.1% for AGIs below $10k, 76.0% for AGIs $10k-25k, 85.6% for AGIs $25k-50k, 89.1% for AGIs $50k-75k, 91.9% for AGIs $75k-100k, 81.7% for AGIs over 100k)
Taxable interest for individuals: $612 (reported on 62.1% of returns)
This zip code:
$612
New York:
$2,377
(% of AGI for various income ranges: 2.9% for AGIs below $10k, 1.3% for AGIs $10k-25k, 0.8% for AGIs $25k-50k, 0.6% for AGIs $50k-75k, 0.7% for AGIs $75k-100k, 0.8% for AGIs over 100k)
Taxable dividends: $911 (reported on 28.8% of returns)
Here:
$911
State:
$5,394
(% of AGI for various income ranges: 2.4% for AGIs below $10k, 1.2% for AGIs $10k-25k, 0.7% for AGIs $25k-50k, 0.4% for AGIs $50k-75k, 0.3% for AGIs $75k-100k, 0.5% for AGIs over 100k)
Net capital gain/loss: +$2,124 (reported on 19.5% of returns)
Here:
+$2,124
State:
+$23,581
(% of AGI for various income ranges: -2.2% for AGIs below $10k, 1.2% for AGIs $10k-25k, -0.1% for AGIs $25k-50k, 0.5% for AGIs $50k-75k, 0.7% for AGIs $75k-100k, 2.1% for AGIs over 100k)
Profit/loss from business: +$5,498 (reported on 12.6% of returns)
Here:
+$5,498
State:
+$13,809
(% of AGI for various income ranges: 5.5% for AGIs below $10k, 4.1% for AGIs $10k-25k, 2.2% for AGIs $25k-50k, 1.0% for AGIs $50k-75k, 0.9% for AGIs $75k-100k, 1.1% for AGIs over 100k)
IRA payment deduction: $2,268 (reported on 2.6% of returns)
14586:
$2,268
New York:
$3,115
(% of AGI for various income ranges: 0.3% for AGIs $10k-25k, 0.2% for AGIs $25k-50k, 0.1% for AGIs $50k-75k, 0.2% for AGIs $75k-100k)
Total itemized deductions: $15,535 (21% of AGI, reported on 49.6% of returns)
Here:
$15,535
State:
$25,864
Here:
21.2% of AGI
State:
21.9% of AGI
(% of AGI for various income ranges: 9.8% for AGIs below $10k, 9.5% for AGIs $10k-25k, 15.0% for AGIs $25k-50k, 17.5% for AGIs $50k-75k, 17.5% for AGIs $75k-100k, 14.6% for AGIs over 100k)
Charity contributions deductions: $2,137 (3% of AGI, reported on 44.9% of returns)
Here:
$2,137
State:
$4,439
Here:
2.8% of AGI
State:
3.6% of AGI
(% of AGI for various income ranges: 0.4% for AGIs below $10k, 1.2% for AGIs $10k-25k, 1.8% for AGIs $25k-50k, 2.0% for AGIs $50k-75k, 2.3% for AGIs $75k-100k, 2.0% for AGIs over 100k)
Total tax: $6,115 (reported on 80.2% of returns)
14586:
$6,115
State:
$11,730
(% of AGI for various income ranges: 2.4% for AGIs below $10k, 4.4% for AGIs $10k-25k, 7.1% for AGIs $25k-50k, 8.5% for AGIs $50k-75k, 9.7% for AGIs $75k-100k, 15.8% for AGIs over 100k)
Earned income credit: $1,557 (reported on 7.9% of returns)
Here:
$1,557
State:
$1,757
Percentage of individuals using paid preparers for their 2004 taxes: 50.8%
Here:
51%
State:
67%
(% for various income ranges: 41.3% for AGIs below $10k, 51.7% for AGIs $10k-25k, 50.0% for AGIs $25k-50k, 55.6% for AGIs $50k-75k, 53.7% for AGIs $75k-100k, 54.5% for AGIs over 100k)
Household received Food Stamps/SNAP in the past 12 months: 327 Household did not receive Food Stamps/SNAP in the past 12 months: 4,363
Women who had a birth in the past 12 months: 99 (83 now married, 15 unmarried) Women who did not have a birth in the past 12 months: 3,245 (1,344 now married, 1,892 unmarried)
Housing units in zip code 14586 with a mortgage: 2,774 (333 second mortgage, 337 both second mortgage and home equity loan) Median monthly owner costs for units with a mortgage: $1,773 Median monthly owner costs for units without a mortgage: $705
Residents with income below the poverty level in 2022:
This zip code:
11.3%
Whole state:
14.3%
Residents with income below 50% of the poverty level in 2022:
This zip code:
2.7%
Whole state:
6.8%
Median number of rooms in houses and condos:
Here:
6.8
State:
6.3
Median number of rooms in apartments:
Here:
4.2
State:
3.8
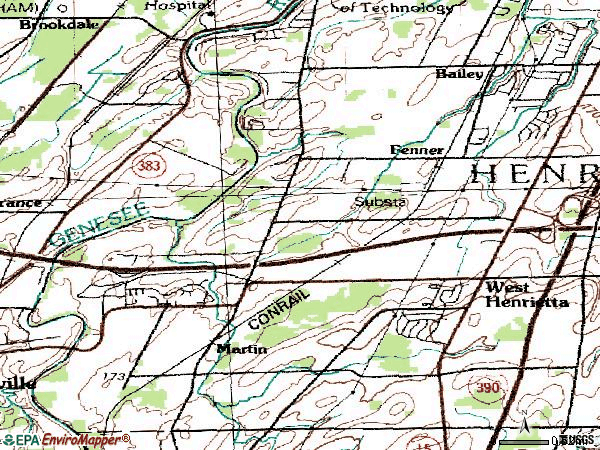
Notable locations in this zip code not listed on our city pages
Notable locations in zip code 14586: Riverton Oaks Golf Course (A), West Henrietta Station (B), Scottsville Rest Stop (C), University Park of Rochester (D), Thruway Industrial Park (E). Display/hide their locations on the map
2,028 married couples with children.
383 single-parent households (163 men, 220 women).
79.3% of residents of 14586 zip code speak English at home.
2.3% of residents speak Spanish at home (41% very well, 7% well, 35% not well, 17% not at all).
9.6% of residents speak other Indo-European language at home (50% very well, 28% well, 9% not well, 13% not at all).
6.3% of residents speak Asian or Pacific Island language at home (66% very well, 6% well, 26% not well, 2% not at all).
1.9% of residents speak other language at home (40% very well, 54% well, 6% not well).
Foreign born population: 2,350 (18.8%) (61.0% of them are naturalized citizens)
This zip code:
18.8%
Whole state:
22.7%
13%Bangladesh
10%Nepal
9%Bhutan
8%Haiti
6%Thailand
5%Kazakhstan
4%Lebanon
10%American
9%German
9%Italian
8%Jamaican
6%English
3%Irish
2%Ukrainian
Year of entry for the foreign-born population
1,4552010 or later
7802000 to 2009
3441990 to 1999
371Before 1990
Facilities with environmental interests located in this zip code:
HAMMER PACKAGING CORP (200 LUCIUS GORDON DR. in WEST HENRIETTA, NY)
AIR MAJOR (AIRS/AFS) AIR SYNTHETIC MINOR (AIRS/AFS) STATE MASTER (New York facility tracking) - AIR PROGRAM, National Pollutant Discharge Elimination System Permit CRITERIA AND HAZARDOUS AIR POLLUTANT INVENTORY (Inventory of air pollution sources) Small Quantity Generators, between 100 kg and 1000 kg of hazardous waste/month (Resource Conservation and Recovery Act (tracking hazardous waste)) - notification TRI REPORTER (Tracking of toxic chemicals releasing facilities) Business SIC classification: COMMERCIAL PRINTING, LITHOGRAPHIC Organizations: HAMMER LITHOGRAPH CORP (AIR FEE BILLING CONTACT)
Alternative names: HAMMER LITHOGRAPH, HAMMER LITHOGRAPH CORP
CORNING INC - MONROE PARK (1175 JOHN ST in WEST HENRIETTA, NY)
STATE MASTER (New York facility tracking) - AIR PROGRAM, HAZARDOUS WASTE PROGRAM Small Quantity Generators, between 100 kg and 1000 kg of hazardous waste/month (Resource Conservation and Recovery Act (tracking hazardous waste)) - notification Business SIC classification: RADIO AND TELEVISION BROADCASTING AND COMMUNICATIONS EQUIPMENT Business NAICS classification: RADIO AND TELEVISION BROADCASTING AND WIRELESS COMMUNICATIONS EQUIPMENT MANUFACTURING. Organizations: ASEA BROWN BOVERI (CONTACT/OWNER)
, ABB KENT TAYLOR (LEGALLY RESPONSIBLE PARTY)
Alternative names: A B B INSTRUMENTATION INC
ALSTOM SIGNALING INC (1025 JOHN ST in WEST HENRIETTA, NY)
Small Quantity Generators, between 100 kg and 1000 kg of hazardous waste/month (Resource Conservation and Recovery Act (tracking hazardous waste)) - notification - ICIS-, ENFORCEMENT/COMPLIANCE ACTIVITY Organizations: HENRIETTA JOHN LLC (CONTACT/OWNER)
Alternative names: ALSTOM SIGNALLING INC
HENRY V. BURGER MS ( in WEST HENRIETTA, NY)
(National Center for Education Statistics) - STATE ID-261701060015 Organizations: RUSH-HENRIETTA CSD (SCHOOL DISTRICT)
ADT 64 (285 THRUWAY PARK DRIVE in WEST HENRIETTA, NY)
(Integrated Compliance Information System) - ICIS-HQ-2002-6000, FORMAL ENFORCEMENT ACTION
ADT 76 (285 THRUWAY PARK DRIVE in WEST HENRIETTA, NY)
(Integrated Compliance Information System) - ICIS-HQ-2002-6000, FORMAL ENFORCEMENT ACTION
GLADSTONES SERVICE (5420 W HENRIETTA RD in WEST HENRIETTA, NY)
(Resource Conservation and Recovery Act (tracking hazardous waste))
COHBER PRESS INCORPORATED (1000 JOHN STREET in WEST HENRIETTA, NY)
Small Quantity Generators, between 100 kg and 1000 kg of hazardous waste/month (Resource Conservation and Recovery Act (tracking hazardous waste)) - notification Organizations: HOWARD C WEBBER (CONTACT/OPERATOR)
A B B INDUSTRIAL SYSTEMS INC (1175-B JOHN ST in WEST HENRIETTA, NY)
Conditionally Exempt Small Quantity Generators, less than 100 kg/month of hazardous waste (Resource Conservation and Recovery Act (tracking hazardous waste)) - notification Organizations: ASEA BROWN BOVERI INC (CONTACT/OWNER)
80.5%Utility gas
14.6%Electricity
3.5%Fuel oil, kerosene, etc.
0.8%Bottled, tank, or LP gas
0.7%No fuel used
Population in 1990: 5,397. Population change in the 1990s: +800 (+14.8%).
Place of birth for U.S.-born residents:
This state: 7,537
Northeast: 612
Midwest: 455
South: 655
West: 445
61% of the 14586 zip code residents lived in the same house 5 years ago. Out of people who lived in different houses, 75% lived in this county. Out of people who lived in different counties, 50% lived in New York.
93% of the 14586 zip code residents lived in the same house 1 year ago. Out of people who lived in different houses, 58% moved from this county. Out of people who lived in different houses, 14% moved from different county within same state. Out of people who lived in different houses, 14% moved from different state. Out of people who lived in different houses, 14% moved from abroad.
Private vs. public school enrollment:
Students in private schools in grades 1 to 8 (elementary and middle school): 70
Here:
4.4%
New York:
15.6%
Students in private schools in grades 9 to 12 (high school): 50
Here:
9.3%
New York:
15.0%
Students in private undergraduate colleges: 1,219
Here:
84.9%
New York:
39.2%
Occupation by median earnings in the past 12 months ($)
100,709Management occupations
86,721Legal occupations
82,864Computer and mathematical occupations
76,283Installation, maintenance, and repair occupations
76,058Health diagnosing and treating practitioners and other technical occupations
75,962Architecture and engineering occupations
Companies with federal contracts located in this zip code:
THE AMERICAN RED CROSS ( in WEST HENRIETTA, NY) : $3,270,698 in 2 contractsfrom 2003 to 2004
$1,722,496 with Department of Veterans Affairs for Other Medical Services. Signed on 2004-09-20. Effective on 2004-10-01. Completion date: 2005-09-30.
$1,548,202, same as above.Signed on 2003-10-01. Completion date: 2004-09-30.
ODYSSEY SOFTWARE, INC (150 LUCIUS GORDON DR in WEST HENRIETTA, NY; small business) : $19,638 in 2 contractsfrom 2004 to 2005
$10,650 with Air Force for ADP Software. Taking place in IL. Signed on 2005-10-01. Completion date: 2006-09-30.
$8,988 with Air Force for Maintenance, Repair and Rebuilding of Equipment -- Automatic Data Processing Equipment (Including Firmware), Software, Supplies and Support Equipment. Signed on 2004-11-17. Completion date: 2004-11-29.
Top industries in this zip code by the number of employees in 2005:
Administrative and Support and Waste Management and Remediation Services: Landscaping Services (over 1000 employees: 1 establishment, 1-4 employees: 6 establishments)
Management of Companies and Enterprises: Corporate, Subsidiary, and Regional Managing Offices (500-999: 2, 20-49: 1)
Health Care and Social Assistance: Blood and Organ Banks (500-999: 1)
Administrative and Support and Waste Management and Remediation Services: Security Systems Services (except Locksmiths) (250-499: 1, 1-4: 2)
Accommodation and Food Services: Hotels (except Casino Hotels) and Motels (100-249: 1)
Finance and Insurance: Insurance Agencies and Brokerages (100-249: 1)
Accommodation and Food Services: Limited-Service Restaurants (50-99: 1, 10-19: 1)
Wholesale Trade: Beer and Ale Merchant Wholesalers (50-99: 1)
People in group quarters in 2010:
385 people in college/university student housing
8 people in residential treatment centers for adults
People in group quarters in 2000:
12 people in homes for the mentally retarded
10 people in other noninstitutional group quarters
Home Mortgage Disclosure Act Aggregated Statistics For Year 2009 (Based on 4 partial tracts)
A) FHA, FSA/RHS & VA Home Purchase Loans
B) Conventional Home Purchase Loans
C) Refinancings
D) Home Improvement Loans
F) Non-occupant Loans on < 5 Family Dwellings (A B C & D)
Number
Average Value
Number
Average Value
Number
Average Value
Number
Average Value
Number
Average Value
LOANS ORIGINATED
169
$155,988
139
$124,780
200
$108,082
50
$17,660
13
$108,950
APPLICATIONS APPROVED, NOT ACCEPTED
14
$161,372
11
$151,662
26
$126,069
4
$15,010
2
$33,330
APPLICATIONS DENIED
20
$151,316
11
$150,191
95
$122,624
29
$12,076
2
$108,095
APPLICATIONS WITHDRAWN
22
$161,609
13
$140,805
59
$129,324
6
$31,065
4
$179,075
FILES CLOSED FOR INCOMPLETENESS
7
$150,820
2
$90,080
26
$99,756
2
$27,025
2
$52,245
Aggregated Statistics For Year 2008 (Based on 4 partial tracts)
A) FHA, FSA/RHS & VA Home Purchase Loans
B) Conventional Home Purchase Loans
C) Refinancings
D) Home Improvement Loans
E) Loans on Dwellings For 5+ Families
F) Non-occupant Loans on < 5 Family Dwellings (A B C & D)
G) Loans On Manufactured Home Dwelling (A B C & D)
Number
Average Value
Number
Average Value
Number
Average Value
Number
Average Value
Number
Average Value
Number
Average Value
Number
Average Value
LOANS ORIGINATED
106
$150,106
223
$127,676
112
$105,025
58
$26,216
2
$2,191,645
8
$92,942
2
$22,520
APPLICATIONS APPROVED, NOT ACCEPTED
5
$176,196
26
$115,931
15
$129,517
9
$17,216
0
$0
4
$56,455
0
$0
APPLICATIONS DENIED
26
$158,394
24
$123,471
130
$126,591
37
$26,985
0
$0
6
$53,407
2
$28,825
APPLICATIONS WITHDRAWN
11
$142,746
10
$165,124
61
$111,050
4
$9,910
0
$0
0
$0
0
$0
FILES CLOSED FOR INCOMPLETENESS
2
$82,875
7
$123,539
14
$87,784
5
$110,618
0
$0
2
$82,875
0
$0
Aggregated Statistics For Year 2007 (Based on 4 partial tracts)
A) FHA, FSA/RHS & VA Home Purchase Loans
B) Conventional Home Purchase Loans
C) Refinancings
D) Home Improvement Loans
E) Loans on Dwellings For 5+ Families
F) Non-occupant Loans on < 5 Family Dwellings (A B C & D)
G) Loans On Manufactured Home Dwelling (A B C & D)
Number
Average Value
Number
Average Value
Number
Average Value
Number
Average Value
Number
Average Value
Number
Average Value
Number
Average Value
LOANS ORIGINATED
52
$147,989
361
$132,315
133
$92,423
51
$27,728
5
$7,927,040
17
$102,177
2
$37,835
APPLICATIONS APPROVED, NOT ACCEPTED
9
$149,132
28
$116,146
26
$90,240
11
$31,918
0
$0
0
$0
0
$0
APPLICATIONS DENIED
5
$172,232
73
$139,905
183
$104,290
46
$18,496
0
$0
15
$79,649
2
$9,010
APPLICATIONS WITHDRAWN
5
$154,578
38
$140,904
119
$110,421
11
$30,930
0
$0
6
$89,407
0
$0
FILES CLOSED FOR INCOMPLETENESS
0
$0
13
$120,846
21
$111,889
0
$0
0
$0
0
$0
0
$0
Aggregated Statistics For Year 2006 (Based on 4 partial tracts)
A) FHA, FSA/RHS & VA Home Purchase Loans
B) Conventional Home Purchase Loans
C) Refinancings
D) Home Improvement Loans
E) Loans on Dwellings For 5+ Families
F) Non-occupant Loans on < 5 Family Dwellings (A B C & D)
Number
Average Value
Number
Average Value
Number
Average Value
Number
Average Value
Number
Average Value
Number
Average Value
LOANS ORIGINATED
47
$125,059
284
$110,708
201
$87,370
71
$21,349
2
$10,937,515
29
$79,911
APPLICATIONS APPROVED, NOT ACCEPTED
4
$121,222
38
$127,290
39
$100,485
14
$14,541
0
$0
2
$101,790
APPLICATIONS DENIED
4
$118,905
50
$110,373
296
$102,277
89
$45,840
0
$0
8
$132,675
APPLICATIONS WITHDRAWN
2
$94,585
30
$114,056
149
$93,134
17
$28,476
0
$0
4
$141,875
FILES CLOSED FOR INCOMPLETENESS
0
$0
11
$83,856
33
$133,910
4
$65,758
0
$0
4
$43,238
Aggregated Statistics For Year 2005 (Based on 4 partial tracts)
A) FHA, FSA/RHS & VA Home Purchase Loans
B) Conventional Home Purchase Loans
C) Refinancings
D) Home Improvement Loans
E) Loans on Dwellings For 5+ Families
F) Non-occupant Loans on < 5 Family Dwellings (A B C & D)
G) Loans On Manufactured Home Dwelling (A B C & D)
Number
Average Value
Number
Average Value
Number
Average Value
Number
Average Value
Number
Average Value
Number
Average Value
Number
Average Value
LOANS ORIGINATED
47
$129,819
386
$113,183
246
$88,597
73
$25,166
0
$0
36
$81,191
4
$61,705
APPLICATIONS APPROVED, NOT ACCEPTED
2
$123,410
34
$104,833
38
$76,846
18
$18,855
0
$0
2
$162,895
0
$0
APPLICATIONS DENIED
4
$98,188
42
$106,537
226
$106,079
54
$26,672
2
$9,010
11
$32,529
0
$0
APPLICATIONS WITHDRAWN
2
$111,700
22
$135,676
114
$96,036
18
$79,171
0
$0
5
$158,902
2
$82,875
FILES CLOSED FOR INCOMPLETENESS
0
$0
8
$104,949
58
$122,353
0
$0
0
$0
0
$0
0
$0
Aggregated Statistics For Year 2004 (Based on 4 partial tracts)
A) FHA, FSA/RHS & VA Home Purchase Loans
B) Conventional Home Purchase Loans
C) Refinancings
D) Home Improvement Loans
F) Non-occupant Loans on < 5 Family Dwellings (A B C & D)
G) Loans On Manufactured Home Dwelling (A B C & D)
Number
Average Value
Number
Average Value
Number
Average Value
Number
Average Value
Number
Average Value
Number
Average Value
LOANS ORIGINATED
98
$120,538
317
$114,722
271
$85,238
41
$25,881
11
$84,972
2
$18,915
APPLICATIONS APPROVED, NOT ACCEPTED
2
$183,765
38
$121,134
58
$92,357
14
$27,667
0
$0
2
$61,255
APPLICATIONS DENIED
6
$104,437
25
$113,645
200
$110,714
50
$44,506
13
$67,768
5
$137,642
APPLICATIONS WITHDRAWN
2
$141,425
15
$114,557
174
$98,959
14
$28,954
4
$79,720
0
$0
FILES CLOSED FOR INCOMPLETENESS
0
$0
9
$130,316
53
$101,765
11
$44,544
2
$45,040
0
$0
Aggregated Statistics For Year 2003 (Based on 4 partial tracts)
A) FHA, FSA/RHS & VA Home Purchase Loans
B) Conventional Home Purchase Loans
C) Refinancings
D) Home Improvement Loans
E) Loans on Dwellings For 5+ Families
F) Non-occupant Loans on < 5 Family Dwellings (A B C & D)
Number
Average Value
Number
Average Value
Number
Average Value
Number
Average Value
Number
Average Value
Number
Average Value
LOANS ORIGINATED
87
$119,203
306
$112,990
610
$88,713
43
$14,721
2
$10,845,630
15
$93,762
APPLICATIONS APPROVED, NOT ACCEPTED
4
$96,835
35
$100,181
82
$89,370
19
$15,092
0
$0
0
$0
APPLICATIONS DENIED
7
$110,670
13
$88,151
257
$89,044
35
$23,631
0
$0
7
$65,887
APPLICATIONS WITHDRAWN
4
$101,790
23
$116,947
144
$96,261
13
$14,218
0
$0
0
$0
FILES CLOSED FOR INCOMPLETENESS
4
$111,700
4
$143,228
28
$94,586
5
$48,282
0
$0
0
$0
Aggregated Statistics For Year 2002 (Based on 4 partial tracts)
A) FHA, FSA/RHS & VA Home Purchase Loans
B) Conventional Home Purchase Loans
C) Refinancings
D) Home Improvement Loans
F) Non-occupant Loans on < 5 Family Dwellings (A B C & D)
Number
Average Value
Number
Average Value
Number
Average Value
Number
Average Value
Number
Average Value
LOANS ORIGINATED
86
$110,584
275
$99,431
397
$81,148
56
$15,971
7
$89,823
APPLICATIONS APPROVED, NOT ACCEPTED
4
$83,325
37
$83,927
81
$85,363
11
$13,215
5
$63,776
APPLICATIONS DENIED
2
$80,170
20
$89,720
163
$87,054
15
$20,947
9
$61,654
APPLICATIONS WITHDRAWN
4
$127,190
23
$127,130
131
$89,709
7
$46,584
0
$0
FILES CLOSED FOR INCOMPLETENESS
2
$125,210
5
$149,532
33
$82,802
2
$18,015
0
$0
Aggregated Statistics For Year 2001 (Based on 4 partial tracts)
A) FHA, FSA/RHS & VA Home Purchase Loans
B) Conventional Home Purchase Loans
C) Refinancings
D) Home Improvement Loans
F) Non-occupant Loans on < 5 Family Dwellings (A B C & D)
Number
Average Value
Number
Average Value
Number
Average Value
Number
Average Value
Number
Average Value
LOANS ORIGINATED
106
$102,637
321
$91,282
272
$83,115
51
$14,142
12
$72,118
APPLICATIONS APPROVED, NOT ACCEPTED
0
$0
14
$111,571
29
$64,050
9
$10,128
2
$52,245
APPLICATIONS DENIED
11
$99,579
30
$77,115
183
$72,526
42
$18,364
2
$8,035
APPLICATIONS WITHDRAWN
7
$132,289
17
$117,986
126
$85,765
9
$14,212
2
$61,255
FILES CLOSED FOR INCOMPLETENESS
4
$103,142
4
$95,568
17
$75,701
0
$0
0
$0
Aggregated Statistics For Year 2000 (Based on 4 partial tracts)
A) FHA, FSA/RHS & VA Home Purchase Loans
B) Conventional Home Purchase Loans
C) Refinancings
D) Home Improvement Loans
F) Non-occupant Loans on < 5 Family Dwellings (A B C & D)
Number
Average Value
Number
Average Value
Number
Average Value
Number
Average Value
Number
Average Value
LOANS ORIGINATED
82
$99,198
226
$91,774
89
$66,921
35
$10,433
6
$71,198
APPLICATIONS APPROVED, NOT ACCEPTED
2
$130,740
9
$84,074
36
$78,091
22
$10,679
0
$0
APPLICATIONS DENIED
11
$85,495
16
$77,581
129
$57,804
32
$22,755
0
$0
APPLICATIONS WITHDRAWN
2
$105,395
11
$120,052
72
$68,081
2
$13,510
2
$90,080
FILES CLOSED FOR INCOMPLETENESS
2
$53,145
4
$122,058
11
$98,179
2
$9,010
0
$0
Aggregated Statistics For Year 1999 (Based on 2 partial tracts)
A) FHA, FSA/RHS & VA Home Purchase Loans
B) Conventional Home Purchase Loans
C) Refinancings
D) Home Improvement Loans
F) Non-occupant Loans on < 5 Family Dwellings (A B C & D)
Detailed PMIC statistics for the following Tracts:0131.03
, 0132.02
2004 - 2018 National Fire Incident Reporting System (NFIRS) incidents
Based on the data from the years 2004 - 2018 the average number of fires per year is 21. The highest number of fires - 35 took place in 2007, and the least - 1 in 2009. The data has a rising trend.
When looking into fire subcategories, the most incidents belonged to: Structure Fires (39.8%), and Outside Fires (35.3%).
Fire incident types reported to NFIRS in Zip Code 14586


 Nearest zip codes: 14543, 14623, 14467, 14546, 14624, 14619.


 Based on the data from the years 2004 - 2018 the average number of fires per year is 21. The highest number of fires - 35 took place in 2007, and the least - 1 in 2009. The data has a rising trend.
 When looking into fire subcategories, the most incidents belonged to: Structure Fires (39.8%), and Outside Fires (35.3%).