Estimated zip code population in 2022: 3,019 Zip code population in 2010: 3,483 Zip code population in 2000: 3,938
Houses and condos: 1,346 Renter-occupied apartments: 215
% of renters here:
17%
State:
31%
March 2022 cost of living index in zip code 15052: 88.9 (less than average, U.S. average is 100)
Land area: 17.4 sq. mi. Water area: 0.1 sq. mi.
Population density: 173 people per square mile
(very low).
OSM Map
General Map
Google Map
MSN Map
OSM Map
General Map
Google Map
MSN Map
OSM Map
General Map
Google Map
MSN Map
OSM Map
General Map
Google Map
MSN Map
Please wait while loading the map...
Real estate property taxes paid for housing units in 2022:
This zip code:
1.1% ($2,042)
Pennsylvania:
1.3% ($3,094)
Median real estate property taxes paid for housing units with mortgages in 2022: $2,291 (1.2%) Median real estate property taxes paid for housing units with no mortgage in 2022: $1,606 (0.9%)
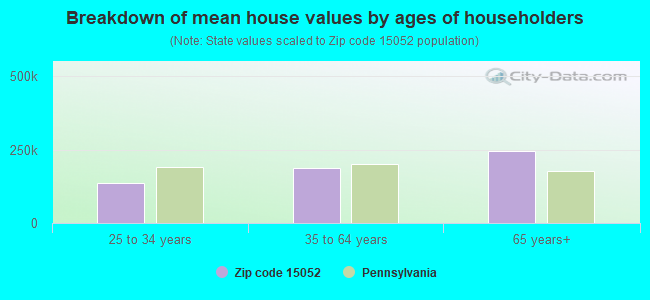
Estimated median house/condo value in 2022: $182,985
15052:
$182,985
Pennsylvania:
$245,500
According to our research of Pennsylvania and other state lists, there were 2 registered sex offenders living in 15052 zip code as of May 20, 2024. The ratio of all residents to sex offenders in zip code 15052 is 1,748 to 1. The ratio of registered sex offenders to all residents in this zip code is much lower than the state average.
Median resident age:
This zip code:
42.6 years
Pennsylvania median age:
40.9 years
Average household size:
This zip code:
2.3 people
Pennsylvania:
2.4 people
Averages for the 2020 tax year for zip code 15052, filed in 2021:
Average Adjusted Gross Income (AGI) in 2020: $57,999 (Individual Income Tax Returns)
Here:
$57,999
State:
$75,707
Salary/wage: $52,291 (reported on 80.4% of returns)
Here:
$52,291
State:
$62,806
(% of AGI for various income ranges: 963.4% for AGIs below $25k, 3152.6% for AGIs $25k-50k, 5622.5% for AGIs $50k-75k, 8206.5% for AGIs $75k-100k, 14335.0% for AGIs $100k-200k)
Taxable interest for individuals: $661 (reported on 29.2% of returns)
This zip code:
$661
Pennsylvania:
$1,633
(% of AGI for various income ranges: 19.4% for AGIs below $25k, 15.3% for AGIs $25k-50k, 25.0% for AGIs $50k-75k, 25.9% for AGIs $75k-100k, 58.9% for AGIs $100k-200k)
Ordinary dividends: $2,463 (reported on 16.1% of returns)
Here:
$2,463
State:
$7,382
(% of AGI for various income ranges: 29.1% for AGIs below $25k, 19.1% for AGIs $25k-50k, 58.3% for AGIs $50k-75k, 32.4% for AGIs $75k-100k, 173.3% for AGIs $100k-200k)
Net capital gain/loss in AGI: +$5,452 (reported on 12.5% of returns)
Here:
+$5,452
State:
+$23,522
(% of AGI for various income ranges: 9.4% for AGIs below $25k, 16.8% for AGIs $25k-50k, 22.5% for AGIs $50k-75k, 71.8% for AGIs $75k-100k, 490.0% for AGIs $100k-200k)
Profit/loss from business: +$5,871 (reported on 8.3% of returns)
Here:
+$5,871
State:
+$16,274
(% of AGI for various income ranges: 72.5% for AGIs below $25k, 91.7% for AGIs $50k-75k, 131.2% for AGIs $75k-100k, 81.7% for AGIs $100k-200k)
Taxable individual retirement arrangement distribution: $14,291 (reported on 13.1% of returns)
15052:
$14,291
Pennsylvania:
$18,583
(% of AGI for various income ranges: 116.3% for AGIs below $25k, 148.2% for AGIs $25k-50k, 244.2% for AGIs $50k-75k, 440.6% for AGIs $75k-100k, 518.3% for AGIs $100k-200k)
Total itemized deductions: $25,900 (reported on 1.8% of returns)
Here:
$25,900
State:
$34,850
(% of AGI for various income ranges: 323.8% for AGIs $50k-75k)
Taxes paid: $5,900 (reported on 1.8% of returns)
15052:
$5,900
State:
$8,200
(% of AGI for various income ranges: 73.8% for AGIs $50k-75k)
Earned income credit: $2,029 (reported on 10.1% of returns)
Here:
$2,029
State:
$2,100
(% of AGI for various income ranges: 51.9% for AGIs below $25k, 52.6% for AGIs $25k-50k)
Percentage of individuals using paid preparers for their 2020 taxes: 94.0%
Here:
94%
State:
92%
(% for various income ranges: 91.7% for AGIs below $25k, 92.7% for AGIs $25k-50k, 96.7% for AGIs $50k-75k, 95.5% for AGIs $75k-100k, 96.0% for AGIs $100k-200k, 100.0% for AGIs over 200k)
Averages for the 2012 tax year for zip code 15052, filed in 2013:
Average Adjusted Gross Income (AGI) in 2012: $48,501 (Individual Income Tax Returns)
Here:
$48,501
State:
$61,346
Salary/wage: $45,042 (reported on 82.0% of returns)
Here:
$45,042
State:
$51,902
(% of AGI for various income ranges: 65.0% for AGIs below $25k, 77.3% for AGIs $25k-50k, 79.9% for AGIs $50k-75k, 76.4% for AGIs $75k-100k, 75.9% for AGIs $100k-200k)
Taxable interest for individuals: $900 (reported on 33.1% of returns)
This zip code:
$900
Pennsylvania:
$1,588
(% of AGI for various income ranges: 1.1% for AGIs below $25k, 0.4% for AGIs $25k-50k, 0.4% for AGIs $50k-75k, 1.2% for AGIs $75k-100k, 0.4% for AGIs $100k-200k)
Ordinary dividends: $1,335 (reported on 18.0% of returns)
Here:
$1,335
State:
$5,827
(% of AGI for various income ranges: 1.8% for AGIs below $25k, 0.4% for AGIs $25k-50k, 0.4% for AGIs $50k-75k, 0.3% for AGIs $75k-100k, 0.4% for AGIs $100k-200k)
Profit/loss from business: +$5,831 (reported on 9.3% of returns)
Here:
+$5,831
State:
+$16,268
(% of AGI for various income ranges: 2.7% for AGIs below $25k, 2.0% for AGIs $25k-50k, 0.6% for AGIs $50k-75k, 2.0% for AGIs $75k-100k)
Taxable individual retirement arrangement distribution: $10,765 (reported on 11.6% of returns)
15052:
$10,765
Pennsylvania:
$14,550
(% of AGI for various income ranges: 4.8% for AGIs below $25k, 2.4% for AGIs $25k-50k, 2.2% for AGIs $50k-75k, 6.4% for AGIs $75k-100k)
Total itemized deductions: $15,260 (17% of AGI, reported on 20.3% of returns)
Here:
$15,260
State:
$23,538
Here:
17.3% of AGI
State:
18.4% of AGI
(% of AGI for various income ranges: 4.0% for AGIs below $25k, 4.2% for AGIs $25k-50k, 4.7% for AGIs $50k-75k, 7.9% for AGIs $75k-100k, 8.7% for AGIs $100k-200k)
Charity contributions: $2,872 (reported on 14.5% of returns)
Here:
$2,872
State:
$4,025
(% of AGI for various income ranges: 0.6% for AGIs $25k-50k, 0.7% for AGIs $50k-75k, 1.0% for AGIs $75k-100k, 1.3% for AGIs $100k-200k)
Taxes paid: $5,883 (reported on 20.3% of returns)
15052:
$5,883
State:
$9,982
(% of AGI for various income ranges: 0.8% for AGIs below $25k, 1.2% for AGIs $25k-50k, 1.6% for AGIs $50k-75k, 2.7% for AGIs $75k-100k, 4.2% for AGIs $100k-200k)
Earned income credit: $2,109 (reported on 12.8% of returns)
Here:
$2,109
State:
$2,106
(% of AGI for various income ranges: 4.4% for AGIs below $25k, 0.8% for AGIs $25k-50k)
Percentage of individuals using paid preparers for their 2012 taxes: 54.7%
Here:
55%
State:
53%
(% for various income ranges: 51.6% for AGIs below $25k, 55.8% for AGIs $25k-50k, 56.7% for AGIs $50k-75k, 61.1% for AGIs $75k-100k, 52.6% for AGIs $100k-200k)
Averages for the 2004 tax year for zip code 15052, filed in 2005:
Average Adjusted Gross Income (AGI) in 2004: $38,001 (Individual Income Tax Returns)
Here:
$38,001
State:
$48,049
Salary/wage: $36,566 (reported on 83.5% of returns)
Here:
$36,566
State:
$42,646
(% of AGI for various income ranges: 76.1% for AGIs below $10k, 66.0% for AGIs $10k-25k, 82.1% for AGIs $25k-50k, 84.7% for AGIs $50k-75k, 85.8% for AGIs $75k-100k, 72.3% for AGIs over 100k)
Taxable interest for individuals: $983 (reported on 46.8% of returns)
This zip code:
$983
Pennsylvania:
$1,657
(% of AGI for various income ranges: 4.9% for AGIs below $10k, 2.7% for AGIs $10k-25k, 0.9% for AGIs $25k-50k, 0.9% for AGIs $50k-75k, 1.3% for AGIs $75k-100k, 0.5% for AGIs over 100k)
Taxable dividends: $1,313 (reported on 22.5% of returns)
Here:
$1,313
State:
$3,566
(% of AGI for various income ranges: 2.7% for AGIs below $10k, 0.9% for AGIs $10k-25k, 0.7% for AGIs $25k-50k, 0.4% for AGIs $50k-75k, 0.5% for AGIs $75k-100k, 1.5% for AGIs over 100k)
Net capital gain/loss: +$515 (reported on 14.9% of returns)
Here:
+$515
State:
+$9,716
(% of AGI for various income ranges: -2.8% for AGIs below $10k, 0.2% for AGIs $10k-25k, -0.1% for AGIs $25k-50k, 0.1% for AGIs $50k-75k, 0.1% for AGIs $75k-100k, 1.6% for AGIs over 100k)
Profit/loss from business: +$5,687 (reported on 11.3% of returns)
Here:
+$5,687
State:
+$14,267
(% of AGI for various income ranges: 4.9% for AGIs below $10k, 3.9% for AGIs $10k-25k, 2.3% for AGIs $25k-50k, 0.7% for AGIs $50k-75k, 0.5% for AGIs $75k-100k, 2.1% for AGIs over 100k)
IRA payment deduction: $2,700 (reported on 2.3% of returns)
15052:
$2,700
Pennsylvania:
$2,903
Total itemized deductions: $13,217 (20% of AGI, reported on 23.1% of returns)
Here:
$13,217
State:
$18,804
Here:
19.8% of AGI
State:
19.5% of AGI
(% of AGI for various income ranges: 6.2% for AGIs $10k-25k, 6.6% for AGIs $25k-50k, 9.4% for AGIs $50k-75k, 8.6% for AGIs $75k-100k, 9.6% for AGIs over 100k)
Charity contributions deductions: $2,378 (3% of AGI, reported on 19.5% of returns)
Here:
$2,378
State:
$3,337
Here:
3.4% of AGI
State:
3.3% of AGI
(% of AGI for various income ranges: 0.5% for AGIs $10k-25k, 0.8% for AGIs $25k-50k, 1.3% for AGIs $50k-75k, 1.4% for AGIs $75k-100k, 2.0% for AGIs over 100k)
Total tax: $4,615 (reported on 75.7% of returns)
15052:
$4,615
State:
$8,008
(% of AGI for various income ranges: 2.6% for AGIs below $10k, 4.1% for AGIs $10k-25k, 6.6% for AGIs $25k-50k, 8.5% for AGIs $50k-75k, 11.2% for AGIs $75k-100k, 17.0% for AGIs over 100k)
Earned income credit: $1,455 (reported on 12.4% of returns)
Here:
$1,455
State:
$1,643
Percentage of individuals using paid preparers for their 2004 taxes: 57.5%
Here:
57%
State:
56%
(% for various income ranges: 47.5% for AGIs below $10k, 58.4% for AGIs $10k-25k, 59.7% for AGIs $25k-50k, 61.1% for AGIs $50k-75k, 62.4% for AGIs $75k-100k, 61.6% for AGIs over 100k)
Household received Food Stamps/SNAP in the past 12 months: 158 Household did not receive Food Stamps/SNAP in the past 12 months: 1,139
Women who had a birth in the past 12 months: 23 (25 now married, 0 unmarried) Women who did not have a birth in the past 12 months: 619 (221 now married, 399 unmarried)
Housing units in zip code 15052 with a mortgage: 629 (66 second mortgage, 10 home equity loan, 55 both second mortgage and home equity loan) Houses without a mortgage: 87
Median monthly owner costs for units with a mortgage: $1,191 Median monthly owner costs for units without a mortgage: $530
Residents with income below the poverty level in 2022:
This zip code:
10.5%
Whole state:
11.8%
Residents with income below 50% of the poverty level in 2022:
This zip code:
5.7%
Whole state:
6.1%
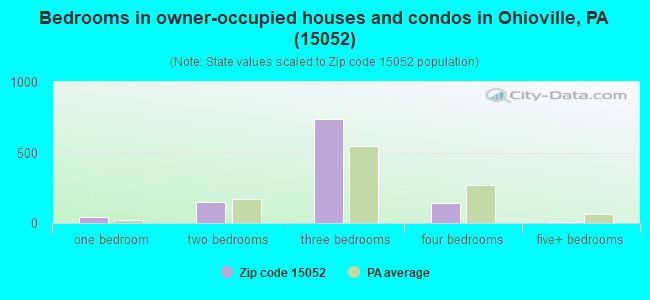
Median number of rooms in houses and condos:
Here:
6.3
State:
6.8
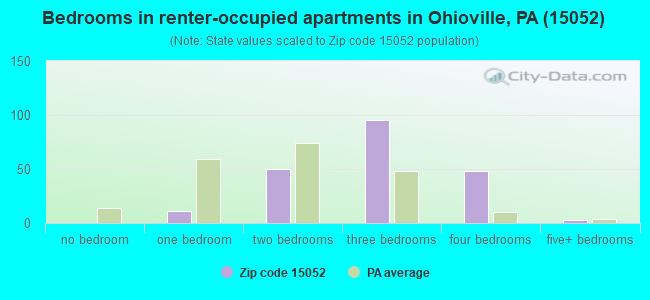
Median number of rooms in apartments:
Here:
5.7
State:
4.3
Notable locations in this zip code not listed on our city pages
Notable locations in zip code 15052: Ohio View Public Golf Course (A), Industry Borough Volunteer Fire Department Station 97 (B), Ohioville Borough Volunteer Fire Department Station 39 (C). Display/hide their locations on the map
316 married couples with children.
208 single-parent households (99 men, 109 women).
96.7% of residents of 15052 zip code speak English at home.
1.0% of residents speak Spanish at home (79% very well, 21% well).
1.7% of residents speak other Indo-European language at home (82% very well, 8% well, 10% not well).
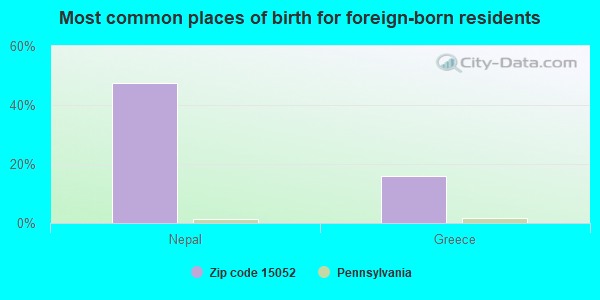
Foreign born population: 19 (0.7%) (74.5% of them are naturalized citizens)
This zip code:
0.7%
Whole state:
7.5%
47%Nepal
16%Greece
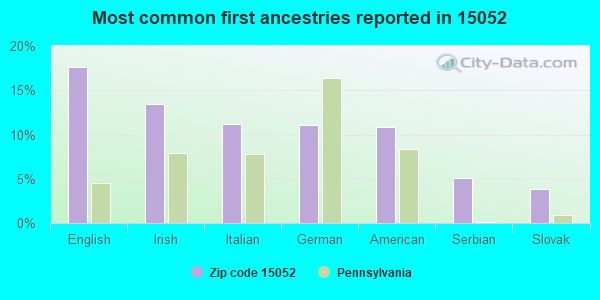
18%English
13%Irish
11%Italian
11%German
11%American
5%Serbian
4%Slovak
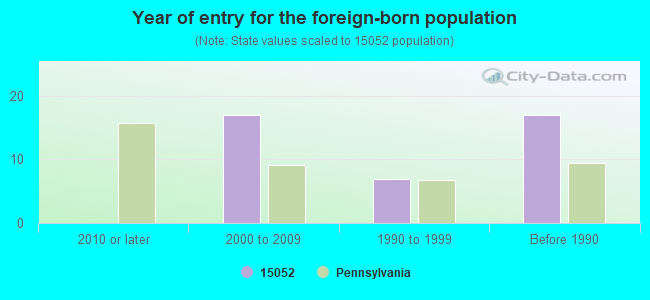
Year of entry for the foreign-born population
02010 or later
172000 to 2009
71990 to 1999
17Before 1990
Facilities with environmental interests located in this zip code:
ARROW TERM LP/INDUSTRY TERM LOT 2 (2341 MIDLAND BEAVER RD in INDUSTRY, PA)
AIR MINOR (AIRS/AFS) Business SIC classification: GENERAL WAREHOUSING AND STORAGE
ARROW TERMINAL LOT 1 (2701 MIDLAND BEAVER RD in INDUSTRY, PA)
AIR MINOR (AIRS/AFS) Business SIC classification: TERMINAL AND JOINT TERMINAL MAINTENANCE FACILITIES FOR MOTOR FREIGHT TRANSPORTATION Alternative names: ARROW TERMINALS LP/INDUSTRY TERMINAL, TAJON WAREHOUSE CORPORATION ARROW TERM
AIR MINOR (AIRS/AFS) Business SIC classification: ARRANGEMENT OF TRANSPORTATION OF FREIGHT AND CARGO
AT & T - FAIRVIEW (OFF RT 68 ON TUSKA RD 3 MI N in INDUSTRY, PA)
(Resource Conservation and Recovery Act (tracking hazardous waste))
Housing units lacking complete plumbing facilities: 0.8% Housing units lacking complete kitchen facilities: 2.0%
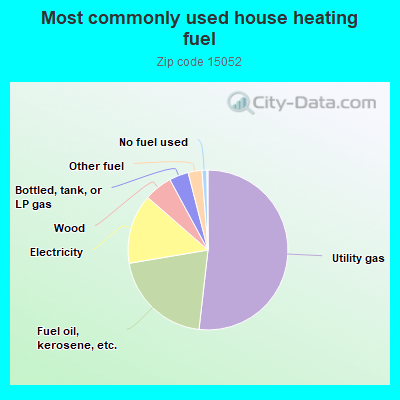
51.9%Utility gas
20.6%Fuel oil, kerosene, etc.
14.1%Electricity
5.7%Wood
3.9%Bottled, tank, or LP gas
2.8%Other fuel
1.0%No fuel used
Population in 1990: 2,908. Population change in the 1990s: +1,030 (+35.4%).
Place of birth for U.S.-born residents:
This state: 2,328
Northeast: 67
Midwest: 211
South: 305
West: 54
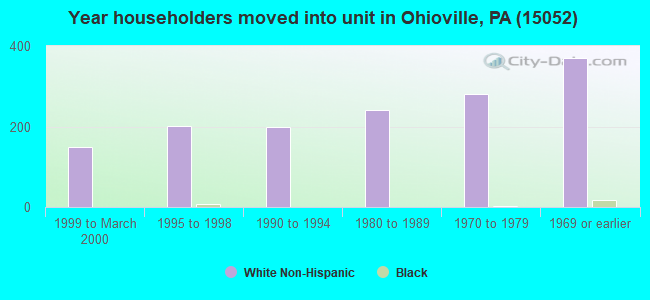
78% of the 15052 zip code residents lived in the same house 5 years ago. Out of people who lived in different houses, 73% lived in this county. Out of people who lived in different counties, 50% lived in Pennsylvania.
95% of the 15052 zip code residents lived in the same house 1 year ago. Out of people who lived in different houses, 62% moved from this county. Out of people who lived in different houses, 27% moved from different county within same state. Out of people who lived in different houses, 12% moved from different state.
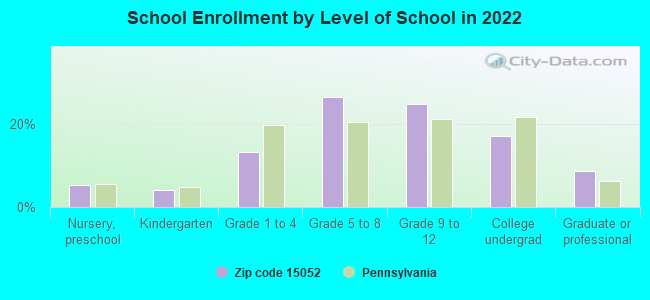
Private vs. public school enrollment:
Students in private schools in grades 1 to 8 (elementary and middle school): 11
Here:
4.5%
Pennsylvania:
15.7%
Students in private schools in grades 9 to 12 (high school):
Here:
0.6%
Pennsylvania:
13.4%
Students in private undergraduate colleges: 28
Here:
25.7%
Pennsylvania:
39.8%
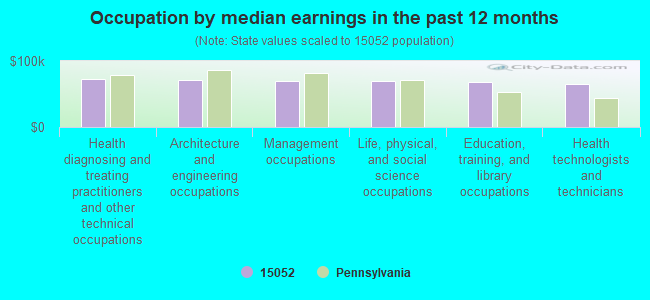
Occupation by median earnings in the past 12 months ($)
72,443Health diagnosing and treating practitioners and other technical occupations
71,253Architecture and engineering occupations
69,776Management occupations
69,370Life, physical, and social science occupations
67,554Education, training, and library occupations
65,139Health technologists and technicians
Top industries in this zip code by the number of employees in 2005:
Accommodation and Food Services: Full-Service Restaurants (50-99 employees: 1 establishment)
Other Services (except Public Administration): Religious Organizations (20-49: 1, 10-19: 1)
Educational Services: Fine Arts Schools (20-49: 1)
Construction: Site Preparation Contractors (10-19: 1)
Health Care and Social Assistance: Residential Mental Retardation Facilities (10-19: 1)
Arts, Entertainment, and Recreation: Golf Courses and Country Clubs (5-9: 1, 1-4: 1)
Other Services (except Public Administration): Civic and Social Organizations (5-9: 1)
People in group quarters in 2010:
8 people in group homes intended for adults
People in group quarters in 2000:
23 people in other noninstitutional group quarters
7 people in schools, hospitals, or wards for the intellectually disabled
Fatal accident statistics in 2014:
Fatal accident count: 1
Vehicles involved in fatal accidents: 1
Fatal accidents caused by drunken drivers: 0
Fatalities: 1
Persons involved in fatal accidents: 1
Pedestrians involved in fatal accidents: 0
Home Mortgage Disclosure Act Aggregated Statistics For Year 2009 (Based on 4 partial tracts)
A) FHA, FSA/RHS & VA Home Purchase Loans
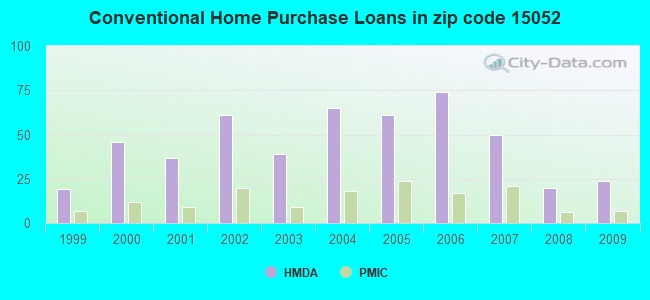
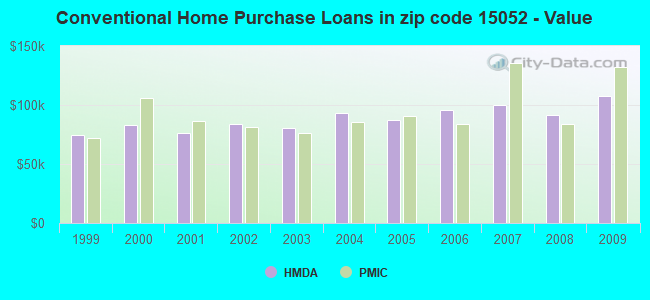
B) Conventional Home Purchase Loans
C) Refinancings
D) Home Improvement Loans
F) Non-occupant Loans on < 5 Family Dwellings (A B C & D)
G) Loans On Manufactured Home Dwelling (A B C & D)
Number
Average Value
Number
Average Value
Number
Average Value
Number
Average Value
Number
Average Value
Number
Average Value
LOANS ORIGINATED
13
$101,238
24
$107,615
73
$126,164
9
$28,707
6
$65,203
4
$92,692
APPLICATIONS APPROVED, NOT ACCEPTED
2
$91,315
1
$157,440
5
$74,954
2
$77,305
0
$0
1
$111,780
APPLICATIONS DENIED
4
$67,700
4
$88,995
48
$108,049
2
$45,660
1
$55,100
3
$47,813
APPLICATIONS WITHDRAWN
2
$65,485
3
$70,483
18
$130,529
2
$19,715
0
$0
2
$132,800
FILES CLOSED FOR INCOMPLETENESS
0
$0
0
$0
3
$104,030
0
$0
0
$0
1
$85,800
Aggregated Statistics For Year 2008 (Based on 4 partial tracts)
A) FHA, FSA/RHS & VA Home Purchase Loans
B) Conventional Home Purchase Loans
C) Refinancings
D) Home Improvement Loans
F) Non-occupant Loans on < 5 Family Dwellings (A B C & D)
G) Loans On Manufactured Home Dwelling (A B C & D)
Number
Average Value
Number
Average Value
Number
Average Value
Number
Average Value
Number
Average Value
Number
Average Value
LOANS ORIGINATED
12
$111,562
20
$91,876
62
$115,314
12
$31,124
1
$17,320
3
$71,373
APPLICATIONS APPROVED, NOT ACCEPTED
2
$101,780
6
$77,928
6
$94,333
3
$34,650
0
$0
0
$0
APPLICATIONS DENIED
2
$48,415
2
$41,365
81
$120,050
5
$24,876
5
$62,488
2
$39,360
APPLICATIONS WITHDRAWN
1
$66,910
0
$0
20
$124,910
2
$30,770
0
$0
0
$0
FILES CLOSED FOR INCOMPLETENESS
0
$0
0
$0
8
$139,799
3
$15,780
0
$0
0
$0
Aggregated Statistics For Year 2007 (Based on 4 partial tracts)
A) FHA, FSA/RHS & VA Home Purchase Loans
B) Conventional Home Purchase Loans
C) Refinancings
D) Home Improvement Loans
F) Non-occupant Loans on < 5 Family Dwellings (A B C & D)
G) Loans On Manufactured Home Dwelling (A B C & D)
Number
Average Value
Number
Average Value
Number
Average Value
Number
Average Value
Number
Average Value
Number
Average Value
LOANS ORIGINATED
9
$99,674
50
$100,165
77
$103,504
38
$38,031
2
$47,625
5
$75,476
APPLICATIONS APPROVED, NOT ACCEPTED
0
$0
9
$96,464
13
$90,398
5
$19,214
2
$77,255
1
$51,960
APPLICATIONS DENIED
0
$0
17
$81,285
118
$115,821
17
$27,391
4
$131,115
7
$89,699
APPLICATIONS WITHDRAWN
0
$0
3
$83,787
38
$109,671
3
$119,653
0
$0
0
$0
FILES CLOSED FOR INCOMPLETENESS
0
$0
0
$0
11
$103,215
1
$7,870
0
$0
0
$0
Aggregated Statistics For Year 2006 (Based on 4 partial tracts)
A) FHA, FSA/RHS & VA Home Purchase Loans
B) Conventional Home Purchase Loans
C) Refinancings
D) Home Improvement Loans
F) Non-occupant Loans on < 5 Family Dwellings (A B C & D)
G) Loans On Manufactured Home Dwelling (A B C & D)
Number
Average Value
Number
Average Value
Number
Average Value
Number
Average Value
Number
Average Value
Number
Average Value
LOANS ORIGINATED
7
$78,797
74
$96,166
110
$79,766
38
$31,846
10
$54,169
9
$81,242
APPLICATIONS APPROVED, NOT ACCEPTED
0
$0
6
$126,253
15
$99,535
8
$32,218
2
$92,495
1
$45,660
APPLICATIONS DENIED
0
$0
8
$85,342
150
$89,404
23
$63,261
7
$143,376
6
$86,370
APPLICATIONS WITHDRAWN
2
$49,705
5
$74,864
62
$96,142
7
$31,771
1
$63,760
1
$80,290
FILES CLOSED FOR INCOMPLETENESS
1
$59,040
0
$0
17
$112,502
1
$173,970
1
$94,460
0
$0
Aggregated Statistics For Year 2005 (Based on 4 partial tracts)
A) FHA, FSA/RHS & VA Home Purchase Loans
B) Conventional Home Purchase Loans
C) Refinancings
D) Home Improvement Loans
F) Non-occupant Loans on < 5 Family Dwellings (A B C & D)
G) Loans On Manufactured Home Dwelling (A B C & D)
Number
Average Value
Number
Average Value
Number
Average Value
Number
Average Value
Number
Average Value
Number
Average Value
LOANS ORIGINATED
7
$113,367
61
$87,425
123
$98,281
33
$37,209
5
$69,944
10
$72,344
APPLICATIONS APPROVED, NOT ACCEPTED
0
$0
6
$68,987
30
$74,146
9
$30,992
1
$78,720
5
$78,726
APPLICATIONS DENIED
2
$95,250
17
$84,891
132
$107,537
31
$66,184
5
$57,984
6
$87,642
APPLICATIONS WITHDRAWN
2
$88,370
6
$225,663
76
$109,820
6
$75,182
2
$150,700
5
$78,814
FILES CLOSED FOR INCOMPLETENESS
0
$0
3
$104,597
13
$125,185
2
$22,080
0
$0
0
$0
Aggregated Statistics For Year 2004 (Based on 4 partial tracts)
A) FHA, FSA/RHS & VA Home Purchase Loans
B) Conventional Home Purchase Loans
C) Refinancings
D) Home Improvement Loans
F) Non-occupant Loans on < 5 Family Dwellings (A B C & D)
G) Loans On Manufactured Home Dwelling (A B C & D)
Number
Average Value
Number
Average Value
Number
Average Value
Number
Average Value
Number
Average Value
Number
Average Value
LOANS ORIGINATED
8
$85,836
65
$93,501
129
$83,467
31
$21,631
7
$106,231
6
$63,895
APPLICATIONS APPROVED, NOT ACCEPTED
0
$0
4
$51,562
23
$97,143
6
$40,028
0
$0
2
$49,595
APPLICATIONS DENIED
0
$0
17
$111,315
113
$99,849
28
$28,938
6
$32,335
9
$78,732
APPLICATIONS WITHDRAWN
2
$69,430
7
$78,411
76
$95,477
10
$56,914
0
$0
2
$47,230
FILES CLOSED FOR INCOMPLETENESS
5
$91,840
3
$63,500
36
$101,994
1
$28,340
0
$0
2
$80,480
Aggregated Statistics For Year 2003 (Based on 4 partial tracts)
A) FHA, FSA/RHS & VA Home Purchase Loans
B) Conventional Home Purchase Loans
C) Refinancings
D) Home Improvement Loans
F) Non-occupant Loans on < 5 Family Dwellings (A B C & D)
Number
Average Value
Number
Average Value
Number
Average Value
Number
Average Value
Number
Average Value
LOANS ORIGINATED
9
$100,767
39
$80,421
232
$84,426
45
$29,419
2
$35,505
APPLICATIONS APPROVED, NOT ACCEPTED
0
$0
3
$43,863
56
$85,956
6
$79,220
0
$0
APPLICATIONS DENIED
1
$109,420
6
$92,627
137
$92,483
11
$23,851
2
$71,320
APPLICATIONS WITHDRAWN
0
$0
3
$101,287
69
$83,005
4
$2,760
1
$11,810
FILES CLOSED FOR INCOMPLETENESS
0
$0
0
$0
8
$73,869
1
$27,550
0
$0
Aggregated Statistics For Year 2002 (Based on 4 partial tracts)
A) FHA, FSA/RHS & VA Home Purchase Loans
B) Conventional Home Purchase Loans
C) Refinancings
D) Home Improvement Loans
F) Non-occupant Loans on < 5 Family Dwellings (A B C & D)
Number
Average Value
Number
Average Value
Number
Average Value
Number
Average Value
Number
Average Value
LOANS ORIGINATED
9
$106,031
61
$83,662
167
$72,419
35
$21,935
6
$43,767
APPLICATIONS APPROVED, NOT ACCEPTED
0
$0
8
$76,001
43
$77,162
5
$16,712
1
$54,320
APPLICATIONS DENIED
7
$60,803
13
$43,958
103
$76,013
13
$6,793
6
$52,842
APPLICATIONS WITHDRAWN
1
$62,190
5
$82,236
80
$113,580
7
$17,659
0
$0
FILES CLOSED FOR INCOMPLETENESS
0
$0
2
$46,840
13
$73,985
1
$11,810
0
$0
Aggregated Statistics For Year 2001 (Based on 4 partial tracts)
A) FHA, FSA/RHS & VA Home Purchase Loans
B) Conventional Home Purchase Loans
C) Refinancings
D) Home Improvement Loans
F) Non-occupant Loans on < 5 Family Dwellings (A B C & D)
Number
Average Value
Number
Average Value
Number
Average Value
Number
Average Value
Number
Average Value
LOANS ORIGINATED
9
$78,374
37
$76,490
128
$68,662
32
$18,029
1
$39,360
APPLICATIONS APPROVED, NOT ACCEPTED
1
$60,610
9
$83,420
42
$68,116
10
$19,242
3
$34,137
APPLICATIONS DENIED
0
$0
8
$77,909
115
$75,243
20
$11,589
2
$39,360
APPLICATIONS WITHDRAWN
2
$60,310
2
$72,815
61
$71,019
8
$10,541
0
$0
FILES CLOSED FOR INCOMPLETENESS
0
$0
5
$58,302
10
$78,154
0
$0
0
$0
Aggregated Statistics For Year 2000 (Based on 4 partial tracts)
A) FHA, FSA/RHS & VA Home Purchase Loans
B) Conventional Home Purchase Loans
C) Refinancings
D) Home Improvement Loans
F) Non-occupant Loans on < 5 Family Dwellings (A B C & D)
Number
Average Value
Number
Average Value
Number
Average Value
Number
Average Value
Number
Average Value
LOANS ORIGINATED
12
$89,948
46
$82,774
72
$55,236
29
$25,172
3
$70,427
APPLICATIONS APPROVED, NOT ACCEPTED
0
$0
10
$58,161
21
$69,923
9
$10,763
2
$40,240
APPLICATIONS DENIED
1
$51,960
9
$55,180
70
$72,963
17
$15,332
1
$3,150
APPLICATIONS WITHDRAWN
0
$0
5
$43,042
20
$53,183
6
$14,580
0
$0
FILES CLOSED FOR INCOMPLETENESS
0
$0
0
$0
16
$66,724
2
$23,670
0
$0
Aggregated Statistics For Year 1999 (Based on 2 partial tracts)
A) FHA, FSA/RHS & VA Home Purchase Loans
B) Conventional Home Purchase Loans
C) Refinancings
D) Home Improvement Loans
F) Non-occupant Loans on < 5 Family Dwellings (A B C & D)


 Nearest zip codes: 15077, 15059, 15009, 15050, 15061, 15043.