Estimated zip code population in 2022: 3,180 Zip code population in 2010: 3,292 Zip code population in 2000: 3,616
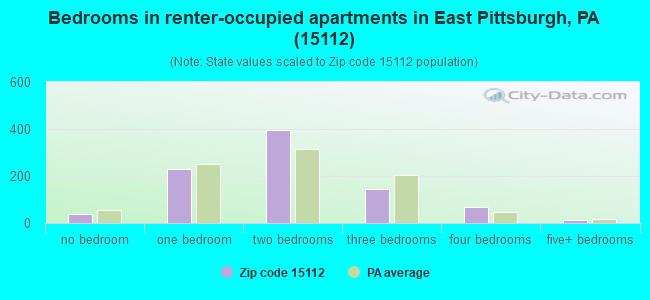
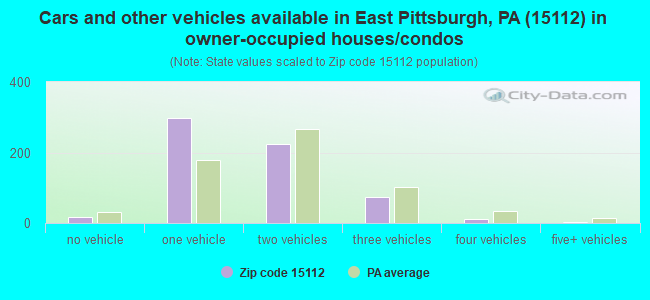
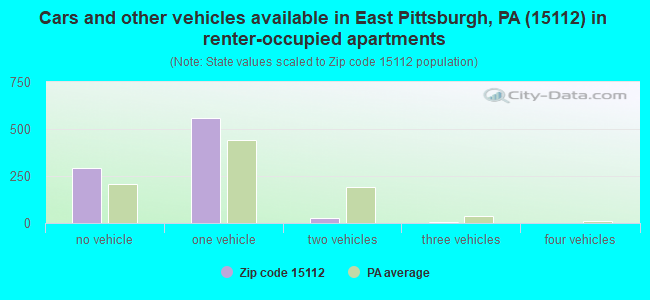
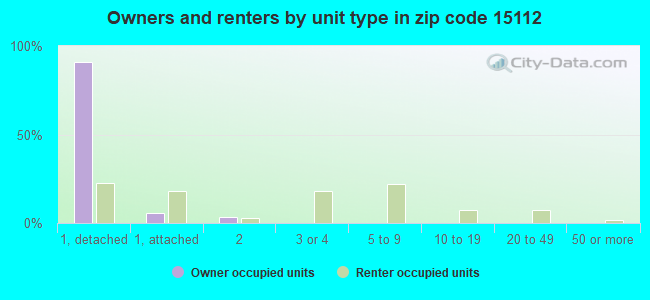
Houses and condos: 1,874 Renter-occupied apartments: 890
% of renters here:
59%
State:
31%
March 2022 cost of living index in zip code 15112: 92.1 (less than average, U.S. average is 100)
Land area: 0.8 sq. mi. Water area: 0.0 sq. mi.
Population density: 3,803 people per square mile
(average).
OSM Map
General Map
Google Map
MSN Map
OSM Map
General Map
Google Map
MSN Map
OSM Map
General Map
Google Map
MSN Map
OSM Map
General Map
Google Map
MSN Map
Please wait while loading the map...
Real estate property taxes paid for housing units in 2022:
This zip code:
2.2% ($2,023)
Pennsylvania:
1.3% ($3,094)
Median real estate property taxes paid for housing units with mortgages in 2022: $2,030 (2.1%) Median real estate property taxes paid for housing units with no mortgage in 2022: $2,015 (2.7%)
Averages for the 2020 tax year for zip code 15112, filed in 2021:
Average Adjusted Gross Income (AGI) in 2020: $36,471 (Individual Income Tax Returns)
Here:
$36,471
State:
$75,707
Salary/wage: $30,224 (reported on 82.9% of returns)
Here:
$30,224
State:
$62,806
(% of AGI for various income ranges: 936.8% for AGIs below $25k, 3264.0% for AGIs $25k-50k, 6284.0% for AGIs $50k-75k, 10107.5% for AGIs $75k-100k, 16177.5% for AGIs $100k-200k)
Taxable interest for individuals: $346 (reported on 15.2% of returns)
This zip code:
$346
Pennsylvania:
$1,633
(% of AGI for various income ranges: 2.5% for AGIs below $25k, 7.8% for AGIs $25k-50k, 4.7% for AGIs $50k-75k, 40.0% for AGIs $75k-100k, 30.0% for AGIs $100k-200k)
Ordinary dividends: $2,629 (reported on 8.9% of returns)
Here:
$2,629
State:
$7,382
(% of AGI for various income ranges: 11.7% for AGIs below $25k, 12.7% for AGIs $25k-50k, 38.0% for AGIs $50k-75k, 160.0% for AGIs $75k-100k, 320.0% for AGIs $100k-200k)
Net capital gain/loss in AGI: +$5,482 (reported on 7.0% of returns)
Here:
+$5,482
State:
+$23,522
(% of AGI for various income ranges: 3.4% for AGIs below $25k, 4.0% for AGIs $25k-50k, 28.0% for AGIs $50k-75k, 102.5% for AGIs $75k-100k, 1210.0% for AGIs $100k-200k)
Profit/loss from business: +$8,450 (reported on 11.4% of returns)
Here:
+$8,450
State:
+$16,274
(% of AGI for various income ranges: 85.8% for AGIs below $25k, 154.2% for AGIs $25k-50k, 930.0% for AGIs $75k-100k)
Taxable individual retirement arrangement distribution: $11,200 (reported on 7.0% of returns)
15112:
$11,200
Pennsylvania:
$18,583
(% of AGI for various income ranges: 42.3% for AGIs below $25k, 119.6% for AGIs $25k-50k, 1175.0% for AGIs $75k-100k)
Earned income credit: $2,202 (reported on 27.2% of returns)
Here:
$2,202
State:
$2,100
(% of AGI for various income ranges: 111.7% for AGIs below $25k, 78.9% for AGIs $25k-50k)
Percentage of individuals using paid preparers for their 2020 taxes: 91.8%
Here:
92%
State:
92%
(% for various income ranges: 91.0% for AGIs below $25k, 92.7% for AGIs $25k-50k, 90.0% for AGIs $50k-75k, 87.5% for AGIs $75k-100k, 100.0% for AGIs $100k-200k)
Averages for the 2012 tax year for zip code 15112, filed in 2013:
Average Adjusted Gross Income (AGI) in 2012: $32,056 (Individual Income Tax Returns)
Here:
$32,056
State:
$61,346
Salary/wage: $30,080 (reported on 85.4% of returns)
Here:
$30,080
State:
$51,902
(% of AGI for various income ranges: 75.7% for AGIs below $25k, 84.3% for AGIs $25k-50k, 82.0% for AGIs $50k-75k, 79.2% for AGIs $75k-100k, 74.4% for AGIs $100k-200k)
Taxable interest for individuals: $558 (reported on 22.8% of returns)
This zip code:
$558
Pennsylvania:
$1,588
(% of AGI for various income ranges: 0.5% for AGIs below $25k, 0.3% for AGIs $25k-50k, 0.5% for AGIs $50k-75k, 0.3% for AGIs $75k-100k, 0.2% for AGIs $100k-200k)
Ordinary dividends: $1,880 (reported on 12.7% of returns)
Here:
$1,880
State:
$5,827
(% of AGI for various income ranges: 1.0% for AGIs below $25k, 0.7% for AGIs $25k-50k, 0.3% for AGIs $50k-75k, 1.7% for AGIs $75k-100k)
Net capital gain/loss in AGI: +$164 (reported on 7.0% of returns)
Here:
+$164
State:
+$14,495
(% of AGI for various income ranges: 0.6% for AGIs $75k-100k)
Profit/loss from business: +$8,733 (reported on 9.5% of returns)
Here:
+$8,733
State:
+$16,268
(% of AGI for various income ranges: 5.5% for AGIs below $25k, 2.3% for AGIs $25k-50k, 3.5% for AGIs $50k-75k)
Taxable individual retirement arrangement distribution: $8,527 (reported on 7.0% of returns)
15112:
$8,527
Pennsylvania:
$14,550
(% of AGI for various income ranges: 2.3% for AGIs below $25k, 2.4% for AGIs $25k-50k, 2.9% for AGIs $50k-75k)
Total itemized deductions: $14,694 (25% of AGI, reported on 10.8% of returns)
Here:
$14,694
State:
$23,538
Here:
24.9% of AGI
State:
18.4% of AGI
(% of AGI for various income ranges: 6.1% for AGIs $25k-50k, 6.4% for AGIs $50k-75k, 11.0% for AGIs $75k-100k)
Charity contributions: $2,433 (reported on 7.6% of returns)
Here:
$2,433
State:
$4,025
(% of AGI for various income ranges: 0.5% for AGIs $25k-50k, 0.9% for AGIs $50k-75k, 1.4% for AGIs $75k-100k)
Taxes paid: $4,747 (reported on 10.8% of returns)
15112:
$4,747
State:
$9,982
(% of AGI for various income ranges: 1.5% for AGIs $25k-50k, 2.4% for AGIs $50k-75k, 4.2% for AGIs $75k-100k)
Earned income credit: $2,212 (reported on 25.9% of returns)
Here:
$2,212
State:
$2,106
(% of AGI for various income ranges: 7.1% for AGIs below $25k, 1.0% for AGIs $25k-50k)
Percentage of individuals using paid preparers for their 2012 taxes: 38.6%
Here:
39%
State:
53%
(% for various income ranges: 38.8% for AGIs below $25k, 36.2% for AGIs $25k-50k, 41.2% for AGIs $50k-75k, 44.4% for AGIs $75k-100k, 40.0% for AGIs $100k-200k)
Averages for the 2004 tax year for zip code 15112, filed in 2005:
Average Adjusted Gross Income (AGI) in 2004: $28,514 (Individual Income Tax Returns)
Here:
$28,514
State:
$48,049
Salary/wage: $27,537 (reported on 85.7% of returns)
Here:
$27,537
State:
$42,646
(% of AGI for various income ranges: 72.1% for AGIs below $10k, 80.0% for AGIs $10k-25k, 84.6% for AGIs $25k-50k, 88.1% for AGIs $50k-75k, 83.6% for AGIs $75k-100k, 63.9% for AGIs over 100k)
Taxable interest for individuals: $1,224 (reported on 33.2% of returns)
This zip code:
$1,224
Pennsylvania:
$1,657
(% of AGI for various income ranges: 3.8% for AGIs below $10k, 2.0% for AGIs $10k-25k, 1.8% for AGIs $25k-50k, 0.6% for AGIs $50k-75k, 0.7% for AGIs $75k-100k, 0.5% for AGIs over 100k)
Taxable dividends: $1,181 (reported on 15.7% of returns)
Here:
$1,181
State:
$3,566
(% of AGI for various income ranges: 2.1% for AGIs below $10k, 0.8% for AGIs $10k-25k, 0.6% for AGIs $25k-50k, 0.4% for AGIs $50k-75k, 0.9% for AGIs $75k-100k)
Net capital gain/loss: +$1,185 (reported on 10.2% of returns)
Here:
+$1,185
State:
+$9,716
(% of AGI for various income ranges: -1.1% for AGIs below $10k, 0.2% for AGIs $10k-25k, 0.1% for AGIs $25k-50k, 1.5% for AGIs $50k-75k, 0.5% for AGIs $75k-100k)
Profit/loss from business: +$6,944 (reported on 8.7% of returns)
Here:
+$6,944
State:
+$14,267
(% of AGI for various income ranges: 8.8% for AGIs below $10k, 2.6% for AGIs $10k-25k, 2.3% for AGIs $25k-50k, 1.9% for AGIs $50k-75k)
IRA payment deduction: $1,633 (reported on 1.8% of returns)
15112:
$1,633
Pennsylvania:
$2,903
Total itemized deductions: $11,702 (22% of AGI, reported on 12.6% of returns)
Here:
$11,702
State:
$18,804
Here:
22.3% of AGI
State:
19.5% of AGI
(% of AGI for various income ranges: 3.6% for AGIs $10k-25k, 5.0% for AGIs $25k-50k, 6.1% for AGIs $50k-75k, 7.0% for AGIs $75k-100k, 7.1% for AGIs over 100k)
Charity contributions deductions: $2,272 (4% of AGI, reported on 10.5% of returns)
Here:
$2,272
State:
$3,337
Here:
4.2% of AGI
State:
3.3% of AGI
(% of AGI for various income ranges: 0.5% for AGIs $10k-25k, 0.8% for AGIs $25k-50k, 1.1% for AGIs $50k-75k, 0.9% for AGIs $75k-100k, 1.9% for AGIs over 100k)
Total tax: $3,214 (reported on 71.1% of returns)
15112:
$3,214
State:
$8,008
(% of AGI for various income ranges: 2.2% for AGIs below $10k, 4.2% for AGIs $10k-25k, 7.6% for AGIs $25k-50k, 9.3% for AGIs $50k-75k, 11.9% for AGIs $75k-100k, 14.0% for AGIs over 100k)
Earned income credit: $1,674 (reported on 21.4% of returns)
Here:
$1,674
State:
$1,643
Percentage of individuals using paid preparers for their 2004 taxes: 44.7%
Here:
45%
State:
56%
(% for various income ranges: 41.5% for AGIs below $10k, 43.4% for AGIs $10k-25k, 46.0% for AGIs $25k-50k, 50.5% for AGIs $50k-75k, 45.1% for AGIs $75k-100k, 57.1% for AGIs over 100k)
Likely homosexual households (counted as self-reported same-sex unmarried-partner households)
Lesbian couples: 0.7% of all households
Gay men: 0.0% of all households
Household received Food Stamps/SNAP in the past 12 months: 559 Household did not receive Food Stamps/SNAP in the past 12 months: 975
Women who had a birth in the past 12 months: 115 (52 now married, 56 unmarried) Women who did not have a birth in the past 12 months: 581 (77 now married, 509 unmarried)
Housing units in zip code 15112 with a mortgage: 308 (13 second mortgage, 13 both second mortgage and home equity loan) Houses without a mortgage: 55
Median monthly owner costs for units with a mortgage: $936 Median monthly owner costs for units without a mortgage: $516
Residents with income below the poverty level in 2022:
This zip code:
22.6%
Whole state:
11.8%
Residents with income below 50% of the poverty level in 2022:
This zip code:
13.5%
Whole state:
6.1%
Median number of rooms in houses and condos:
Here:
6.0
State:
6.8
Median number of rooms in apartments:
Here:
4.6
State:
4.3
Notable locations in this zip code not listed on our city pages
Notable locations in zip code 15112: East Pittsburgh City Hall (A), East Pittsburgh Police Department (B), Chalfant Borough Hall (C), Wilkins Township Volunteer Fire Department 3 (D), East Pittsburgh Volunteer Fire Department Station 136 (E), Chalfant Volunteer Fire Company Station 120 (F). Display/hide their locations on the map
In group quarters: 9 (-1 institutionalized population)
Size of family households: 435 2-persons, 205 3-persons, 76 4-persons, 78 5-persons, 7 6-persons
Size of nonfamily households: 638 1-person, 65 2-persons, 10 3-persons
152 married couples with children.
467 single-parent households (96 men, 371 women).
94.5% of residents of 15112 zip code speak English at home.
2.2% of residents speak Spanish at home (41% very well, 59% not well).
2.3% of residents speak other Indo-European language at home (88% very well, 12% well).
0.1% of residents speak Asian or Pacific Island language at home (33% very well, 67% not well).
0.2% of residents speak other language at home (100% very well).
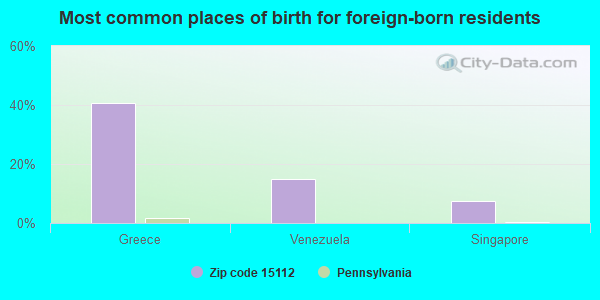
Foreign born population: 27 (0.9%) (92.6% of them are naturalized citizens)
This zip code:
0.9%
Whole state:
7.5%
41%Greece
15%Venezuela
7%Singapore
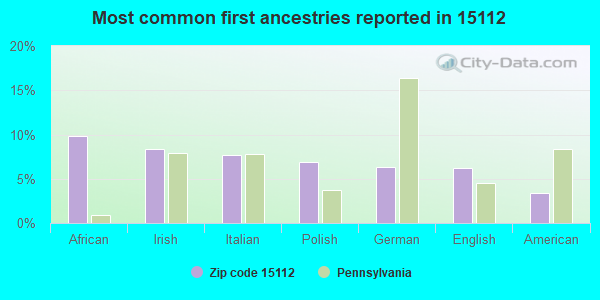
10%African
8%Irish
8%Italian
7%Polish
6%German
6%English
3%American
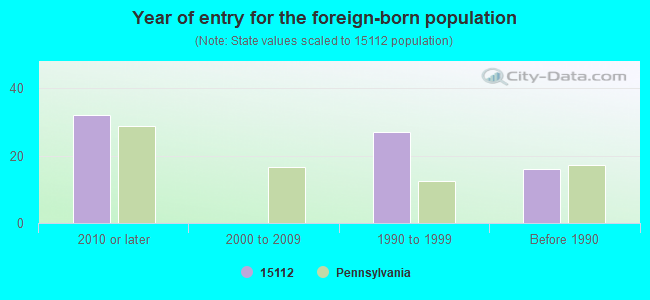
Year of entry for the foreign-born population
322010 or later
02000 to 2009
271990 to 1999
16Before 1990
Facilities with environmental interests located in this zip code:
ATOMATIC - MFG CO INC (300-10 SHADELAND AVE in EAST PITTSBURGH, PA)
(Resource Conservation and Recovery Act (tracking hazardous waste)) Business NAICS classification: OTHER COMMERCIAL AND SERVICE INDUSTRY MACHINERY MANUFACTURING. Organizations: OPERNAME (CONTACT/OPERATOR)
, OWNERNAME (CONTACT/OWNER)
ARDMORE BRAKE SERVICE (1125 ARDMORE BLVD in EAST PITTSBURGH, PA)
Small Quantity Generators, between 100 kg and 1000 kg of hazardous waste/month (Resource Conservation and Recovery Act (tracking hazardous waste)) - notification Organizations: OPERNAME (CONTACT/OPERATOR)
, TERRIE JOHN (CONTACT/OWNER)
ATLANTIC SERVICE STATION (30 & CENTER EAST in PITTSBURGH, PA)
Conditionally Exempt Small Quantity Generators, less than 100 kg/month of hazardous waste (Resource Conservation and Recovery Act (tracking hazardous waste)) - notification Organizations: OPERNAME (CONTACT/OPERATOR)
, ATLANTIC REFINING & MARKETING (CONTACT/OWNER)
ASSOCIATED THERMAL SERVICES (814 EAST PITTSBURGH MALL in EAST PITTSBURGH, PA)
ENFORCEMENT/COMPLIANCE ACTIVITY (Integrated Compliance Information System)
Housing units lacking complete plumbing facilities: 6.1% Housing units lacking complete kitchen facilities: 5.6%
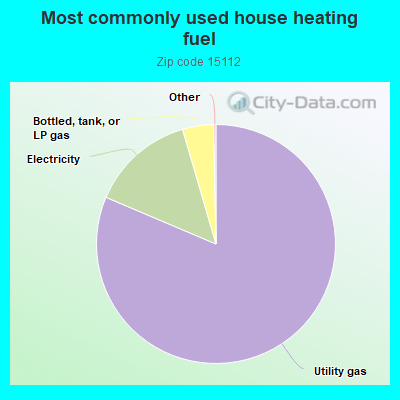
81.3%Utility gas
14.1%Electricity
4.2%Bottled, tank, or LP gas
Population in 1990: 4,145.
Place of birth for U.S.-born residents:
This state: 2,704
Northeast: 102
Midwest: 87
South: 115
West: 78
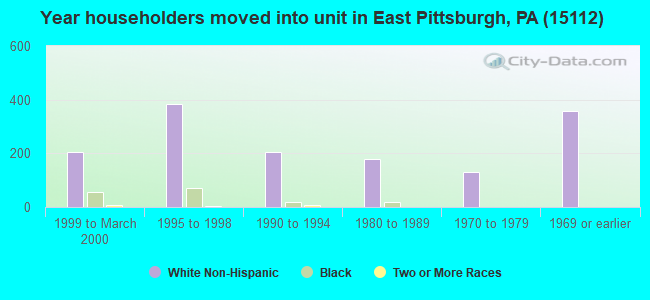
62% of the 15112 zip code residents lived in the same house 5 years ago. Out of people who lived in different houses, 82% lived in this county. Out of people who lived in different counties, 50% lived in Pennsylvania.
92% of the 15112 zip code residents lived in the same house 1 year ago. Out of people who lived in different houses, 64% moved from this county. Out of people who lived in different houses, 17% moved from different county within same state. Out of people who lived in different houses, 17% moved from different state. Out of people who lived in different houses, 2% moved from abroad.
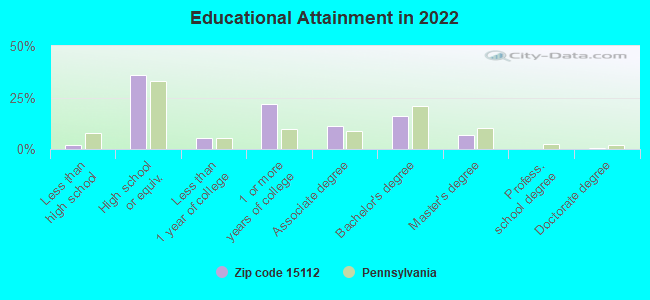
Private vs. public school enrollment:
Students in private schools in grades 1 to 8 (elementary and middle school): 28
Here:
7.0%
Pennsylvania:
15.7%
Students in private schools in grades 9 to 12 (high school):
Here:
0.0%
Pennsylvania:
13.4%
Students in private undergraduate colleges: 20
Here:
10.4%
Pennsylvania:
39.8%
Occupation by median earnings in the past 12 months ($)
60,282Arts, design, entertainment, sports, and media occupations
59,816Installation, maintenance, and repair occupations
57,128Business and financial operations occupations
55,647Construction and extraction occupations
55,513Health diagnosing and treating practitioners and other technical occupations
55,382Life, physical, and social science occupations
Companies with federal contracts located in this zip code:
CONTRAVES INC (700 BRADDOCK AVE STE 100 in EAST PITTSBURG, PA) : $3,249,395 in 4 contractsin 2000
$2,914,978 with Navy for Armament Training Devices. Taking place in FL. Signed on 2000-02-18. Completion date: 2000-12-01.
$200,000, same as above.Signed on 2000-08-03. Completion date: 2000-09-01.
$85,000, same as above.Signed on 2000-02-24. Completion date: 2000-03-31.
$49,417 with Air Force for Gas Services. Signed on 2000-09-25. Completion date: 2000-12-31.
CRAWFORD CONSULTING SERVICES, (239 HIGHLAND AVENUE, SUITE in EAST PITTSBURG, PA; small business) : $1,167,888 in 18 contractsfrom 2003 to 2006
Contracts for Maintenance, Repair or Alteration of Real Property -- Other Non-Building Facilities, Maintenance, Repair or Alteration of Real Property -- Hospitals and Infirmaries, Other Special Studies and Analyses, Architect - Engineer Services (including landscaping, interior layout, and designing) by Air Force, Department of Veterans Affairs, Army, U.S. Army Corps of Engineers - civil program financing only, and others Signed by year:2000: $0; 2001: $0; 2002: $0; 2003: $429,649; 2004: $529,768; 2005: $145,633; 2006: $62,838.
Biggest contracts:
$429,649 with Air Force for Maintenance, Repair or Alteration of Real Property -- Other Non-Building Facilities. Signed on 2003-09-30. Completion date: 2004-04-30.
$407,455 with Department of Veterans Affairs for Maintenance, Repair or Alteration of Real Property -- Hospitals and Infirmaries. Signed on 2004-05-19. Effective on 2004-06-10. Completion date: 2004-10-08.
$102,375 with Army for Other Special Studies and Analyses. Signed on 2004-07-09. Completion date: 2004-08-06.
$59,577 with Army for Architect - Engineer Services (including landscaping, interior layout, and designing). Signed on 2006-03-07. Completion date: 2007-03-12.
Top industries in this zip code by the number of employees in 2005:
Health Care and Social Assistance: Home Health Care Services (250-499 employees: 1 establishment)
Professional, Scientific, and Technical Services: Other Scientific and Technical Consulting Services (100-249: 1)
Health Care and Social Assistance: Ambulance Services (50-99: 1)
Information: Cable and Other Program Distribution (50-99: 1)
Construction: Commercial and Institutional Building Construction (10-19: 3)
Other Services (except Public Administration): Commercial and Industrial Machinery and Equipment (except Automotive and Electronic) Repair and Maintenance (20-49: 1, 1-4: 1)
Professional, Scientific, and Technical Services: Testing Laboratories (20-49: 1)
People in group quarters in 2010:
9 people in group homes intended for adults
People in group quarters in 2000:
10 people in religious group quarters
7 people in homes for the mentally retarded
Fatal accident statistics in 2013:
Fatal accident count: 1
Vehicles involved in fatal accidents: 4
Fatal accidents caused by drunken drivers: 0
Fatalities: 1
Persons involved in fatal accidents: 4
Pedestrians involved in fatal accidents: 0
Home Mortgage Disclosure Act Aggregated Statistics For Year 2009 (Based on 2 full and 4 partial tracts)
A) FHA, FSA/RHS & VA Home Purchase Loans
B) Conventional Home Purchase Loans
C) Refinancings
D) Home Improvement Loans
E) Loans on Dwellings For 5+ Families
F) Non-occupant Loans on < 5 Family Dwellings (A B C & D)
Number
Average Value
Number
Average Value
Number
Average Value
Number
Average Value
Number
Average Value
Number
Average Value
LOANS ORIGINATED
19
$69,928
11
$45,903
25
$71,825
13
$16,048
0
$0
2
$16,755
APPLICATIONS APPROVED, NOT ACCEPTED
0
$0
0
$0
9
$55,986
1
$18,380
0
$0
2
$22,340
APPLICATIONS DENIED
2
$91,890
0
$0
23
$76,081
8
$22,865
0
$0
2
$4,605
APPLICATIONS WITHDRAWN
0
$0
2
$50,990
12
$92,898
0
$0
2
$223,415
0
$0
FILES CLOSED FOR INCOMPLETENESS
0
$0
0
$0
2
$67,950
4
$68,650
0
$0
2
$34,900
Aggregated Statistics For Year 2008 (Based on 2 full and 4 partial tracts)
A) FHA, FSA/RHS & VA Home Purchase Loans
B) Conventional Home Purchase Loans
C) Refinancings
D) Home Improvement Loans
E) Loans on Dwellings For 5+ Families
F) Non-occupant Loans on < 5 Family Dwellings (A B C & D)
Number
Average Value
Number
Average Value
Number
Average Value
Number
Average Value
Number
Average Value
Number
Average Value
LOANS ORIGINATED
18
$69,412
10
$64,408
22
$49,165
16
$13,004
2
$302,695
10
$47,668
APPLICATIONS APPROVED, NOT ACCEPTED
0
$0
5
$42,064
12
$46,550
4
$25,810
0
$0
10
$36,214
APPLICATIONS DENIED
4
$91,628
2
$36,075
45
$58,722
29
$20,768
2
$115,430
9
$46,236
APPLICATIONS WITHDRAWN
2
$46,545
2
$40,690
9
$70,246
0
$0
0
$0
2
$36,810
FILES CLOSED FOR INCOMPLETENESS
0
$0
0
$0
4
$52,038
4
$36,202
0
$0
0
$0
Aggregated Statistics For Year 2007 (Based on 2 full and 4 partial tracts)
A) FHA, FSA/RHS & VA Home Purchase Loans
B) Conventional Home Purchase Loans
C) Refinancings
D) Home Improvement Loans
E) Loans on Dwellings For 5+ Families
F) Non-occupant Loans on < 5 Family Dwellings (A B C & D)
Number
Average Value
Number
Average Value
Number
Average Value
Number
Average Value
Number
Average Value
Number
Average Value
LOANS ORIGINATED
8
$65,539
32
$65,277
57
$49,606
25
$33,727
2
$98,675
31
$48,253
APPLICATIONS APPROVED, NOT ACCEPTED
0
$0
2
$48,640
13
$55,361
0
$0
0
$0
0
$0
APPLICATIONS DENIED
2
$63,630
13
$56,049
78
$59,486
44
$33,554
0
$0
20
$44,266
APPLICATIONS WITHDRAWN
0
$0
5
$39,136
24
$64,474
4
$54,058
0
$0
8
$58,159
FILES CLOSED FOR INCOMPLETENESS
0
$0
1
$69,840
2
$56,785
0
$0
0
$0
0
$0
Aggregated Statistics For Year 2006 (Based on 2 full and 4 partial tracts)
A) FHA, FSA/RHS & VA Home Purchase Loans
B) Conventional Home Purchase Loans
C) Refinancings
D) Home Improvement Loans
E) Loans on Dwellings For 5+ Families
F) Non-occupant Loans on < 5 Family Dwellings (A B C & D)
Number
Average Value
Number
Average Value
Number
Average Value
Number
Average Value
Number
Average Value
Number
Average Value
LOANS ORIGINATED
12
$60,782
57
$48,616
78
$48,339
28
$32,484
6
$85,243
39
$47,394
APPLICATIONS APPROVED, NOT ACCEPTED
0
$0
10
$48,334
22
$46,870
8
$24,935
0
$0
6
$40,960
APPLICATIONS DENIED
2
$40,030
11
$65,995
77
$60,539
44
$24,154
0
$0
19
$57,998
APPLICATIONS WITHDRAWN
1
$47,990
7
$71,249
36
$64,969
0
$0
0
$0
4
$53,062
FILES CLOSED FOR INCOMPLETENESS
0
$0
4
$59,730
10
$84,081
2
$13,965
0
$0
4
$54,625
Aggregated Statistics For Year 2005 (Based on 2 full and 4 partial tracts)
A) FHA, FSA/RHS & VA Home Purchase Loans
B) Conventional Home Purchase Loans
C) Refinancings
D) Home Improvement Loans
E) Loans on Dwellings For 5+ Families
F) Non-occupant Loans on < 5 Family Dwellings (A B C & D)
Number
Average Value
Number
Average Value
Number
Average Value
Number
Average Value
Number
Average Value
Number
Average Value
LOANS ORIGINATED
23
$61,667
56
$48,821
95
$54,533
31
$26,121
2
$67,025
59
$46,388
APPLICATIONS APPROVED, NOT ACCEPTED
0
$0
5
$55,606
16
$52,944
11
$38,552
0
$0
9
$60,934
APPLICATIONS DENIED
0
$0
14
$32,293
104
$64,582
56
$16,484
0
$0
21
$36,850
APPLICATIONS WITHDRAWN
0
$0
5
$52,388
38
$76,190
12
$159,916
0
$0
3
$38,060
FILES CLOSED FOR INCOMPLETENESS
0
$0
4
$32,920
8
$81,264
2
$48,405
0
$0
2
$29,790
Aggregated Statistics For Year 2004 (Based on 2 full and 4 partial tracts)
A) FHA, FSA/RHS & VA Home Purchase Loans
B) Conventional Home Purchase Loans
C) Refinancings
D) Home Improvement Loans
F) Non-occupant Loans on < 5 Family Dwellings (A B C & D)
Number
Average Value
Number
Average Value
Number
Average Value
Number
Average Value
Number
Average Value
LOANS ORIGINATED
22
$61,109
49
$61,330
82
$55,927
40
$26,801
33
$33,900
APPLICATIONS APPROVED, NOT ACCEPTED
0
$0
9
$39,971
20
$53,992
13
$25,185
10
$27,570
APPLICATIONS DENIED
0
$0
15
$48,100
111
$84,995
83
$10,437
54
$82,936
APPLICATIONS WITHDRAWN
0
$0
9
$294,562
45
$59,128
4
$40,645
4
$624,672
FILES CLOSED FOR INCOMPLETENESS
0
$0
6
$35,525
18
$71,991
0
$0
2
$77,265
Aggregated Statistics For Year 2003 (Based on 2 full and 4 partial tracts)
A) FHA, FSA/RHS & VA Home Purchase Loans
B) Conventional Home Purchase Loans
C) Refinancings
D) Home Improvement Loans
F) Non-occupant Loans on < 5 Family Dwellings (A B C & D)
Number
Average Value
Number
Average Value
Number
Average Value
Number
Average Value
Number
Average Value
LOANS ORIGINATED
17
$72,782
31
$61,899
150
$49,494
33
$8,372
28
$48,922
APPLICATIONS APPROVED, NOT ACCEPTED
2
$57,075
8
$46,204
52
$55,279
11
$39,153
10
$38,352
APPLICATIONS DENIED
0
$0
17
$43,772
132
$55,973
66
$9,850
28
$23,476
APPLICATIONS WITHDRAWN
1
$73,100
8
$43,551
53
$57,094
4
$13,405
2
$102,190
FILES CLOSED FOR INCOMPLETENESS
0
$0
2
$25,135
14
$56,038
0
$0
4
$42,482
Aggregated Statistics For Year 2002 (Based on 2 full and 4 partial tracts)
A) FHA, FSA/RHS & VA Home Purchase Loans
B) Conventional Home Purchase Loans
C) Refinancings
D) Home Improvement Loans
F) Non-occupant Loans on < 5 Family Dwellings (A B C & D)
Number
Average Value
Number
Average Value
Number
Average Value
Number
Average Value
Number
Average Value
LOANS ORIGINATED
18
$58,089
47
$55,617
138
$50,427
13
$29,963
39
$46,826
APPLICATIONS APPROVED, NOT ACCEPTED
0
$0
10
$38,606
49
$58,000
5
$23,118
6
$23,758
APPLICATIONS DENIED
2
$53,360
5
$35,058
128
$48,733
27
$17,745
10
$45,259
APPLICATIONS WITHDRAWN
4
$31,915
5
$60,116
41
$58,189
0
$0
4
$60,975
FILES CLOSED FOR INCOMPLETENESS
0
$0
2
$34,900
1
$73,920
0
$0
0
$0
Aggregated Statistics For Year 2001 (Based on 2 full and 4 partial tracts)
A) FHA, FSA/RHS & VA Home Purchase Loans
B) Conventional Home Purchase Loans
C) Refinancings
D) Home Improvement Loans
F) Non-occupant Loans on < 5 Family Dwellings (A B C & D)
Number
Average Value
Number
Average Value
Number
Average Value
Number
Average Value
Number
Average Value
LOANS ORIGINATED
23
$53,745
36
$46,730
107
$45,017
26
$17,478
10
$34,294
APPLICATIONS APPROVED, NOT ACCEPTED
0
$0
4
$67,650
34
$43,478
17
$21,479
4
$29,645
APPLICATIONS DENIED
2
$37,435
12
$48,242
77
$45,036
42
$15,968
8
$37,780
APPLICATIONS WITHDRAWN
2
$56,785
3
$46,853
53
$50,433
12
$19,283
0
$0
FILES CLOSED FOR INCOMPLETENESS
0
$0
2
$43,730
14
$61,389
4
$12,975
2
$41,890
Aggregated Statistics For Year 2000 (Based on 2 full and 4 partial tracts)
A) FHA, FSA/RHS & VA Home Purchase Loans
B) Conventional Home Purchase Loans
C) Refinancings
D) Home Improvement Loans
E) Loans on Dwellings For 5+ Families
F) Non-occupant Loans on < 5 Family Dwellings (A B C & D)
Number
Average Value
Number
Average Value
Number
Average Value
Number
Average Value
Number
Average Value
Number
Average Value
LOANS ORIGINATED
21
$53,361
39
$44,248
33
$40,685
27
$20,697
0
$0
4
$41,890
APPLICATIONS APPROVED, NOT ACCEPTED
4
$40,960
3
$32,747
15
$38,991
7
$11,519
0
$0
0
$0
APPLICATIONS DENIED
0
$0
14
$33,995
49
$41,910
38
$14,491
0
$0
4
$30,760
APPLICATIONS WITHDRAWN
2
$33,905
2
$34,660
37
$54,569
0
$0
2
$69,820
2
$23,275
FILES CLOSED FOR INCOMPLETENESS
0
$0
4
$25,198
2
$19,580
0
$0
0
$0
2
$35,530
Aggregated Statistics For Year 1999 (Based on 2 full and 1 partial tracts)
A) FHA, FSA/RHS & VA Home Purchase Loans
B) Conventional Home Purchase Loans
C) Refinancings
D) Home Improvement Loans
F) Non-occupant Loans on < 5 Family Dwellings (A B C & D)
2004 - 2018 National Fire Incident Reporting System (NFIRS) incidents
Based on the data from the years 2004 - 2018 the average number of fires per year is 16. The highest number of fires - 59 took place in 2015, and the least - 0 in 2011. The data has a rising trend.
When looking into fire subcategories, the most incidents belonged to: Structure Fires (72.1%), and Outside Fires (10.7%).
Fire incident types reported to NFIRS in Zip Code 15112

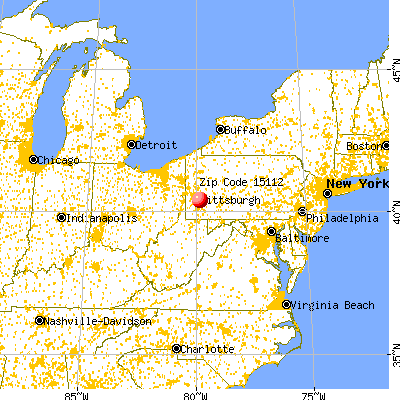


 Nearest zip codes: 15145, 15104, 15110, 15035, 15137, 15221.


 Based on the data from the years 2004 - 2018 the average number of fires per year is 16. The highest number of fires - 59 took place in 2015, and the least - 0 in 2011. The data has a rising trend.
 When looking into fire subcategories, the most incidents belonged to: Structure Fires (72.1%), and Outside Fires (10.7%).