Estimated zip code population in 2022: 1,637 Zip code population in 2010: 2,018 Zip code population in 2000: 2,207
Houses and condos: 887 Renter-occupied apartments: 82
% of renters here:
12%
State:
31%
March 2022 cost of living index in zip code 15322: 89.9 (less than average, U.S. average is 100)
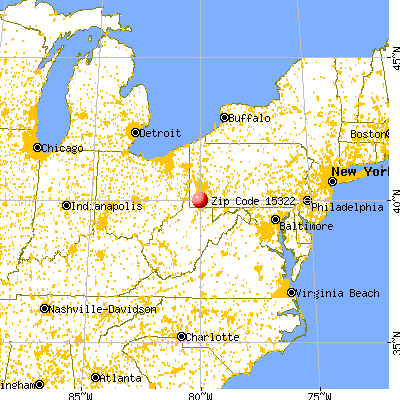
Land area: 14.2 sq. mi. Water area: 0.1 sq. mi.
Population density: 115 people per square mile
(very low).
OSM Map
General Map
Google Map
MSN Map
OSM Map
General Map
Google Map
MSN Map
OSM Map
General Map
Google Map
MSN Map
OSM Map
General Map
Google Map
MSN Map
Please wait while loading the map...
Real estate property taxes paid for housing units in 2022:
This zip code:
1.2% ($1,139)
Pennsylvania:
1.3% ($3,094)
Median real estate property taxes paid for housing units with mortgages in 2022: $1,346 (1.1%) Median real estate property taxes paid for housing units with no mortgage in 2022: $834 (1.0%)
Business Search- 14 Million verified businesses
Males: 805
(49.2%)
Females: 832
(50.8%)
For population 25 years and over in 15322:
High school or higher: 92.7%
Bachelor's degree or higher: 28.0%
Graduate or professional degree: 7.0%
Unemployed: 0.9%
Mean travel time to work (commute): 29.1 minutes
For population 15 years and over in 15322:
Never married: 33.8%
Now married: 47.6%
Separated: 1.4%
Widowed: 9.1%
Divorced: 8.1%
Zip code 15322 compared to state average:
Median house value significantly below state average.
Unemployed percentage significantly below state average.
Black race population percentage significantly below state average.
Hispanic race population percentage significantly below state average.
Foreign-born population percentage significantly below state average.
Renting percentage significantly below state average.
Length of stay since moving in significantly above state average.
Estimated median house/condo value in 2022: $95,508
15322:
$95,508
Pennsylvania:
$245,500
According to our research of Pennsylvania and other state lists, there were 3 registered sex offenders living in 15322 zip code as of June 03, 2024. The ratio of all residents to sex offenders in zip code 15322 is 689 to 1. The ratio of registered sex offenders to all residents in this zip code is near the state average.
Median resident age:
This zip code:
43.3 years
Pennsylvania median age:
40.9 years
Average household size:
This zip code:
2.2 people
Pennsylvania:
2.4 people
Averages for the 2020 tax year for zip code 15322, filed in 2021:
Average Adjusted Gross Income (AGI) in 2020: $51,957 (Individual Income Tax Returns)
Here:
$51,957
State:
$75,707
Salary/wage: $44,952 (reported on 79.8% of returns)
Here:
$44,952
State:
$62,806
(% of AGI for various income ranges: 984.2% for AGIs below $25k, 3043.2% for AGIs $25k-50k, 5828.3% for AGIs $50k-75k, 8382.9% for AGIs $75k-100k, 14984.3% for AGIs $100k-200k)
Taxable interest for individuals: $727 (reported on 24.7% of returns)
This zip code:
$727
Pennsylvania:
$1,633
(% of AGI for various income ranges: 23.7% for AGIs below $25k, 3.6% for AGIs $25k-50k, 18.3% for AGIs $50k-75k, 27.1% for AGIs $75k-100k, 94.3% for AGIs $100k-200k)
Ordinary dividends: $1,220 (reported on 11.2% of returns)
Here:
$1,220
State:
$7,382
(% of AGI for various income ranges: 10.5% for AGIs below $25k, 7.7% for AGIs $25k-50k, 35.0% for AGIs $50k-75k, 61.4% for AGIs $100k-200k)
Net capital gain/loss in AGI: +$1,233 (reported on 10.1% of returns)
Here:
+$1,233
State:
+$23,522
(% of AGI for various income ranges: 16.3% for AGIs below $25k, 43.3% for AGIs $50k-75k, 40.0% for AGIs $100k-200k)
Profit/loss from business: +$4,700 (reported on 5.6% of returns)
Here:
+$4,700
State:
+$16,274
(% of AGI for various income ranges: 195.8% for AGIs $50k-75k)
Taxable individual retirement arrangement distribution: $16,322 (reported on 10.1% of returns)
15322:
$16,322
Pennsylvania:
$18,583
(% of AGI for various income ranges: 236.8% for AGIs $25k-50k, 1354.3% for AGIs $75k-100k)
Earned income credit: $2,292 (reported on 13.5% of returns)
Here:
$2,292
State:
$2,100
(% of AGI for various income ranges: 92.1% for AGIs below $25k, 45.5% for AGIs $25k-50k)
Percentage of individuals using paid preparers for their 2020 taxes: 89.9%
Here:
90%
State:
92%
(% for various income ranges: 85.7% for AGIs below $25k, 92.3% for AGIs $25k-50k, 93.3% for AGIs $50k-75k, 88.9% for AGIs $75k-100k, 90.9% for AGIs $100k-200k)
Averages for the 2012 tax year for zip code 15322, filed in 2013:
Average Adjusted Gross Income (AGI) in 2012: $47,880 (Individual Income Tax Returns)
Here:
$47,880
State:
$61,346
Salary/wage: $43,725 (reported on 84.3% of returns)
Here:
$43,725
State:
$51,902
(% of AGI for various income ranges: 67.9% for AGIs below $25k, 78.2% for AGIs $25k-50k, 78.0% for AGIs $50k-75k, 87.3% for AGIs $75k-100k, 71.9% for AGIs $100k-200k)
Taxable interest for individuals: $721 (reported on 31.5% of returns)
This zip code:
$721
Pennsylvania:
$1,588
(% of AGI for various income ranges: 1.6% for AGIs below $25k, 0.7% for AGIs $25k-50k, 0.3% for AGIs $50k-75k, 0.2% for AGIs $75k-100k, 0.2% for AGIs $100k-200k)
Ordinary dividends: $815 (reported on 14.6% of returns)
Here:
$815
State:
$5,827
(% of AGI for various income ranges: 1.0% for AGIs below $25k, 0.4% for AGIs $25k-50k, 0.1% for AGIs $75k-100k, 0.2% for AGIs $100k-200k)
Net capital gain/loss in AGI: +$514 (reported on 7.9% of returns)
Here:
+$514
State:
+$14,495
Profit/loss from business: +$7,350 (reported on 6.7% of returns)
Here:
+$7,350
State:
+$16,268
Taxable individual retirement arrangement distribution: $8,462 (reported on 9.0% of returns)
15322:
$8,462
Pennsylvania:
$14,550
Total itemized deductions: $18,200 (18% of AGI, reported on 14.6% of returns)
Here:
$18,200
State:
$23,538
Here:
18.4% of AGI
State:
18.4% of AGI
(% of AGI for various income ranges: 8.6% for AGIs below $25k, 4.2% for AGIs $50k-75k, 6.8% for AGIs $75k-100k, 8.1% for AGIs $100k-200k)
Charity contributions: $2,878 (reported on 10.1% of returns)
Here:
$2,878
State:
$4,025
Taxes paid: $6,369 (reported on 14.6% of returns)
15322:
$6,369
State:
$9,982
(% of AGI for various income ranges: 1.5% for AGIs below $25k, 1.1% for AGIs $50k-75k, 2.2% for AGIs $75k-100k, 3.6% for AGIs $100k-200k)
Earned income credit: $2,025 (reported on 18.0% of returns)
Here:
$2,025
State:
$2,106
(% of AGI for various income ranges: 5.8% for AGIs below $25k, 1.2% for AGIs $25k-50k)
Percentage of individuals using paid preparers for their 2012 taxes: 47.2%
Here:
47%
State:
53%
(% for various income ranges: 40.0% for AGIs below $25k, 47.6% for AGIs $25k-50k, 53.3% for AGIs $50k-75k, 55.6% for AGIs $75k-100k, 55.6% for AGIs $100k-200k)
Averages for the 2004 tax year for zip code 15322, filed in 2005:
Average Adjusted Gross Income (AGI) in 2004: $33,637 (Individual Income Tax Returns)
Here:
$33,637
State:
$48,049
Salary/wage: $34,163 (reported on 82.2% of returns)
Here:
$34,163
State:
$42,646
(% of AGI for various income ranges: 82.8% for AGIs below $10k, 68.2% for AGIs $10k-25k, 85.0% for AGIs $25k-50k, 91.2% for AGIs $50k-75k, 89.0% for AGIs $75k-100k, 72.6% for AGIs over 100k)
Taxable interest for individuals: $1,154 (reported on 40.3% of returns)
This zip code:
$1,154
Pennsylvania:
$1,657
(% of AGI for various income ranges: 4.6% for AGIs below $10k, 4.2% for AGIs $10k-25k, 1.6% for AGIs $25k-50k, 0.3% for AGIs $50k-75k, 0.7% for AGIs $75k-100k, 0.4% for AGIs over 100k)
Taxable dividends: $456 (reported on 15.3% of returns)
Here:
$456
State:
$3,566
(% of AGI for various income ranges: 1.6% for AGIs below $10k, 0.2% for AGIs $10k-25k, 0.1% for AGIs $25k-50k, 0.2% for AGIs $50k-75k, 0.2% for AGIs $75k-100k, 0.2% for AGIs over 100k)
Profit/loss from business: +$845 (reported on 8.0% of returns)
Here:
+$845
State:
+$14,267
IRA payment deduction: $1,154 (reported on 1.5% of returns)
15322:
$1,154
Pennsylvania:
$2,903
Total itemized deductions: $15,209 (21% of AGI, reported on 12.4% of returns)
Here:
$15,209
State:
$18,804
Here:
20.6% of AGI
State:
19.5% of AGI
(% of AGI for various income ranges: 4.1% for AGIs $25k-50k, 5.4% for AGIs $50k-75k, 9.3% for AGIs $75k-100k, 11.9% for AGIs over 100k)
Charity contributions deductions: $2,656 (3% of AGI, reported on 10.5% of returns)
Here:
$2,656
State:
$3,337
Here:
3.4% of AGI
State:
3.3% of AGI
(% of AGI for various income ranges: 0.5% for AGIs $25k-50k, 0.5% for AGIs $50k-75k, 1.6% for AGIs $75k-100k, 2.5% for AGIs over 100k)
Total tax: $4,099 (reported on 70.5% of returns)
15322:
$4,099
State:
$8,008
(% of AGI for various income ranges: 1.6% for AGIs below $10k, 3.6% for AGIs $10k-25k, 6.9% for AGIs $25k-50k, 8.9% for AGIs $50k-75k, 11.0% for AGIs $75k-100k, 15.6% for AGIs over 100k)
Earned income credit: $1,543 (reported on 17.0% of returns)
Here:
$1,543
State:
$1,643
Percentage of individuals using paid preparers for their 2004 taxes: 51.5%
Here:
51%
State:
56%
(% for various income ranges: 41.9% for AGIs below $10k, 51.0% for AGIs $10k-25k, 58.4% for AGIs $25k-50k, 47.4% for AGIs $50k-75k, 68.9% for AGIs $75k-100k, 55.6% for AGIs over 100k)
Likely homosexual households (counted as self-reported same-sex unmarried-partner households)
Lesbian couples: 0.0% of all households
Gay men: 0.3% of all households
Household received Food Stamps/SNAP in the past 12 months: 127 Household did not receive Food Stamps/SNAP in the past 12 months: 588
Women who had a birth in the past 12 months: 6 (6 now married, 0 unmarried) Women who did not have a birth in the past 12 months: 428 (169 now married, 259 unmarried)
Housing units in zip code 15322 with a mortgage: 319 (18 second mortgage, 18 both second mortgage and home equity loan) Houses without a mortgage: 47
Median monthly owner costs for units with a mortgage: $931 Median monthly owner costs for units without a mortgage: $423
Residents with income below the poverty level in 2022:
This zip code:
11.3%
Whole state:
11.8%
Residents with income below 50% of the poverty level in 2022:
This zip code:
3.0%
Whole state:
6.1%
Median number of rooms in houses and condos:
Here:
5.7
State:
6.8
Median number of rooms in apartments:
Here:
4.9
State:
4.3
Notable locations in this zip code not listed on our city pages
In group quarters: 35 (-1 institutionalized population)
Size of family households: 178 2-persons, 172 3-persons, 112 4-persons
Size of nonfamily households: 243 1-person
158 married couples with children.
154 single-parent households (72 men, 82 women).
98.2% of residents of 15322 zip code speak English at home.
0.3% of residents speak Spanish at home (100% very well).
0.8% of residents speak other Indo-European language at home (100% very well).
Foreign born population: 4 (0.3%) (100.0% of them are naturalized citizens)
This zip code:
0.3%
Whole state:
7.5%
100%Denmark
27%American
18%German
13%Irish
11%Italian
8%European
5%Polish
5%English
Year of entry for the foreign-born population
02010 or later
02000 to 2009
01990 to 1999
5Before 1990
Housing units lacking complete plumbing facilities: 7.5% Housing units lacking complete kitchen facilities: 7.4%
70.9%Utility gas
13.6%Fuel oil, kerosene, etc.
10.9%Electricity
2.6%Bottled, tank, or LP gas
2.0%Wood
Population in 1990: 3,186.
Place of birth for U.S.-born residents:
This state: 1,208
Northeast: 6
Midwest: 70
South: 314
West: 31
73% of the 15322 zip code residents lived in the same house 5 years ago. Out of people who lived in different houses, 31% lived in this county. Out of people who lived in different counties, 50% lived in Pennsylvania.
94% of the 15322 zip code residents lived in the same house 1 year ago. Out of people who lived in different houses, 49% moved from this county. Out of people who lived in different houses, 22% moved from different county within same state. Out of people who lived in different houses, 25% moved from different state. Out of people who lived in different houses, 5% moved from abroad.
Private vs. public school enrollment:
Students in private schools in grades 1 to 8 (elementary and middle school): 10
Here:
12.3%
Pennsylvania:
15.7%
Students in private schools in grades 9 to 12 (high school):
Here:
0.0%
Pennsylvania:
13.4%
Students in private undergraduate colleges: 36
Here:
73.9%
Pennsylvania:
39.8%
Occupation by median earnings in the past 12 months ($)
93,982Office and administrative support occupations
93,860Management occupations
91,085Law enforcement workers including supervisors
76,611Education, training, and library occupations
60,020Health diagnosing and treating practitioners and other technical occupations
58,042Community and social service occupations
Top industries in this zip code by the number of employees in 2005:
Health Care and Social Assistance: Nursing Care Facilities (10-19 employees: 2 establishments)
Other Services (except Public Administration): Religious Organizations (5-9: 1, 1-4: 1)
Administrative and Support and Waste Management and Remediation Services: Solid Waste Collection (1-4: 1)
Health Care and Social Assistance: Homes for the Elderly (1-4: 1)
Professional, Scientific, and Technical Services: Other Accounting Services (1-4: 1)
Health Care and Social Assistance: Services for the Elderly and Persons with Disabilities (1-4: 1)
Accommodation and Food Services: Drinking Places (Alcoholic Beverages) (1-4: 1)
People in group quarters in 2010:
29 people in group homes intended for adults
People in group quarters in 2000:
41 people in nursing homes
17 people in other noninstitutional group quarters
2 people in religious group quarters
Fatal accident statistics in 2014:
Fatal accident count: 1
Vehicles involved in fatal accidents: 2
Fatal accidents caused by drunken drivers: 0
Fatalities: 1
Persons involved in fatal accidents: 3
Pedestrians involved in fatal accidents: 0
Home Mortgage Disclosure Act Aggregated Statistics For Year 2009 (Based on 2 partial tracts)
A) FHA, FSA/RHS & VA Home Purchase Loans
B) Conventional Home Purchase Loans
C) Refinancings
D) Home Improvement Loans
F) Non-occupant Loans on < 5 Family Dwellings (A B C & D)
G) Loans On Manufactured Home Dwelling (A B C & D)
Number
Average Value
Number
Average Value
Number
Average Value
Number
Average Value
Number
Average Value
Number
Average Value
LOANS ORIGINATED
2
$85,595
7
$73,784
16
$71,531
4
$24,700
3
$30,977
1
$60,650
APPLICATIONS APPROVED, NOT ACCEPTED
0
$0
0
$0
2
$42,550
2
$7,335
1
$4,890
0
$0
APPLICATIONS DENIED
1
$35,220
2
$117,385
7
$59,810
7
$15,791
1
$50,870
0
$0
APPLICATIONS WITHDRAWN
0
$0
1
$74,340
7
$81,470
0
$0
1
$42,060
0
$0
FILES CLOSED FOR INCOMPLETENESS
0
$0
0
$0
0
$0
0
$0
0
$0
0
$0
Aggregated Statistics For Year 2008 (Based on 2 partial tracts)
A) FHA, FSA/RHS & VA Home Purchase Loans
B) Conventional Home Purchase Loans
C) Refinancings
D) Home Improvement Loans
F) Non-occupant Loans on < 5 Family Dwellings (A B C & D)
G) Loans On Manufactured Home Dwelling (A B C & D)
Number
Average Value
Number
Average Value
Number
Average Value
Number
Average Value
Number
Average Value
Number
Average Value
LOANS ORIGINATED
9
$59,997
9
$34,780
16
$86,326
5
$30,128
5
$52,432
3
$85,103
APPLICATIONS APPROVED, NOT ACCEPTED
0
$0
2
$14,675
3
$90,973
4
$48,420
3
$26,087
1
$113,470
APPLICATIONS DENIED
1
$56,740
5
$70,234
27
$70,068
10
$50,769
1
$303,240
4
$49,400
APPLICATIONS WITHDRAWN
1
$42,060
0
$0
1
$146,730
0
$0
0
$0
0
$0
FILES CLOSED FOR INCOMPLETENESS
0
$0
0
$0
2
$94,395
1
$34,240
0
$0
0
$0
Aggregated Statistics For Year 2007 (Based on 2 partial tracts)
A) FHA, FSA/RHS & VA Home Purchase Loans
B) Conventional Home Purchase Loans
C) Refinancings
D) Home Improvement Loans
F) Non-occupant Loans on < 5 Family Dwellings (A B C & D)
G) Loans On Manufactured Home Dwelling (A B C & D)
Number
Average Value
Number
Average Value
Number
Average Value
Number
Average Value
Number
Average Value
Number
Average Value
LOANS ORIGINATED
3
$48,257
19
$57,251
23
$78,001
7
$26,830
7
$72,806
2
$48,910
APPLICATIONS APPROVED, NOT ACCEPTED
0
$0
1
$97,820
4
$89,015
2
$21,030
0
$0
0
$0
APPLICATIONS DENIED
1
$79,230
3
$93,257
30
$77,702
16
$28,123
0
$0
5
$49,888
APPLICATIONS WITHDRAWN
2
$65,050
4
$42,308
7
$49,050
0
$0
1
$16,630
0
$0
FILES CLOSED FOR INCOMPLETENESS
0
$0
1
$56,740
0
$0
0
$0
0
$0
0
$0
Aggregated Statistics For Year 2006 (Based on 2 partial tracts)
A) FHA, FSA/RHS & VA Home Purchase Loans
B) Conventional Home Purchase Loans
C) Refinancings
D) Home Improvement Loans
F) Non-occupant Loans on < 5 Family Dwellings (A B C & D)
G) Loans On Manufactured Home Dwelling (A B C & D)
Number
Average Value
Number
Average Value
Number
Average Value
Number
Average Value
Number
Average Value
Number
Average Value
LOANS ORIGINATED
1
$49,890
20
$69,158
35
$56,903
9
$22,499
3
$39,453
4
$39,862
APPLICATIONS APPROVED, NOT ACCEPTED
0
$0
1
$61,630
11
$49,977
1
$68,470
0
$0
0
$0
APPLICATIONS DENIED
0
$0
9
$55,866
24
$61,219
10
$23,672
1
$39,130
2
$71,410
APPLICATIONS WITHDRAWN
0
$0
1
$14,670
9
$62,279
1
$22,500
1
$14,670
0
$0
FILES CLOSED FOR INCOMPLETENESS
0
$0
0
$0
7
$72,247
0
$0
0
$0
0
$0
Aggregated Statistics For Year 2005 (Based on 2 partial tracts)
A) FHA, FSA/RHS & VA Home Purchase Loans
B) Conventional Home Purchase Loans
C) Refinancings
D) Home Improvement Loans
F) Non-occupant Loans on < 5 Family Dwellings (A B C & D)
G) Loans On Manufactured Home Dwelling (A B C & D)
Number
Average Value
Number
Average Value
Number
Average Value
Number
Average Value
Number
Average Value
Number
Average Value
LOANS ORIGINATED
5
$52,236
17
$69,049
28
$58,028
9
$23,368
6
$43,530
2
$48,420
APPLICATIONS APPROVED, NOT ACCEPTED
0
$0
0
$0
8
$47,320
2
$23,475
1
$43,040
0
$0
APPLICATIONS DENIED
0
$0
9
$60,974
46
$63,179
20
$32,721
0
$0
3
$37,823
APPLICATIONS WITHDRAWN
0
$0
4
$83,392
10
$57,127
2
$306,665
2
$120,810
0
$0
FILES CLOSED FOR INCOMPLETENESS
0
$0
1
$48,910
7
$55,479
0
$0
0
$0
0
$0
Aggregated Statistics For Year 2004 (Based on 2 partial tracts)
A) FHA, FSA/RHS & VA Home Purchase Loans
B) Conventional Home Purchase Loans
C) Refinancings
D) Home Improvement Loans
F) Non-occupant Loans on < 5 Family Dwellings (A B C & D)
G) Loans On Manufactured Home Dwelling (A B C & D)
Number
Average Value
Number
Average Value
Number
Average Value
Number
Average Value
Number
Average Value
Number
Average Value
LOANS ORIGINATED
1
$37,170
23
$68,006
32
$54,137
18
$24,564
3
$43,693
4
$57,958
APPLICATIONS APPROVED, NOT ACCEPTED
0
$0
2
$41,575
10
$99,874
5
$19,956
0
$0
2
$41,085
APPLICATIONS DENIED
2
$57,225
10
$53,703
58
$57,242
16
$32,097
5
$53,214
4
$51,845
APPLICATIONS WITHDRAWN
0
$0
3
$90,320
22
$54,023
2
$15,650
1
$70,430
1
$88,040
FILES CLOSED FOR INCOMPLETENESS
0
$0
0
$0
5
$77,670
2
$53,800
0
$0
0
$0
Aggregated Statistics For Year 2003 (Based on 2 partial tracts)
B) Conventional Home Purchase Loans
C) Refinancings
D) Home Improvement Loans
F) Non-occupant Loans on < 5 Family Dwellings (A B C & D)
Number
Average Value
Number
Average Value
Number
Average Value
Number
Average Value
LOANS ORIGINATED
18
$49,562
68
$60,102
7
$12,577
2
$39,130
APPLICATIONS APPROVED, NOT ACCEPTED
0
$0
17
$71,409
2
$12,715
4
$115,182
APPLICATIONS DENIED
6
$30,650
71
$67,895
15
$21,325
6
$22,498
APPLICATIONS WITHDRAWN
3
$46,300
23
$63,455
0
$0
1
$64,560
FILES CLOSED FOR INCOMPLETENESS
0
$0
4
$59,670
1
$24,450
1
$53,800
Aggregated Statistics For Year 2002 (Based on 2 partial tracts)
A) FHA, FSA/RHS & VA Home Purchase Loans
B) Conventional Home Purchase Loans
C) Refinancings
D) Home Improvement Loans
F) Non-occupant Loans on < 5 Family Dwellings (A B C & D)
Number
Average Value
Number
Average Value
Number
Average Value
Number
Average Value
Number
Average Value
LOANS ORIGINATED
3
$64,237
15
$57,909
57
$55,740
6
$18,423
1
$97,820
APPLICATIONS APPROVED, NOT ACCEPTED
0
$0
1
$71,410
10
$52,921
1
$8,800
0
$0
APPLICATIONS DENIED
0
$0
5
$31,498
48
$48,747
11
$21,254
0
$0
APPLICATIONS WITHDRAWN
2
$31,790
2
$49,890
26
$48,158
3
$8,803
0
$0
FILES CLOSED FOR INCOMPLETENESS
0
$0
1
$42,060
6
$63,420
0
$0
0
$0
Aggregated Statistics For Year 2001 (Based on 2 partial tracts)
A) FHA, FSA/RHS & VA Home Purchase Loans
B) Conventional Home Purchase Loans
C) Refinancings
D) Home Improvement Loans
Number
Average Value
Number
Average Value
Number
Average Value
Number
Average Value
LOANS ORIGINATED
5
$44,802
18
$49,834
52
$50,095
15
$23,673
APPLICATIONS APPROVED, NOT ACCEPTED
0
$0
3
$78,907
22
$53,356
9
$26,302
APPLICATIONS DENIED
1
$35,220
10
$48,617
67
$47,946
17
$18,586
APPLICATIONS WITHDRAWN
1
$40,110
1
$43,040
27
$54,888
2
$17,120
FILES CLOSED FOR INCOMPLETENESS
2
$67,005
0
$0
4
$43,775
0
$0
Aggregated Statistics For Year 2000 (Based on 2 partial tracts)
A) FHA, FSA/RHS & VA Home Purchase Loans
B) Conventional Home Purchase Loans
C) Refinancings
D) Home Improvement Loans
F) Non-occupant Loans on < 5 Family Dwellings (A B C & D)
Number
Average Value
Number
Average Value
Number
Average Value
Number
Average Value
Number
Average Value
LOANS ORIGINATED
3
$46,953
14
$40,246
27
$57,895
13
$18,135
2
$39,130
APPLICATIONS APPROVED, NOT ACCEPTED
0
$0
0
$0
18
$50,486
9
$23,803
0
$0
APPLICATIONS DENIED
0
$0
13
$68,775
47
$48,848
15
$14,543
1
$239,660
APPLICATIONS WITHDRAWN
1
$66,520
2
$24,455
12
$56,980
5
$34,628
0
$0
FILES CLOSED FOR INCOMPLETENESS
0
$0
1
$32,280
3
$38,477
2
$17,120
0
$0
Aggregated Statistics For Year 1999 (Based on 1 partial tract)
A) FHA, FSA/RHS & VA Home Purchase Loans
B) Conventional Home Purchase Loans
C) Refinancings
D) Home Improvement Loans
F) Non-occupant Loans on < 5 Family Dwellings (A B C & D)


 Nearest zip codes: 15346, 15348, 15333, 15345, 15344, 15368.


