Estimated zip code population in 2022: 122
Zip code population in 2010: 151
Zip code population in 2000: 205
March 2022 cost of living index in zip code 15361: 89.3
(less than average, U.S. average is 100)
Land area: 0.1
sq. mi.
Water area: 0.0
sq. mi.
| Population density: 1,285 people per square mile | | (low). |
![Age and Sex of Residents in zip code 15361]()
- OSM Map
- General Map
- Google Map
- MSN Map
- OSM Map
- General Map
- Google Map
- MSN Map
- OSM Map
- General Map
- Google Map
- MSN Map
- OSM Map
- General Map
- Google Map
- MSN Map
Please wait while loading the map...
Business Search - 14 Million verified businesses
| Males: 66 |  (54.5%) (54.5%) |
| Females: 55 |  (45.5%) (45.5%) |
For population 25 years and over in 15361:
- High school or higher: 78.8%
- Bachelor's degree or higher: 20.4%
- Graduate or professional degree: 0.0%
- Unemployed: 10.6%
- Mean travel time to work (commute): 21.1 minutes
For population 15 years and over in 15361:
- Never married: 9.0%
- Now married: 75.7%
- Separated: 7.1%
- Widowed: 0.0%
- Divorced: 8.2%
Zip code 15361 compared to state average:
- Median household income above state average.
- Median house value significantly below state average.
- Unemployed percentage above state average.
- Black race population percentage significantly below state average.
- Hispanic race population percentage significantly below state average.
- Median age significantly above state average.
- Foreign-born population percentage significantly below state average.
- Renting percentage significantly below state average.
- Length of stay since moving in significantly above state average.
- Number of rooms per house above state average.
- Number of college students significantly below state average.
Data:
100%
rural population.
Median resident age:| This zip code: | 60.6 years |
| Pennsylvania median age: | 40.9 years |
Average household size:| This zip code: | 2.2 people |
| Pennsylvania: | 2.4 people |
Averages for the 2004 tax year for zip code 15361, filed in 2005:
Average Adjusted Gross Income (AGI) in 2004: $30,165 (Individual Income Tax Returns)
| Here: | $30,165 |
| State: | $48,049 |
Salary/wage: $30,120 (reported on 88.2% of returns)
| Here: | $30,120 |
| State: | $42,646 |
(% of AGI for various income ranges: 57.4% for AGIs below $10k, 84.1% for AGIs $10k-25k, 82.6% for AGIs $25k-50k, 93.8% for AGIs $50k-75k)
Taxable interest for individuals: $333 (reported on 21.2% of returns)
| This zip code: | $333 |
| Pennsylvania: | $1,657 |
Total tax: $3,298 (reported on 67.1% of returns)
Earned income credit: $1,154 (reported on 15.3% of returns)
Percentage of individuals using paid preparers for their 2004 taxes: 47.1%
Estimated median household income in 2022: | This zip code: | $138,490 |
| Pennsylvania: | $71,798 |
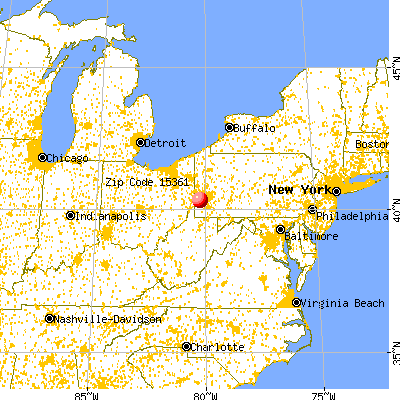
![Southview, PA (15361) map]() Nearest zip codes: 15057
Nearest zip codes: 15057,
15060,
15378,
15082,
15350,
15321.
Southview Zip Code Map
Percentage of family households:| This zip code: | 56.7% |
| Pennsylvania: | 42.6% |
Percentage of households with unmarried partners:| This zip code: | 0.0% |
| Pennsylvania: | 46.5% |
No gay or lesbian households reported
Household received Food Stamps/SNAP in the past 12 months: 12
Household did not receive Food Stamps/SNAP in the past 12 months: 44
Women who did not have a birth in the past 12 months: 20 (9 now married, 11 unmarried)
Housing units in zip code 15361 with a mortgage: 33 (10
second mortgage, 10
both second mortgage and home equity loan)
Median number of rooms in houses and condos:

- Year house built (houses)
- 02020 or later
- 02010 to 2019
- 02000 to 2009
- 01990 to 1999
- 121980 to 1989
- 01970 to 1979
- 01960 to 1969
- 411950 to 1959
- 111940 to 1949
- 221939 or earlier
![Zip code 15361 satellite photo by USGS]()
- Bedrooms in owner-occupied houses and condos in Southview, PA (15361)
- 0no bedroom
- 01 bedroom
- 02 bedrooms
- 333 bedrooms
- 244 bedrooms
- 05+ bedrooms
- Cars and other vehicles available in Southview, PA (15361) in owner-occupied houses/condos
- 13no vehicle
- 01 vehicle
- 452 vehicles
- 03 vehicles
- 04 vehicles
- 05+ vehicles
Zip code 15361 household income distribution in 2022
![Zip code 15361 household income distribution in 2022]()
- 12$20,000 to $24,999
- 10$75,000 to $99,999
- 20$125,000 to $149,999
- 12$200,000 or more
Estimate of home value of owner-occupied houses/condos in 2022 in zip code 15361
![Estimate of home value of owner-occupied houses/condos in 2022 in zip code 15361]()
- 7$90,000 to $99,999
- 19$100,000 to $124,999
- 12$250,000 to $299,999
- 13$300,000 to $399,999
Estimated median house (or condo) value in 2022 for:
- White Non-Hispanic householders: $250,723
Mean price in 2022:
Detached houses: $205,182| Here: | $205,182 |
| State: | $317,202 |
Housing units in structures:
Unemployment: 10.6%
Travel time to work (commute) in zip code 15361
![Travel time to work (commute) in zip code 15361]()
- 910 to 14 minutes
- 1115 to 19 minutes
- 2220 to 24 minutes
- 930 to 34 minutes
- 935 to 39 minutes
Percentage of zip code residents living and working in this county: 50.8%
Household type by relationship:
Households: 122
- Male householders: 24 (0 living alone), Female householders: 33 (0 living alone)
45 spouses (45 opposite-sex spouses), 10 unmarried partners, (10 opposite-sex unmarried partners), 12 children (12 natural, 0 adopted, 0 stepchildren), 0 grandchildren, 0 brothers or sisters, 0 parents, 0 foster children, 0 other relatives, 0 non-relatives
Size of family households: 36 2-persons, 9 3-persons
Size of nonfamily households: 12 2-persons
11 married couples with children.
0 single-parent households ().
99.2% of residents of 15361 zip code speak English at home.
Foreign born population: 0 (0.0%)
![Zip code 15361 topographic map]()
Housing units lacking complete kitchen facilities: 31.6%

- 41.9%Electricity
- 41.9%Fuel oil, kerosene, etc.
- 18.2%Utility gas
Place of birth for U.S.-born residents:
- This state: 86
- Midwest: 11
- West: 25
65% of the 15361 zip code residents lived in the same house 5 years ago.
Out of people who lived in different houses, 78% lived in this county.
100% of the 15361 zip code residents lived in the same house 1 year ago.
Students in private schools in grades 9 to 12 (high school): 11
| Here: | 100.0% |
| Pennsylvania: | 13.4% |

Home Mortgage Disclosure Act Aggregated Statistics For Year 2009
(Based on 2 partial tracts)
|
| B) Conventional
Home Purchase Loans | C) Refinancings
| D) Home Improvement Loans
|
|---|
| Number | Average Value | Number | Average Value | Number | Average Value |
|---|
| LOANS ORIGINATED | 1 | $233,460 | 4 | $200,730 | 1 | $29,520 |
| APPLICATIONS APPROVED, NOT ACCEPTED | 0 | $0 | 1 | $82,080 | 0 | $0 |
| APPLICATIONS DENIED | 0 | $0 | 2 | $150,330 | 0 | $0 |
| APPLICATIONS WITHDRAWN | 0 | $0 | 1 | $90,180 | 0 | $0 |
| FILES CLOSED FOR INCOMPLETENESS | 0 | $0 | 0 | $0 | 0 | $0 |
Aggregated Statistics For Year 2008
(Based on 2 partial tracts)
|
| B) Conventional
Home Purchase Loans | C) Refinancings
| D) Home Improvement Loans
|
|---|
| Number | Average Value | Number | Average Value | Number | Average Value |
|---|
| LOANS ORIGINATED | 1 | $243,420 | 3 | $155,880 | 1 | $10,560 |
| APPLICATIONS APPROVED, NOT ACCEPTED | 0 | $0 | 1 | $111,360 | 0 | $0 |
| APPLICATIONS DENIED | 0 | $0 | 2 | $190,320 | 0 | $0 |
| APPLICATIONS WITHDRAWN | 0 | $0 | 0 | $0 | 0 | $0 |
| FILES CLOSED FOR INCOMPLETENESS | 0 | $0 | 0 | $0 | 0 | $0 |
Aggregated Statistics For Year 2007
(Based on 2 partial tracts)
|
| B) Conventional
Home Purchase Loans | C) Refinancings
| D) Home Improvement Loans
|
|---|
| Number | Average Value | Number | Average Value | Number | Average Value |
|---|
| LOANS ORIGINATED | 3 | $116,740 | 3 | $103,180 | 1 | $47,160 |
| APPLICATIONS APPROVED, NOT ACCEPTED | 0 | $0 | 1 | $98,700 | 0 | $0 |
| APPLICATIONS DENIED | 0 | $0 | 5 | $118,776 | 1 | $17,100 |
| APPLICATIONS WITHDRAWN | 0 | $0 | 1 | $79,980 | 0 | $0 |
| FILES CLOSED FOR INCOMPLETENESS | 0 | $0 | 0 | $0 | 0 | $0 |
Aggregated Statistics For Year 2006
(Based on 2 partial tracts)
|
| B) Conventional
Home Purchase Loans | C) Refinancings
| D) Home Improvement Loans
|
|---|
| Number | Average Value | Number | Average Value | Number | Average Value |
|---|
| LOANS ORIGINATED | 3 | $172,500 | 5 | $108,480 | 1 | $55,920 |
| APPLICATIONS APPROVED, NOT ACCEPTED | 0 | $0 | 2 | $69,810 | 0 | $0 |
| APPLICATIONS DENIED | 0 | $0 | 4 | $119,910 | 1 | $28,020 |
| APPLICATIONS WITHDRAWN | 0 | $0 | 2 | $182,460 | 0 | $0 |
| FILES CLOSED FOR INCOMPLETENESS | 0 | $0 | 1 | $61,620 | 0 | $0 |
Aggregated Statistics For Year 2005
(Based on 2 partial tracts)
|
| B) Conventional
Home Purchase Loans | C) Refinancings
| D) Home Improvement Loans
|
|---|
| Number | Average Value | Number | Average Value | Number | Average Value |
|---|
| LOANS ORIGINATED | 5 | $181,728 | 4 | $132,555 | 1 | $40,020 |
| APPLICATIONS APPROVED, NOT ACCEPTED | 0 | $0 | 1 | $95,640 | 0 | $0 |
| APPLICATIONS DENIED | 0 | $0 | 4 | $133,350 | 0 | $0 |
| APPLICATIONS WITHDRAWN | 1 | $134,880 | 2 | $107,160 | 0 | $0 |
| FILES CLOSED FOR INCOMPLETENESS | 0 | $0 | 0 | $0 | 0 | $0 |
Aggregated Statistics For Year 2004
(Based on 2 partial tracts)
|
| B) Conventional
Home Purchase Loans | C) Refinancings
| D) Home Improvement Loans
|
|---|
| Number | Average Value | Number | Average Value | Number | Average Value |
|---|
| LOANS ORIGINATED | 3 | $194,740 | 4 | $96,810 | 1 | $22,500 |
| APPLICATIONS APPROVED, NOT ACCEPTED | 0 | $0 | 1 | $87,000 | 0 | $0 |
| APPLICATIONS DENIED | 0 | $0 | 4 | $126,015 | 0 | $0 |
| APPLICATIONS WITHDRAWN | 0 | $0 | 2 | $103,620 | 0 | $0 |
| FILES CLOSED FOR INCOMPLETENESS | 0 | $0 | 1 | $103,560 | 0 | $0 |
Aggregated Statistics For Year 2003
(Based on 2 partial tracts)
|
| B) Conventional
Home Purchase Loans | C) Refinancings
| D) Home Improvement Loans
|
|---|
| Number | Average Value | Number | Average Value | Number | Average Value |
|---|
| LOANS ORIGINATED | 2 | $144,060 | 9 | $103,293 | 1 | $28,620 |
| APPLICATIONS APPROVED, NOT ACCEPTED | 0 | $0 | 1 | $125,760 | 0 | $0 |
| APPLICATIONS DENIED | 1 | $52,740 | 5 | $103,200 | 0 | $0 |
| APPLICATIONS WITHDRAWN | 0 | $0 | 3 | $80,240 | 0 | $0 |
| FILES CLOSED FOR INCOMPLETENESS | 0 | $0 | 0 | $0 | 0 | $0 |
Aggregated Statistics For Year 2002
(Based on 2 partial tracts)
|
| B) Conventional
Home Purchase Loans | C) Refinancings
| D) Home Improvement Loans
|
|---|
| Number | Average Value | Number | Average Value | Number | Average Value |
|---|
| LOANS ORIGINATED | 1 | $177,000 | 6 | $81,980 | 1 | $34,080 |
| APPLICATIONS APPROVED, NOT ACCEPTED | 0 | $0 | 1 | $110,640 | 0 | $0 |
| APPLICATIONS DENIED | 1 | $29,460 | 4 | $80,535 | 0 | $0 |
| APPLICATIONS WITHDRAWN | 0 | $0 | 1 | $97,800 | 0 | $0 |
| FILES CLOSED FOR INCOMPLETENESS | 0 | $0 | 1 | $138,360 | 0 | $0 |
Aggregated Statistics For Year 2001
(Based on 2 partial tracts)
|
| B) Conventional
Home Purchase Loans | C) Refinancings
| D) Home Improvement Loans
|
|---|
| Number | Average Value | Number | Average Value | Number | Average Value |
|---|
| LOANS ORIGINATED | 1 | $191,940 | 5 | $81,900 | 1 | $24,480 |
| APPLICATIONS APPROVED, NOT ACCEPTED | 0 | $0 | 1 | $98,340 | 0 | $0 |
| APPLICATIONS DENIED | 1 | $39,540 | 3 | $84,920 | 0 | $0 |
| APPLICATIONS WITHDRAWN | 0 | $0 | 1 | $63,900 | 0 | $0 |
| FILES CLOSED FOR INCOMPLETENESS | 0 | $0 | 1 | $84,360 | 0 | $0 |
Aggregated Statistics For Year 2000
(Based on 2 partial tracts)
|
| B) Conventional
Home Purchase Loans | C) Refinancings
| D) Home Improvement Loans
|
|---|
| Number | Average Value | Number | Average Value | Number | Average Value |
|---|
| LOANS ORIGINATED | 1 | $84,660 | 2 | $46,200 | 1 | $22,440 |
| APPLICATIONS APPROVED, NOT ACCEPTED | 0 | $0 | 1 | $43,620 | 0 | $0 |
| APPLICATIONS DENIED | 0 | $0 | 2 | $62,940 | 0 | $0 |
| APPLICATIONS WITHDRAWN | 0 | $0 | 1 | $37,800 | 0 | $0 |
| FILES CLOSED FOR INCOMPLETENESS | 0 | $0 | 1 | $57,120 | 0 | $0 |
Aggregated Statistics For Year 1999
(Based on 1 partial tract)
|
| B) Conventional
Home Purchase Loans | C) Refinancings
| D) Home Improvement Loans
|
|---|
| Number | Average Value | Number | Average Value | Number | Average Value |
|---|
| LOANS ORIGINATED | 1 | $64,340 | 2 | $76,290 | 1 | $15,670 |
| APPLICATIONS APPROVED, NOT ACCEPTED | 0 | $0 | 0 | $0 | 0 | $0 |
| APPLICATIONS DENIED | 0 | $0 | 1 | $47,570 | 0 | $0 |
| APPLICATIONS WITHDRAWN | 0 | $0 | 1 | $37,290 | 0 | $0 |
| FILES CLOSED FOR INCOMPLETENESS | 0 | $0 | 0 | $0 | 0 | $0 |
Private Mortgage Insurance Companies Aggregated Statistics For Year 2005
(Based on 2 partial tracts)
|
| A) Conventional
Home Purchase Loans |
|---|
| Number | Average Value |
|---|
| LOANS ORIGINATED | 1 | $174,420 |
| APPLICATIONS APPROVED, NOT ACCEPTED | 0 | $0 |
| APPLICATIONS DENIED | 0 | $0 |
| APPLICATIONS WITHDRAWN | 0 | $0 |
| FILES CLOSED FOR INCOMPLETENESS | 0 | $0 |
Aggregated Statistics For Year 2004
(Based on 2 partial tracts)
|
| A) Conventional
Home Purchase Loans |
|---|
| Number | Average Value |
|---|
| LOANS ORIGINATED | 1 | $101,340 |
| APPLICATIONS APPROVED, NOT ACCEPTED | 0 | $0 |
| APPLICATIONS DENIED | 0 | $0 |
| APPLICATIONS WITHDRAWN | 0 | $0 |
| FILES CLOSED FOR INCOMPLETENESS | 0 | $0 |
| Most common first names in zip code 15361 among deceased individuals |
| Name | Count | Lived (average) |
|---|
| John | 11 | 79.0 years |
| Mary | 6 | 76.3 years |
| Frank | 5 | 70.8 years |
| Joseph | 4 | 81.1 years |
| Harry | 4 | 75.3 years |
| Anna | 3 | 82.0 years |
| William | 3 | 69.3 years |
| Jennie | 2 | 79.0 years |
| Anton | 2 | 87.5 years |
| Frances | 2 | 84.5 years |
| Most common last names in zip code 15361 among deceased individuals |
| Last name | Count | Lived (average) |
|---|
| Demnyan | 3 | 77.7 years |
| Havel | 3 | 71.0 years |
| Druga | 3 | 72.4 years |
| Hopkinson | 3 | 68.7 years |
| Kler | 3 | 79.7 years |
| Mrenak | 3 | 79.3 years |
| Patnesky | 3 | 82.0 years |
| Rupar | 3 | 88.0 years |
| Fray | 2 | 80.5 years |
| Liggitt | 2 | 82.0 years |
 100% rural population.


 Nearest zip codes: 15057, 15060, 15378, 15082, 15350, 15321.


