Estimated zip code population in 2022: 916 Zip code population in 2010: 1,091 Zip code population in 2000: 1,162
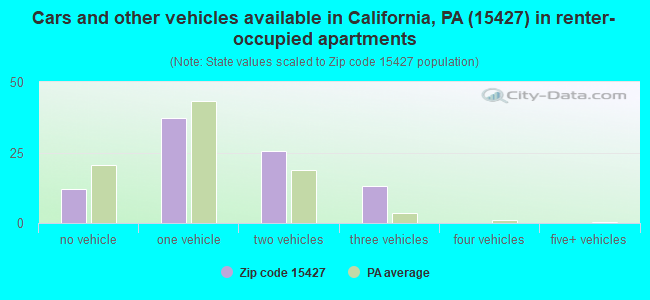
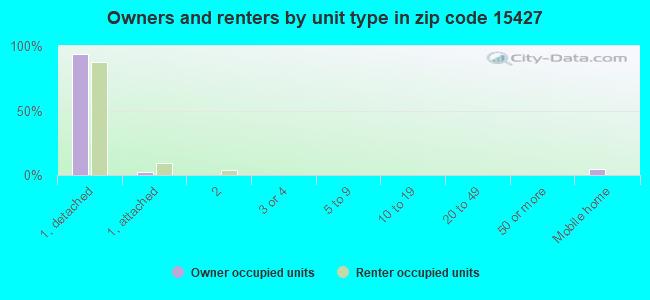
Houses and condos: 519 Renter-occupied apartments: 87
% of renters here:
21%
State:
31%
March 2022 cost of living index in zip code 15427: 88.5 (less than average, U.S. average is 100)
Land area: 10.5 sq. mi. Water area: 0.0 sq. mi.
Population density: 88 people per square mile
(very low).
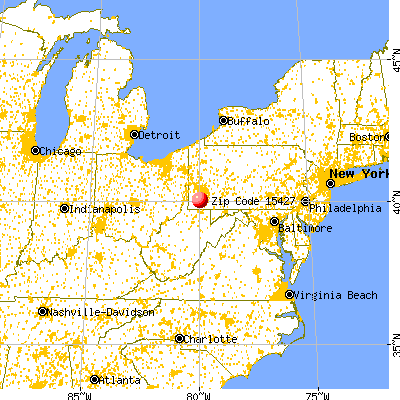
OSM Map
General Map
Google Map
MSN Map
OSM Map
General Map
Google Map
MSN Map
OSM Map
General Map
Google Map
MSN Map
OSM Map
General Map
Google Map
MSN Map
Please wait while loading the map...
Real estate property taxes paid for housing units in 2022:
This zip code:
0.7% ($1,257)
Pennsylvania:
1.3% ($3,094)
Median real estate property taxes paid for housing units with mortgages in 2022: $1,763 (0.9%) Median real estate property taxes paid for housing units with no mortgage in 2022: $1,042 (1.2%)
Business Search- 14 Million verified businesses
Males: 479
(52.3%)
Females: 437
(47.7%)
For population 25 years and over in 15427:
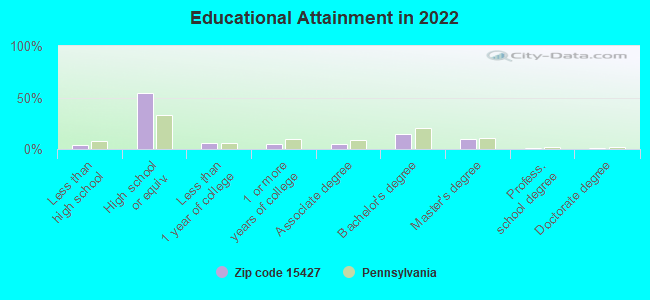
High school or higher: 96.3%
Bachelor's degree or higher: 27.1%
Graduate or professional degree: 12.4%
Unemployed: 1.3%
Mean travel time to work (commute): 31.3 minutes
For population 15 years and over in 15427:
Never married: 31.6%
Now married: 49.8%
Separated: 0.9%
Widowed: 4.4%
Divorced: 13.2%
Zip code 15427 compared to state average:
Unemployed percentage significantly below state average.
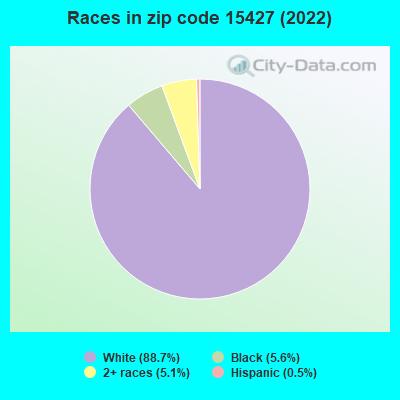
Black race population percentage below state average.
Hispanic race population percentage significantly below state average.
Median age above state average.
Foreign-born population percentage significantly below state average.
Length of stay since moving in significantly above state average.
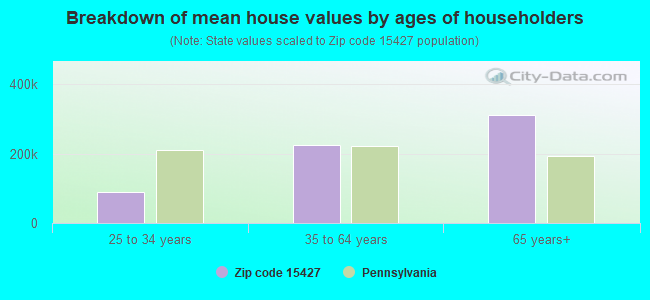
Estimated median house/condo value in 2022: $168,334
15427:
$168,334
Pennsylvania:
$245,500
According to our research of Pennsylvania and other state lists, there were 2 registered sex offenders living in 15427 zip code as of May 28, 2024. The ratio of all residents to sex offenders in zip code 15427 is 583 to 1. The ratio of registered sex offenders to all residents in this zip code is near the state average.
Median resident age:
This zip code:
46.1 years
Pennsylvania median age:
40.9 years
Average household size:
This zip code:
2.2 people
Pennsylvania:
2.4 people
Averages for the 2020 tax year for zip code 15427, filed in 2021:
Average Adjusted Gross Income (AGI) in 2020: $51,466 (Individual Income Tax Returns)
Here:
$51,466
State:
$75,707
Salary/wage: $45,508 (reported on 78.0% of returns)
Here:
$45,508
State:
$62,806
(% of AGI for various income ranges: 796.7% for AGIs below $25k, 2912.5% for AGIs $25k-50k, 5560.0% for AGIs $50k-75k, 8732.5% for AGIs $75k-100k, 14780.0% for AGIs $100k-200k)
Taxable interest for individuals: $317 (reported on 24.0% of returns)
This zip code:
$317
Pennsylvania:
$1,633
(% of AGI for various income ranges: 6.7% for AGIs below $25k, 4.2% for AGIs $25k-50k, 8.6% for AGIs $50k-75k, 47.5% for AGIs $100k-200k)
Ordinary dividends: $1,067 (reported on 12.0% of returns)
Here:
$1,067
State:
$7,382
(% of AGI for various income ranges: 22.5% for AGIs below $25k, 17.1% for AGIs $50k-75k, 62.5% for AGIs $100k-200k)
Net capital gain/loss in AGI: +$880 (reported on 10.0% of returns)
Here:
+$880
State:
+$23,522
(% of AGI for various income ranges: 62.9% for AGIs $50k-75k)
Profit/loss from business: +$13,450 (reported on 8.0% of returns)
Here:
+$13,450
State:
+$16,274
(% of AGI for various income ranges: 448.3% for AGIs $25k-50k)
Taxable individual retirement arrangement distribution: $15,367 (reported on 12.0% of returns)
15427:
$15,367
Pennsylvania:
$18,583
(% of AGI for various income ranges: 225.0% for AGIs $25k-50k, 1630.0% for AGIs $75k-100k)
Earned income credit: $1,475 (reported on 16.0% of returns)
Here:
$1,475
State:
$2,100
(% of AGI for various income ranges: 50.8% for AGIs below $25k, 47.5% for AGIs $25k-50k)
Percentage of individuals using paid preparers for their 2020 taxes: 94.0%
Here:
94%
State:
92%
(% for various income ranges: 93.8% for AGIs below $25k, 92.9% for AGIs $25k-50k, 88.9% for AGIs $50k-75k, 100.0% for AGIs $75k-100k, 100.0% for AGIs $100k-200k)
Averages for the 2012 tax year for zip code 15427, filed in 2013:
Average Adjusted Gross Income (AGI) in 2012: $45,165 (Individual Income Tax Returns)
Here:
$45,165
State:
$61,346
Salary/wage: $40,520 (reported on 76.9% of returns)
Here:
$40,520
State:
$51,902
(% of AGI for various income ranges: 56.7% for AGIs below $25k, 71.6% for AGIs $25k-50k, 75.9% for AGIs $50k-75k, 85.2% for AGIs $75k-100k, 56.2% for AGIs $100k-200k)
Taxable interest for individuals: $564 (reported on 26.9% of returns)
This zip code:
$564
Pennsylvania:
$1,588
(% of AGI for various income ranges: 1.0% for AGIs below $25k, 0.8% for AGIs $25k-50k, 0.1% for AGIs $50k-75k)
Ordinary dividends: $956 (reported on 17.3% of returns)
Here:
$956
State:
$5,827
(% of AGI for various income ranges: 1.5% for AGIs below $25k, 0.7% for AGIs $25k-50k, 0.3% for AGIs $75k-100k)
Net capital gain/loss in AGI: +$600 (reported on 9.6% of returns)
Here:
+$600
State:
+$14,495
Profit/loss from business: +$8,967 (reported on 5.8% of returns)
Here:
+$8,967
State:
+$16,268
Taxable individual retirement arrangement distribution: $9,433 (reported on 11.5% of returns)
15427:
$9,433
Pennsylvania:
$14,550
Total itemized deductions: $15,257 (18% of AGI, reported on 13.5% of returns)
Here:
$15,257
State:
$23,538
Here:
18.2% of AGI
State:
18.4% of AGI
(% of AGI for various income ranges: 7.6% for AGIs $25k-50k, 16.2% for AGIs $75k-100k)
Charity contributions: $2,225 (reported on 7.7% of returns)
Here:
$2,225
State:
$4,025
Taxes paid: $4,600 (reported on 13.5% of returns)
15427:
$4,600
State:
$9,982
(% of AGI for various income ranges: 3.7% for AGIs $50k-75k, 1.9% for AGIs $100k-200k)
Earned income credit: $1,886 (reported on 13.5% of returns)
Here:
$1,886
State:
$2,106
(% of AGI for various income ranges: 3.6% for AGIs below $25k, 0.9% for AGIs $25k-50k)
Percentage of individuals using paid preparers for their 2012 taxes: 53.8%
Here:
54%
State:
53%
(% for various income ranges: 50.0% for AGIs below $25k, 53.8% for AGIs $25k-50k, 50.0% for AGIs $50k-75k, 60.0% for AGIs $75k-100k, 75.0% for AGIs $100k-200k)
Averages for the 2004 tax year for zip code 15427, filed in 2005:
Average Adjusted Gross Income (AGI) in 2004: $31,661 (Individual Income Tax Returns)
Here:
$31,661
State:
$48,049
Salary/wage: $31,139 (reported on 80.2% of returns)
Here:
$31,139
State:
$42,646
(% of AGI for various income ranges: 85.7% for AGIs below $10k, 70.8% for AGIs $10k-25k, 76.7% for AGIs $25k-50k, 84.0% for AGIs $50k-75k, 80.8% for AGIs $75k-100k)
Taxable interest for individuals: $1,112 (reported on 42.0% of returns)
This zip code:
$1,112
Pennsylvania:
$1,657
(% of AGI for various income ranges: 5.4% for AGIs below $10k, 3.6% for AGIs $10k-25k, 1.9% for AGIs $25k-50k, 0.3% for AGIs $50k-75k, 0.2% for AGIs $75k-100k)
Taxable dividends: $304 (reported on 17.8% of returns)
Here:
$304
State:
$3,566
(% of AGI for various income ranges: 1.0% for AGIs below $10k, 0.1% for AGIs $10k-25k, 0.3% for AGIs $25k-50k, 0.1% for AGIs $50k-75k)
Net capital gain/loss: +$224 (reported on 11.7% of returns)
Here:
+$224
State:
+$9,716
(% of AGI for various income ranges: -1.7% for AGIs below $10k, 0.7% for AGIs $10k-25k, -0.2% for AGIs $25k-50k, 0.3% for AGIs $50k-75k)
Profit/loss from business: +$4,551 (reported on 8.6% of returns)
Here:
+$4,551
State:
+$14,267
IRA payment deduction: $2,800 (reported on 1.7% of returns)
15427:
$2,800
Pennsylvania:
$2,903
Total itemized deductions: $12,693 (20% of AGI, reported on 13.1% of returns)
Here:
$12,693
State:
$18,804
Here:
19.8% of AGI
State:
19.5% of AGI
Charity contributions deductions: $1,500 (2% of AGI, reported on 10.5% of returns)
Here:
$1,500
State:
$3,337
Here:
2.3% of AGI
State:
3.3% of AGI
Total tax: $3,559 (reported on 72.2% of returns)
15427:
$3,559
State:
$8,008
(% of AGI for various income ranges: 1.0% for AGIs below $10k, 3.6% for AGIs $10k-25k, 7.2% for AGIs $25k-50k, 9.6% for AGIs $50k-75k, 12.0% for AGIs $75k-100k)
Earned income credit: $1,926 (reported on 14.2% of returns)
Here:
$1,926
State:
$1,643
Percentage of individuals using paid preparers for their 2004 taxes: 53.3%
Here:
53%
State:
56%
(% for various income ranges: 47.2% for AGIs below $10k, 56.2% for AGIs $10k-25k, 54.1% for AGIs $25k-50k, 54.5% for AGIs $50k-75k, 55.0% for AGIs $75k-100k)
Likely homosexual households (counted as self-reported same-sex unmarried-partner households)
Lesbian couples: 0.0% of all households
Gay men: 0.7% of all households
Household received Food Stamps/SNAP in the past 12 months: 88 Household did not receive Food Stamps/SNAP in the past 12 months: 334
Women who had a birth in the past 12 months: 4 (4 now married, 0 unmarried) Women who did not have a birth in the past 12 months: 162 (78 now married, 82 unmarried)
Housing units in zip code 15427 with a mortgage: 181 (7 second mortgage, 4 both second mortgage and home equity loan) Houses without a mortgage: 4
Median monthly owner costs for units with a mortgage: $1,195 Median monthly owner costs for units without a mortgage: $413
Residents with income below the poverty level in 2022:
This zip code:
9.4%
Whole state:
11.8%
Residents with income below 50% of the poverty level in 2022:
This zip code:
4.4%
Whole state:
6.1%
Median number of rooms in houses and condos:
Here:
6.2
State:
6.8
Median number of rooms in apartments:
Here:
5.7
State:
4.3
Notable locations in this zip code not listed on our city pages
Size of family households: 107 2-persons, 58 3-persons, 55 4-persons, 8 5-persons, 4 7-or-more-persons
Size of nonfamily households: 155 1-person, 28 2-persons, 3 3-persons
85 married couples with children.
31 single-parent households (24 men, 7 women).
95.7% of residents of 15427 zip code speak English at home.
2.4% of residents speak Spanish at home (29% very well, 24% well, 48% not well).
1.4% of residents speak other Indo-European language at home (75% very well, 25% not at all).
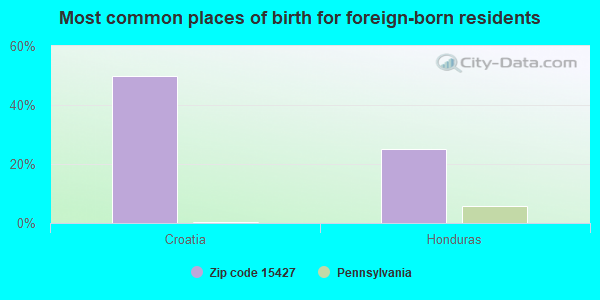
Foreign born population: 4 (0.5%) (100.0% of them are naturalized citizens)
This zip code:
0.5%
Whole state:
7.5%
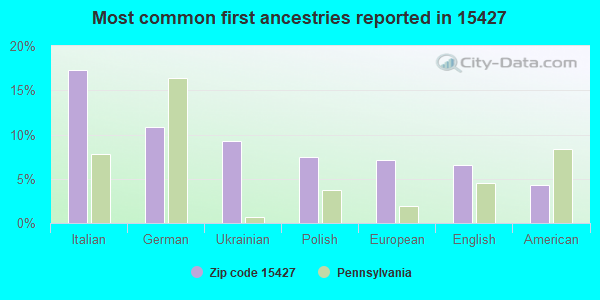
50%Croatia
25%Honduras
17%Italian
11%German
9%Ukrainian
7%Polish
7%European
7%English
4%American
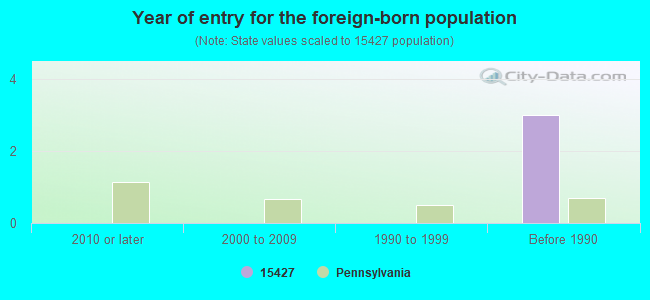
Year of entry for the foreign-born population
02010 or later
02000 to 2009
01990 to 1999
3Before 1990
Housing units lacking complete plumbing facilities: 10.6% Housing units lacking complete kitchen facilities: 15.0%
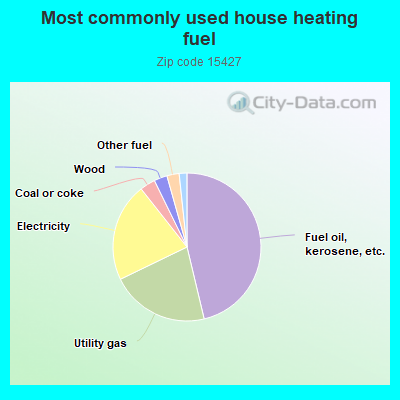
46.6%Fuel oil, kerosene, etc.
21.7%Utility gas
21.7%Electricity
3.4%Coal or coke
2.9%Wood
2.7%Other fuel
1.7%Bottled, tank, or LP gas
Population in 1990: 1,858.
Place of birth for U.S.-born residents:
This state: 804
Northeast: 24
Midwest: 36
South: 32
West: 8
82% of the 15427 zip code residents lived in the same house 5 years ago. Out of people who lived in different houses, 67% lived in this county. Out of people who lived in different counties, 50% lived in Pennsylvania.
99% of the 15427 zip code residents lived in the same house 1 year ago. Out of people who lived in different houses, 120% moved from this county. Out of people who lived in different houses, 20% moved from different county within same state.
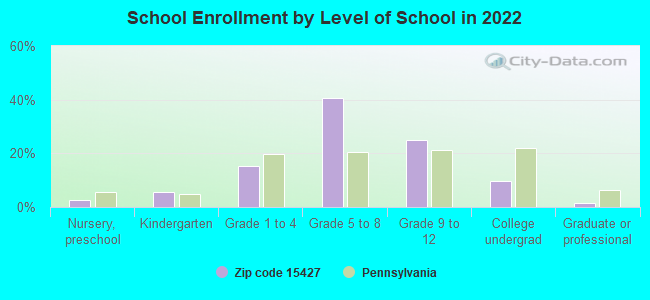
Private vs. public school enrollment:
Students in private schools in grades 1 to 8 (elementary and middle school): 12
Here:
15.5%
Pennsylvania:
15.7%
Students in private schools in grades 9 to 12 (high school):
Here:
0.0%
Pennsylvania:
13.4%
Students in private undergraduate colleges: 3
Here:
26.3%
Pennsylvania:
39.8%
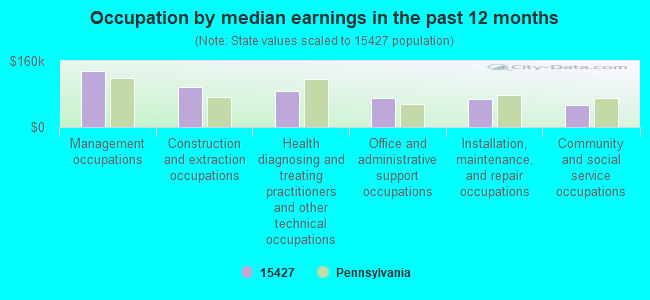
Occupation by median earnings in the past 12 months ($)
135,735Management occupations
97,239Construction and extraction occupations
87,111Health diagnosing and treating practitioners and other technical occupations
69,397Office and administrative support occupations
68,467Installation, maintenance, and repair occupations
53,705Community and social service occupations
Top industries in this zip code by the number of employees in 2005:
Construction: Site Preparation Contractors (5-9 employees: 1 establishment)
Construction: Siding Contractors (1-4: 1)
Health Care and Social Assistance: Community Food Services (1-4: 1)
Administrative and Support and Waste Management and Remediation Services: Exterminating and Pest Control Services (1-4: 1)
Other Services (except Public Administration): Civic and Social Organizations (1-4: 1)
Construction: Residential Remodelers (1-4: 1)
Utilities: Water Supply and Irrigation Systems (1-4: 1)
Fatal accident statistics in 2010:
Fatal accident count: 1
Vehicles involved in fatal accidents: 1
Fatal accidents caused by drunken drivers: 0
Fatalities: 2
Persons involved in fatal accidents: 2
Pedestrians involved in fatal accidents: 0
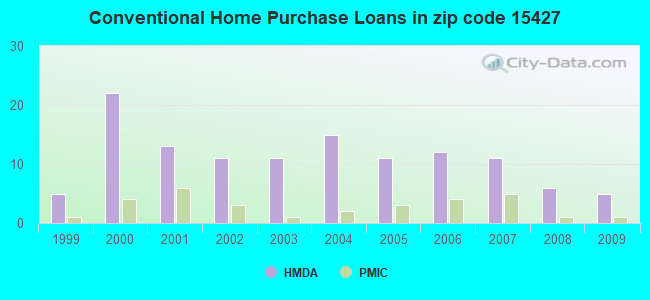
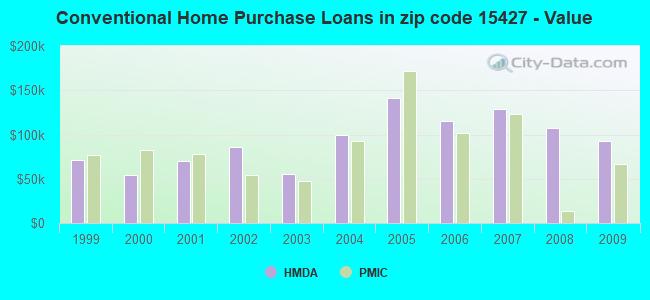
Home Mortgage Disclosure Act Aggregated Statistics For Year 2009 (Based on 2 partial tracts)
A) FHA, FSA/RHS & VA Home Purchase Loans
B) Conventional Home Purchase Loans
C) Refinancings
D) Home Improvement Loans
F) Non-occupant Loans on < 5 Family Dwellings (A B C & D)
G) Loans On Manufactured Home Dwelling (A B C & D)
Number
Average Value
Number
Average Value
Number
Average Value
Number
Average Value
Number
Average Value
Number
Average Value
LOANS ORIGINATED
2
$101,090
5
$93,200
14
$117,079
3
$75,323
1
$36,760
1
$38,920
APPLICATIONS APPROVED, NOT ACCEPTED
1
$250,840
0
$0
3
$134,070
2
$135,150
0
$0
0
$0
APPLICATIONS DENIED
2
$255,165
1
$18,380
13
$98,140
2
$56,765
0
$0
0
$0
APPLICATIONS WITHDRAWN
1
$187,050
0
$0
10
$142,070
0
$0
0
$0
2
$102,175
FILES CLOSED FOR INCOMPLETENESS
0
$0
0
$0
2
$109,200
0
$0
0
$0
0
$0
Aggregated Statistics For Year 2008 (Based on 2 partial tracts)
A) FHA, FSA/RHS & VA Home Purchase Loans
B) Conventional Home Purchase Loans
C) Refinancings
D) Home Improvement Loans
F) Non-occupant Loans on < 5 Family Dwellings (A B C & D)
G) Loans On Manufactured Home Dwelling (A B C & D)
Number
Average Value
Number
Average Value
Number
Average Value
Number
Average Value
Number
Average Value
Number
Average Value
LOANS ORIGINATED
2
$136,770
6
$107,038
15
$97,596
3
$25,590
1
$21,620
0
$0
APPLICATIONS APPROVED, NOT ACCEPTED
1
$44,330
0
$0
2
$103,795
1
$18,380
0
$0
1
$18,380
APPLICATIONS DENIED
0
$0
2
$166,505
30
$82,820
2
$36,220
1
$41,090
0
$0
APPLICATIONS WITHDRAWN
0
$0
0
$0
4
$117,850
3
$35,680
0
$0
0
$0
FILES CLOSED FOR INCOMPLETENESS
0
$0
1
$127,580
2
$53,520
0
$0
0
$0
0
$0
Aggregated Statistics For Year 2007 (Based on 2 partial tracts)
A) FHA, FSA/RHS & VA Home Purchase Loans
B) Conventional Home Purchase Loans
C) Refinancings
D) Home Improvement Loans
F) Non-occupant Loans on < 5 Family Dwellings (A B C & D)
G) Loans On Manufactured Home Dwelling (A B C & D)
Number
Average Value
Number
Average Value
Number
Average Value
Number
Average Value
Number
Average Value
Number
Average Value
LOANS ORIGINATED
2
$36,760
11
$129,155
22
$81,434
14
$44,561
1
$16,220
0
$0
APPLICATIONS APPROVED, NOT ACCEPTED
0
$0
1
$117,850
4
$95,145
2
$72,980
0
$0
0
$0
APPLICATIONS DENIED
0
$0
3
$189,210
31
$72,475
15
$74,387
0
$0
1
$108,120
APPLICATIONS WITHDRAWN
0
$0
0
$0
12
$101,542
1
$81,090
0
$0
0
$0
FILES CLOSED FOR INCOMPLETENESS
0
$0
0
$0
3
$184,523
0
$0
0
$0
0
$0
Aggregated Statistics For Year 2006 (Based on 2 partial tracts)
A) FHA, FSA/RHS & VA Home Purchase Loans
B) Conventional Home Purchase Loans
C) Refinancings
D) Home Improvement Loans
F) Non-occupant Loans on < 5 Family Dwellings (A B C & D)
G) Loans On Manufactured Home Dwelling (A B C & D)
Number
Average Value
Number
Average Value
Number
Average Value
Number
Average Value
Number
Average Value
Number
Average Value
LOANS ORIGINATED
1
$31,350
12
$115,418
30
$78,063
9
$36,280
1
$34,600
1
$21,620
APPLICATIONS APPROVED, NOT ACCEPTED
1
$80,010
2
$131,365
5
$105,958
3
$38,923
0
$0
3
$114,247
APPLICATIONS DENIED
0
$0
3
$59,107
36
$74,873
11
$64,085
0
$0
3
$103,797
APPLICATIONS WITHDRAWN
0
$0
1
$69,200
21
$92,623
3
$49,373
2
$62,710
0
$0
FILES CLOSED FOR INCOMPLETENESS
0
$0
0
$0
2
$49,735
0
$0
0
$0
0
$0
Aggregated Statistics For Year 2005 (Based on 2 partial tracts)
A) FHA, FSA/RHS & VA Home Purchase Loans
B) Conventional Home Purchase Loans
C) Refinancings
D) Home Improvement Loans
F) Non-occupant Loans on < 5 Family Dwellings (A B C & D)
G) Loans On Manufactured Home Dwelling (A B C & D)
Number
Average Value
Number
Average Value
Number
Average Value
Number
Average Value
Number
Average Value
Number
Average Value
LOANS ORIGINATED
2
$38,385
11
$141,343
31
$73,591
1
$37,840
3
$112,807
0
$0
APPLICATIONS APPROVED, NOT ACCEPTED
0
$0
0
$0
6
$71,178
2
$10,270
0
$0
1
$9,730
APPLICATIONS DENIED
0
$0
6
$118,032
45
$80,057
9
$31,474
1
$49,740
0
$0
APPLICATIONS WITHDRAWN
0
$0
2
$164,340
15
$101,993
3
$98,390
1
$174,070
1
$60,550
FILES CLOSED FOR INCOMPLETENESS
0
$0
0
$0
2
$110,280
0
$0
0
$0
0
$0
Aggregated Statistics For Year 2004 (Based on 2 partial tracts)
A) FHA, FSA/RHS & VA Home Purchase Loans
B) Conventional Home Purchase Loans
C) Refinancings
D) Home Improvement Loans
F) Non-occupant Loans on < 5 Family Dwellings (A B C & D)
G) Loans On Manufactured Home Dwelling (A B C & D)
Number
Average Value
Number
Average Value
Number
Average Value
Number
Average Value
Number
Average Value
Number
Average Value
LOANS ORIGINATED
1
$85,410
15
$99,543
36
$84,964
15
$26,958
2
$130,285
1
$90,820
APPLICATIONS APPROVED, NOT ACCEPTED
0
$0
3
$59,107
16
$73,116
4
$78,658
0
$0
0
$0
APPLICATIONS DENIED
0
$0
6
$183,985
50
$66,386
12
$28,922
1
$1,080
2
$15,675
APPLICATIONS WITHDRAWN
0
$0
4
$47,302
18
$69,197
2
$100,010
1
$54,060
1
$117,850
FILES CLOSED FOR INCOMPLETENESS
0
$0
0
$0
8
$73,251
0
$0
0
$0
0
$0
Aggregated Statistics For Year 2003 (Based on 2 partial tracts)
B) Conventional Home Purchase Loans
C) Refinancings
D) Home Improvement Loans
F) Non-occupant Loans on < 5 Family Dwellings (A B C & D)
Number
Average Value
Number
Average Value
Number
Average Value
Number
Average Value
LOANS ORIGINATED
11
$55,043
59
$95,622
12
$28,472
3
$45,770
APPLICATIONS APPROVED, NOT ACCEPTED
2
$63,250
17
$63,218
1
$2,160
1
$124,340
APPLICATIONS DENIED
6
$67,395
57
$75,855
11
$22,312
0
$0
APPLICATIONS WITHDRAWN
2
$75,685
18
$90,401
1
$27,030
0
$0
FILES CLOSED FOR INCOMPLETENESS
0
$0
1
$129,740
0
$0
0
$0
Aggregated Statistics For Year 2002 (Based on 2 partial tracts)
A) FHA, FSA/RHS & VA Home Purchase Loans
B) Conventional Home Purchase Loans
C) Refinancings
D) Home Improvement Loans
Number
Average Value
Number
Average Value
Number
Average Value
Number
Average Value
LOANS ORIGINATED
1
$43,250
11
$85,513
39
$73,660
11
$36,073
APPLICATIONS APPROVED, NOT ACCEPTED
0
$0
2
$55,140
10
$74,170
3
$27,750
APPLICATIONS DENIED
0
$0
4
$40,275
46
$65,107
3
$20,183
APPLICATIONS WITHDRAWN
0
$0
1
$194,620
11
$73,816
1
$27,030
FILES CLOSED FOR INCOMPLETENESS
0
$0
0
$0
3
$64,150
0
$0
Aggregated Statistics For Year 2001 (Based on 2 partial tracts)
A) FHA, FSA/RHS & VA Home Purchase Loans
B) Conventional Home Purchase Loans
C) Refinancings
D) Home Improvement Loans
F) Non-occupant Loans on < 5 Family Dwellings (A B C & D)
Number
Average Value
Number
Average Value
Number
Average Value
Number
Average Value
Number
Average Value
LOANS ORIGINATED
0
$0
13
$69,862
46
$62,804
10
$32,760
0
$0
APPLICATIONS APPROVED, NOT ACCEPTED
1
$127,580
1
$37,840
17
$53,042
5
$27,246
0
$0
APPLICATIONS DENIED
0
$0
3
$117,130
37
$53,709
14
$16,450
2
$14,595
APPLICATIONS WITHDRAWN
0
$0
1
$43,250
18
$76,284
3
$11,533
0
$0
FILES CLOSED FOR INCOMPLETENESS
0
$0
0
$0
2
$67,035
0
$0
0
$0
Aggregated Statistics For Year 2000 (Based on 2 partial tracts)
B) Conventional Home Purchase Loans
C) Refinancings
D) Home Improvement Loans
F) Non-occupant Loans on < 5 Family Dwellings (A B C & D)
Number
Average Value
Number
Average Value
Number
Average Value
Number
Average Value
LOANS ORIGINATED
22
$54,600
16
$55,547
12
$32,526
1
$63,790
APPLICATIONS APPROVED, NOT ACCEPTED
4
$20,272
12
$42,257
3
$15,497
2
$59,465
APPLICATIONS DENIED
9
$43,849
41
$62,446
8
$17,164
1
$43,250
APPLICATIONS WITHDRAWN
1
$10,810
15
$50,312
2
$11,895
1
$10,810
FILES CLOSED FOR INCOMPLETENESS
0
$0
5
$76,332
1
$10,810
0
$0
Aggregated Statistics For Year 1999 (Based on 1 partial tract)
B) Conventional Home Purchase Loans
C) Refinancings
D) Home Improvement Loans
F) Non-occupant Loans on < 5 Family Dwellings (A B C & D)


 Nearest zip codes: 15358, 15423, 15313, 15333, 15368, 15331.