Estimated zip code population in 2022: 1,837 Zip code population in 2010: 1,806 Zip code population in 2000: 1,936
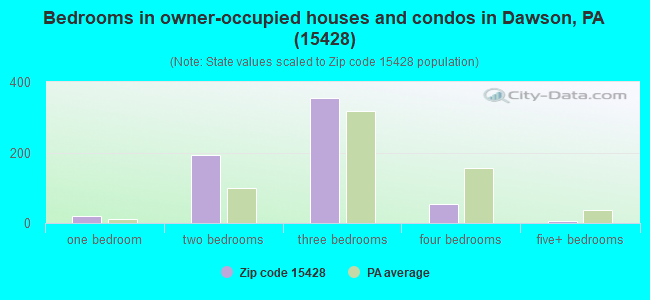
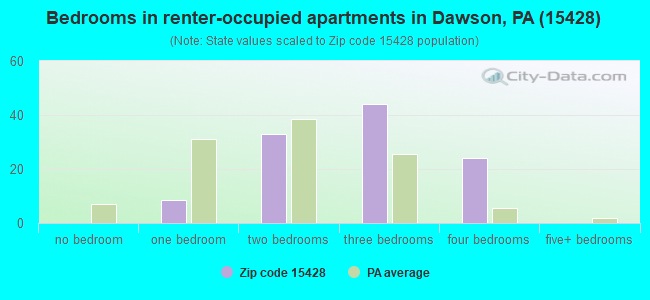
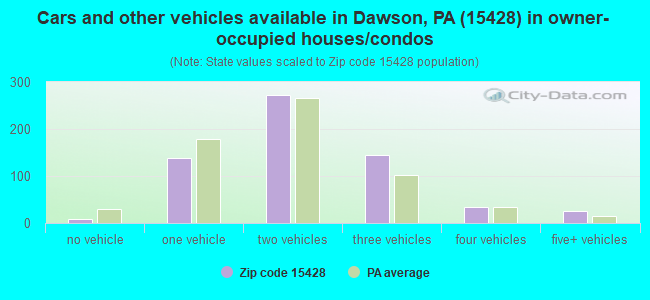
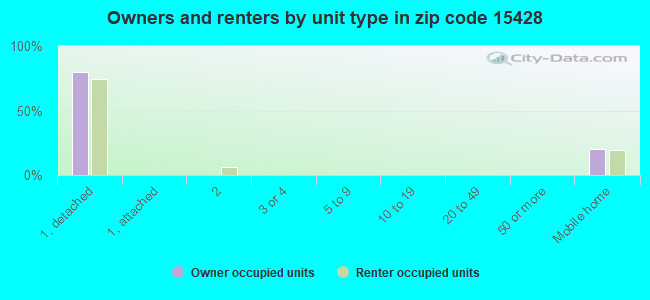
Houses and condos: 827 Renter-occupied apartments: 112
% of renters here:
15%
State:
31%
March 2022 cost of living index in zip code 15428: 87.6 (less than average, U.S. average is 100)
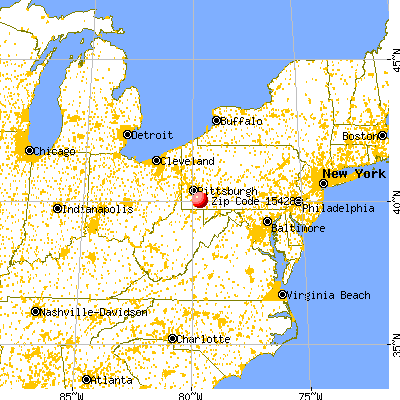
Land area: 20.5 sq. mi. Water area: 0.5 sq. mi.
Population density: 90 people per square mile
(very low).
OSM Map
General Map
Google Map
MSN Map
OSM Map
General Map
Google Map
MSN Map
OSM Map
General Map
Google Map
MSN Map
OSM Map
General Map
Google Map
MSN Map
Please wait while loading the map...
Real estate property taxes paid for housing units in 2022:
This zip code:
1.2% ($1,528)
Pennsylvania:
1.3% ($3,094)
Median real estate property taxes paid for housing units with mortgages in 2022: $2,060 (1.4%) Median real estate property taxes paid for housing units with no mortgage in 2022: $1,347 (1.2%)
Business Search- 14 Million verified businesses
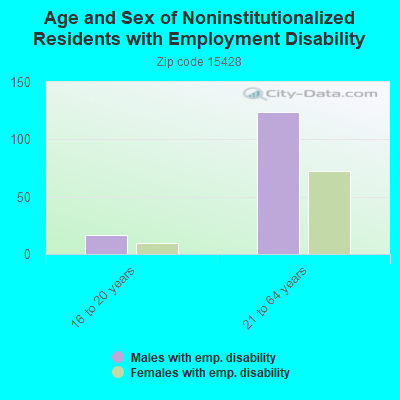
Males: 973
(53.0%)
Females: 864
(47.0%)
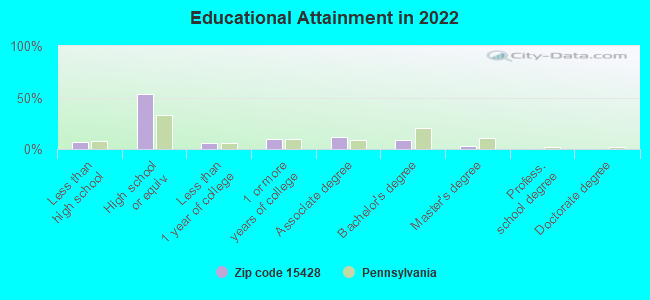
For population 25 years and over in 15428:
High school or higher: 91.3%
Bachelor's degree or higher: 12.1%
Graduate or professional degree: 3.9%
Unemployed: 5.0%
Mean travel time to work (commute): 31.9 minutes
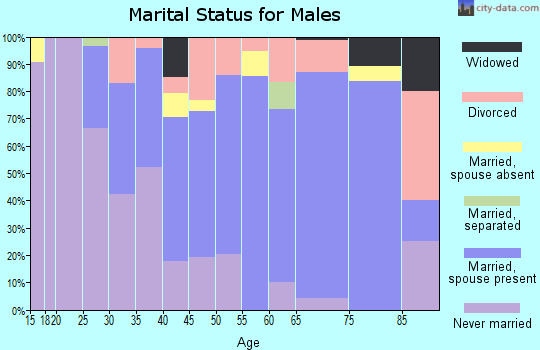
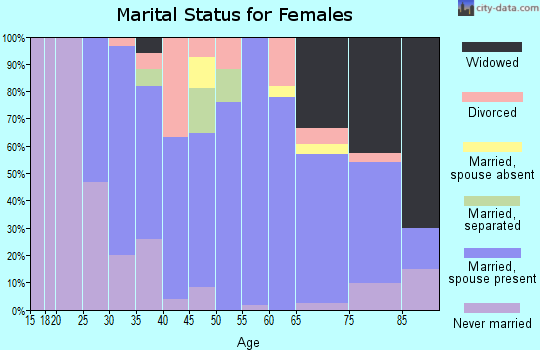
For population 15 years and over in 15428:
Never married: 23.2%
Now married: 62.0%
Separated: 1.8%
Widowed: 6.8%
Divorced: 6.2%
Zip code 15428 compared to state average:
Median house value below state average.
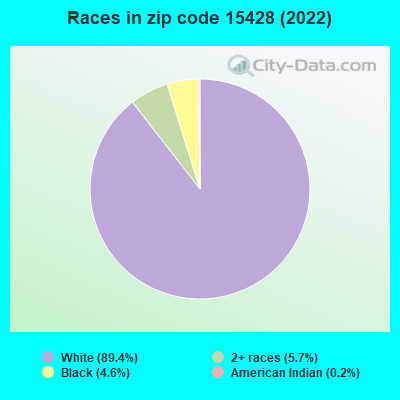
Black race population percentage below state average.
Hispanic race population percentage significantly below state average.
Foreign-born population percentage significantly below state average.
Renting percentage below state average.
Length of stay since moving in significantly above state average.
Number of college students below state average.
Percentage of population with a bachelor's degree or higher significantly below state average.
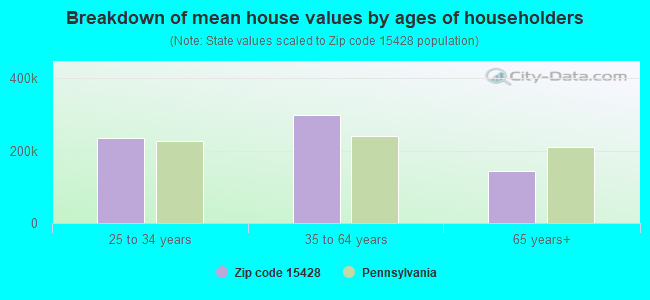
Estimated median house/condo value in 2022: $122,641
15428:
$122,641
Pennsylvania:
$245,500
According to our research of Pennsylvania and other state lists, there were 2 registered sex offenders living in 15428 zip code as of May 20, 2024. The ratio of all residents to sex offenders in zip code 15428 is 1,045 to 1. The ratio of registered sex offenders to all residents in this zip code is lower than the state average.
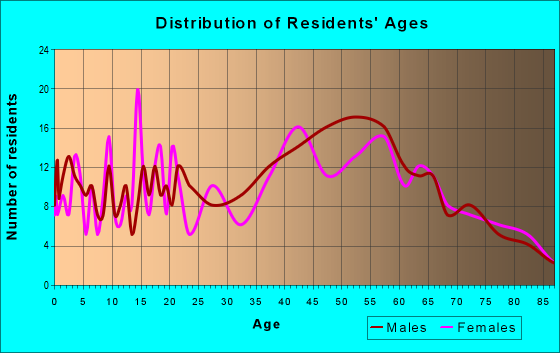
Median resident age:
This zip code:
44.4 years
Pennsylvania median age:
40.9 years
Average household size:
This zip code:
2.5 people
Pennsylvania:
2.4 people
Averages for the 2020 tax year for zip code 15428, filed in 2021:
Average Adjusted Gross Income (AGI) in 2020: $51,044 (Individual Income Tax Returns)
Here:
$51,044
State:
$75,707
Salary/wage: $48,468 (reported on 78.2% of returns)
Here:
$48,468
State:
$62,806
(% of AGI for various income ranges: 842.0% for AGIs below $25k, 3122.5% for AGIs $25k-50k, 6319.0% for AGIs $50k-75k, 9415.0% for AGIs $75k-100k, 16326.2% for AGIs $100k-200k)
Taxable interest for individuals: $346 (reported on 27.6% of returns)
This zip code:
$346
Pennsylvania:
$1,633
(% of AGI for various income ranges: 9.5% for AGIs below $25k, 19.5% for AGIs $25k-50k, 7.0% for AGIs $50k-75k, 11.7% for AGIs $75k-100k, 13.8% for AGIs $100k-200k)
Ordinary dividends: $1,436 (reported on 12.6% of returns)
Here:
$1,436
State:
$7,382
(% of AGI for various income ranges: 7.0% for AGIs below $25k, 44.5% for AGIs $25k-50k, 41.0% for AGIs $50k-75k, 17.5% for AGIs $100k-200k)
Net capital gain/loss in AGI: +$2,922 (reported on 10.3% of returns)
Here:
+$2,922
State:
+$23,522
(% of AGI for various income ranges: 59.0% for AGIs $25k-50k, 241.7% for AGIs $75k-100k)
Profit/loss from business: +$7,100 (reported on 10.3% of returns)
Here:
+$7,100
State:
+$16,274
(% of AGI for various income ranges: 60.5% for AGIs below $25k, 79.0% for AGIs $25k-50k, 600.0% for AGIs $75k-100k)
Taxable individual retirement arrangement distribution: $12,844 (reported on 10.3% of returns)
15428:
$12,844
Pennsylvania:
$18,583
(% of AGI for various income ranges: 81.5% for AGIs below $25k, 180.0% for AGIs $25k-50k, 1055.0% for AGIs $75k-100k)
Earned income credit: $2,217 (reported on 13.8% of returns)
Here:
$2,217
State:
$2,100
(% of AGI for various income ranges: 76.0% for AGIs below $25k, 57.0% for AGIs $25k-50k)
Percentage of individuals using paid preparers for their 2020 taxes: 94.3%
Here:
94%
State:
92%
(% for various income ranges: 92.9% for AGIs below $25k, 96.0% for AGIs $25k-50k, 92.9% for AGIs $50k-75k, 100.0% for AGIs $75k-100k, 91.7% for AGIs $100k-200k)
Averages for the 2012 tax year for zip code 15428, filed in 2013:
Average Adjusted Gross Income (AGI) in 2012: $42,912 (Individual Income Tax Returns)
Here:
$42,912
State:
$61,346
Salary/wage: $40,484 (reported on 80.7% of returns)
Here:
$40,484
State:
$51,902
(% of AGI for various income ranges: 64.3% for AGIs below $25k, 71.2% for AGIs $25k-50k, 84.3% for AGIs $50k-75k, 88.3% for AGIs $75k-100k, 69.5% for AGIs $100k-200k)
Taxable interest for individuals: $708 (reported on 31.3% of returns)
This zip code:
$708
Pennsylvania:
$1,588
(% of AGI for various income ranges: 1.1% for AGIs below $25k, 0.6% for AGIs $25k-50k, 0.4% for AGIs $50k-75k, 0.1% for AGIs $75k-100k, 0.5% for AGIs $100k-200k)
Ordinary dividends: $686 (reported on 16.9% of returns)
Here:
$686
State:
$5,827
(% of AGI for various income ranges: 0.6% for AGIs below $25k, 0.3% for AGIs $25k-50k, 0.1% for AGIs $50k-75k, 0.6% for AGIs $75k-100k)
Net capital gain/loss in AGI: +$4,157 (reported on 8.4% of returns)
Here:
+$4,157
State:
+$14,495
Profit/loss from business: +$7,325 (reported on 9.6% of returns)
Here:
+$7,325
State:
+$16,268
Taxable individual retirement arrangement distribution: $8,262 (reported on 9.6% of returns)
15428:
$8,262
Pennsylvania:
$14,550
(% of AGI for various income ranges: 2.0% for AGIs below $25k, 1.7% for AGIs $25k-50k, 4.9% for AGIs $50k-75k)
Total itemized deductions: $15,500 (20% of AGI, reported on 14.5% of returns)
Here:
$15,500
State:
$23,538
Here:
19.8% of AGI
State:
18.4% of AGI
(% of AGI for various income ranges: 9.4% for AGIs below $25k, 2.9% for AGIs $50k-75k, 7.9% for AGIs $75k-100k, 8.9% for AGIs $100k-200k)
Charity contributions: $2,417 (reported on 7.2% of returns)
Here:
$2,417
State:
$4,025
Taxes paid: $5,233 (reported on 14.5% of returns)
15428:
$5,233
State:
$9,982
(% of AGI for various income ranges: 1.6% for AGIs below $25k, 1.0% for AGIs $50k-75k, 3.0% for AGIs $75k-100k, 3.6% for AGIs $100k-200k)
Earned income credit: $2,400 (reported on 14.5% of returns)
Here:
$2,400
State:
$2,106
(% of AGI for various income ranges: 5.4% for AGIs below $25k, 0.7% for AGIs $25k-50k)
Percentage of individuals using paid preparers for their 2012 taxes: 62.7%
Here:
63%
State:
53%
(% for various income ranges: 57.6% for AGIs below $25k, 60.9% for AGIs $25k-50k, 64.3% for AGIs $50k-75k, 71.4% for AGIs $75k-100k, 83.3% for AGIs $100k-200k)
Averages for the 2004 tax year for zip code 15428, filed in 2005:
Average Adjusted Gross Income (AGI) in 2004: $31,531 (Individual Income Tax Returns)
Here:
$31,531
State:
$48,049
Salary/wage: $30,036 (reported on 81.9% of returns)
Here:
$30,036
State:
$42,646
(% of AGI for various income ranges: 75.2% for AGIs below $10k, 69.5% for AGIs $10k-25k, 81.8% for AGIs $25k-50k, 86.2% for AGIs $50k-75k, 73.5% for AGIs $75k-100k, 61.9% for AGIs over 100k)
Taxable interest for individuals: $808 (reported on 41.9% of returns)
This zip code:
$808
Pennsylvania:
$1,657
(% of AGI for various income ranges: 2.9% for AGIs below $10k, 1.8% for AGIs $10k-25k, 0.8% for AGIs $25k-50k, 0.5% for AGIs $50k-75k, 1.2% for AGIs $75k-100k, 1.4% for AGIs over 100k)
Taxable dividends: $431 (reported on 14.5% of returns)
Here:
$431
State:
$3,566
(% of AGI for various income ranges: 0.2% for AGIs below $10k, 0.3% for AGIs $10k-25k, 0.2% for AGIs $25k-50k, 0.2% for AGIs $50k-75k, 0.1% for AGIs $75k-100k, 0.1% for AGIs over 100k)
Profit/loss from business: +$4,828 (reported on 11.0% of returns)
Here:
+$4,828
State:
+$14,267
(% of AGI for various income ranges: 7.1% for AGIs below $10k, 3.7% for AGIs $10k-25k, 2.2% for AGIs $25k-50k, 0.6% for AGIs $50k-75k)
IRA payment deduction: $2,667 (reported on 3.9% of returns)
15428:
$2,667
Pennsylvania:
$2,903
Total itemized deductions: $13,921 (23% of AGI, reported on 10.5% of returns)
Here:
$13,921
State:
$18,804
Here:
22.7% of AGI
State:
19.5% of AGI
(% of AGI for various income ranges: 2.8% for AGIs $10k-25k, 3.8% for AGIs $25k-50k, 5.4% for AGIs $50k-75k, 12.0% for AGIs $75k-100k)
Charity contributions deductions: $1,529 (2% of AGI, reported on 8.0% of returns)
Here:
$1,529
State:
$3,337
Here:
2.4% of AGI
State:
3.3% of AGI
Total tax: $3,377 (reported on 75.2% of returns)
15428:
$3,377
State:
$8,008
(% of AGI for various income ranges: 1.9% for AGIs below $10k, 4.1% for AGIs $10k-25k, 6.3% for AGIs $25k-50k, 8.6% for AGIs $50k-75k, 12.4% for AGIs $75k-100k, 16.7% for AGIs over 100k)
Earned income credit: $1,735 (reported on 15.6% of returns)
Here:
$1,735
State:
$1,643
Percentage of individuals using paid preparers for their 2004 taxes: 59.4%
Here:
59%
State:
56%
(% for various income ranges: 48.0% for AGIs below $10k, 63.7% for AGIs $10k-25k, 56.9% for AGIs $25k-50k, 64.6% for AGIs $50k-75k, 73.7% for AGIs $75k-100k, 66.7% for AGIs over 100k)
Household received Food Stamps/SNAP in the past 12 months: 113 Household did not receive Food Stamps/SNAP in the past 12 months: 627
Women who had a birth in the past 12 months: 9 (7 now married, 1 unmarried) Women who did not have a birth in the past 12 months: 380 (217 now married, 161 unmarried)
Housing units in zip code 15428 with a mortgage: 273 (17 second mortgage, 17 both second mortgage and home equity loan) Houses without a mortgage: 35
Median monthly owner costs for units with a mortgage: $1,255 Median monthly owner costs for units without a mortgage: $473
Residents with income below the poverty level in 2022:
This zip code:
8.3%
Whole state:
11.8%
Residents with income below 50% of the poverty level in 2022:
This zip code:
3.0%
Whole state:
6.1%
Median number of rooms in houses and condos:
Here:
6.0
State:
6.8
Median number of rooms in apartments:
Here:
6.1
State:
4.3
Notable locations in this zip code not listed on our city pages
Size of family households: 219 2-persons, 93 3-persons, 135 4-persons, 27 5-persons, 18 6-persons, 10 7-or-more-persons
Size of nonfamily households: 193 1-person, 38 2-persons
352 married couples with children.
55 single-parent households (42 men, 13 women).
98.2% of residents of 15428 zip code speak English at home.
1.1% of residents speak Spanish at home (26% very well, 63% well, 11% not well).
0.1% of residents speak other Indo-European language at home (100% very well).
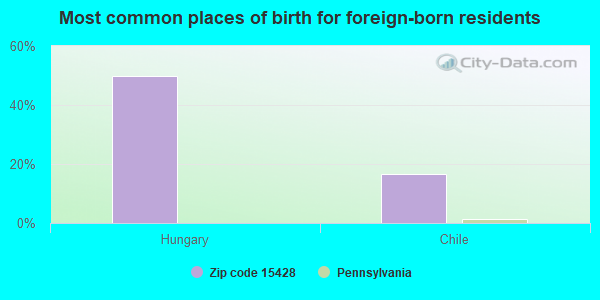
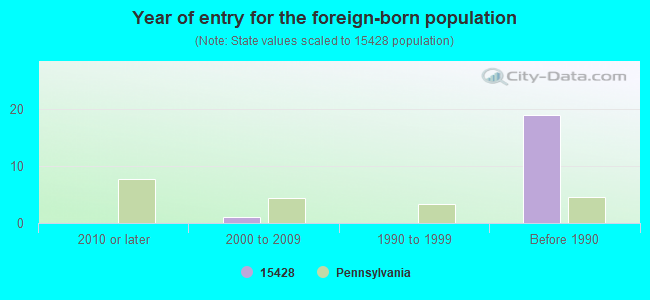
Foreign born population: 6 (0.3%) (100.0% of them are naturalized citizens)
This zip code:
0.3%
Whole state:
7.5%
50%Hungary
17%Chile
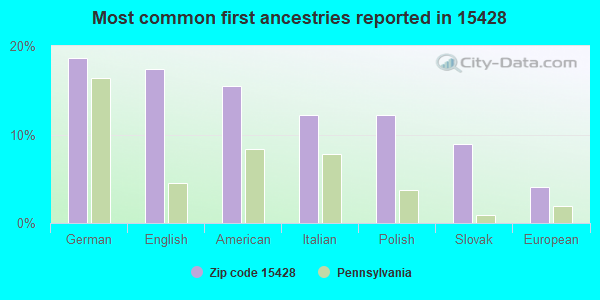
19%German
17%English
16%American
12%Italian
12%Polish
9%Slovak
4%European
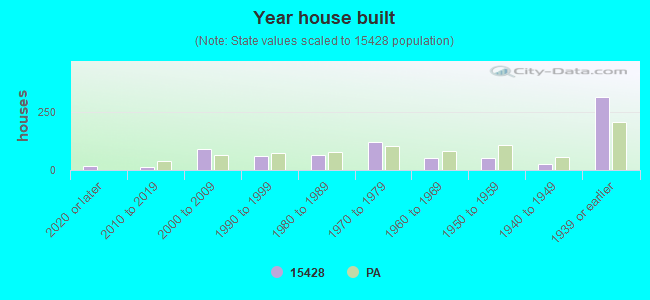
Year of entry for the foreign-born population
02010 or later
12000 to 2009
01990 to 1999
19Before 1990
Facilities with environmental interests located in this zip code:
BURKARTS BODY SHOP (RT 819 RD 1 BOX 19428 in DAWSON, PA)
Conditionally Exempt Small Quantity Generators, less than 100 kg/month of hazardous waste (Resource Conservation and Recovery Act (tracking hazardous waste)) - notification Organizations: BURKART KARL (CONTACT/OWNER)
Housing units lacking complete plumbing facilities: 7.3% Housing units lacking complete kitchen facilities: 4.5%
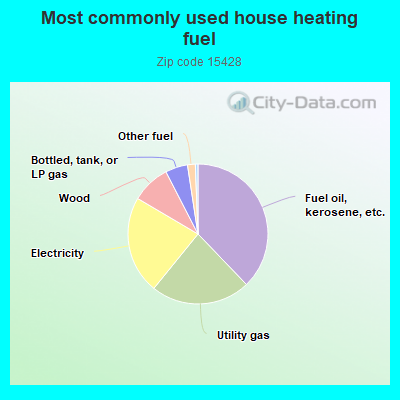
38.0%Fuel oil, kerosene, etc.
23.1%Utility gas
22.7%Electricity
9.0%Wood
5.2%Bottled, tank, or LP gas
1.8%Other fuel
0.6%Coal or coke
Population in 1990: 1,673. Population change in the 1990s: +263 (+15.7%).
Place of birth for U.S.-born residents:
This state: 1,646
Northeast: 27
Midwest: 38
South: 70
West: 17
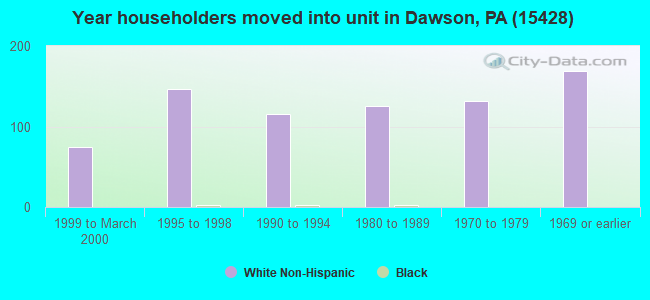
78% of the 15428 zip code residents lived in the same house 5 years ago. Out of people who lived in different houses, 68% lived in this county. Out of people who lived in different counties, 50% lived in Pennsylvania.
98% of the 15428 zip code residents lived in the same house 1 year ago. Out of people who lived in different houses, 112% moved from this county.
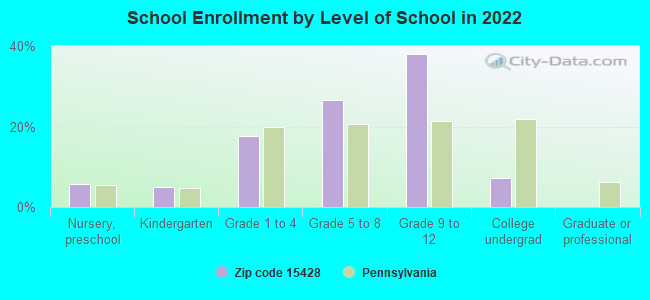
Private vs. public school enrollment:
Students in private schools in grades 1 to 8 (elementary and middle school): 5
Here:
3.0%
Pennsylvania:
15.7%
Students in private schools in grades 9 to 12 (high school): 2
Here:
1.8%
Pennsylvania:
13.4%
Students in private undergraduate colleges:
Here:
0.0%
Pennsylvania:
39.8%
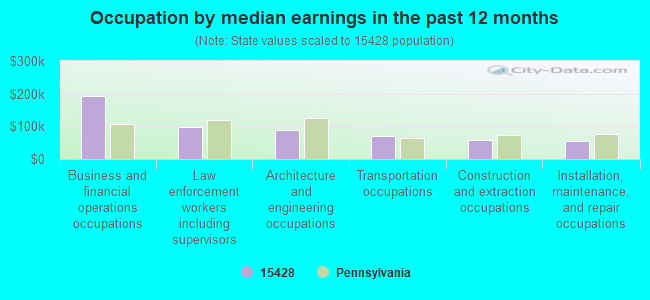
Occupation by median earnings in the past 12 months ($)
193,196Business and financial operations occupations
99,484Law enforcement workers including supervisors
87,256Architecture and engineering occupations
70,322Transportation occupations
58,758Construction and extraction occupations
55,614Installation, maintenance, and repair occupations
Top industries in this zip code by the number of employees in 2005:
Accommodation and Food Services: Hotels (except Casino Hotels) and Motels (10-19 employees: 1 establishment)
Construction: Residential Remodelers (1-4: 2)
Arts, Entertainment, and Recreation: Musical Groups and Artists (1-4: 1)
Construction: Site Preparation Contractors (1-4: 1)
Other Services (except Public Administration): Automotive Body, Paint, and Interior Repair and Maintenance (1-4: 1)
Accommodation and Food Services: Drinking Places (Alcoholic Beverages) (1-4: 1)
Home Mortgage Disclosure Act Aggregated Statistics For Year 2009 (Based on 6 partial tracts)
A) FHA, FSA/RHS & VA Home Purchase Loans
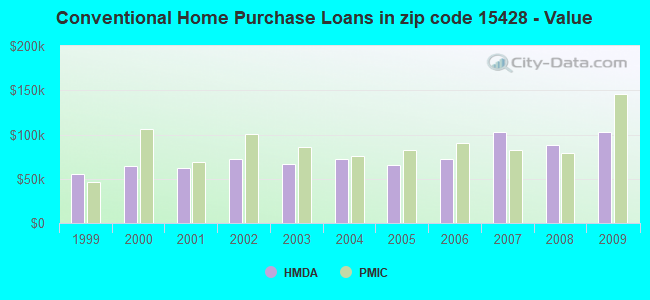
B) Conventional Home Purchase Loans
C) Refinancings
D) Home Improvement Loans
F) Non-occupant Loans on < 5 Family Dwellings (A B C & D)
G) Loans On Manufactured Home Dwelling (A B C & D)
Number
Average Value
Number
Average Value
Number
Average Value
Number
Average Value
Number
Average Value
Number
Average Value
LOANS ORIGINATED
16
$72,222
16
$102,945
70
$115,084
15
$36,494
3
$48,983
0
$0
APPLICATIONS APPROVED, NOT ACCEPTED
3
$64,157
0
$0
7
$107,043
2
$107,110
0
$0
1
$96,650
APPLICATIONS DENIED
4
$78,315
11
$97,180
41
$125,619
16
$27,192
3
$52,877
2
$75,535
APPLICATIONS WITHDRAWN
2
$39,440
0
$0
10
$146,007
4
$25,888
0
$0
0
$0
FILES CLOSED FOR INCOMPLETENESS
0
$0
0
$0
5
$146,572
0
$0
0
$0
0
$0
Aggregated Statistics For Year 2008 (Based on 6 partial tracts)
A) FHA, FSA/RHS & VA Home Purchase Loans
B) Conventional Home Purchase Loans
C) Refinancings
D) Home Improvement Loans
F) Non-occupant Loans on < 5 Family Dwellings (A B C & D)
G) Loans On Manufactured Home Dwelling (A B C & D)
Number
Average Value
Number
Average Value
Number
Average Value
Number
Average Value
Number
Average Value
Number
Average Value
LOANS ORIGINATED
13
$72,162
19
$88,045
59
$96,527
29
$38,943
3
$101,050
4
$83,668
APPLICATIONS APPROVED, NOT ACCEPTED
2
$69,845
6
$46,983
13
$77,796
6
$40,482
2
$35,395
3
$57,177
APPLICATIONS DENIED
2
$57,525
13
$51,095
59
$71,614
23
$28,980
1
$39,760
4
$38,540
APPLICATIONS WITHDRAWN
3
$67,840
4
$94,068
15
$115,041
3
$10,553
0
$0
0
$0
FILES CLOSED FOR INCOMPLETENESS
0
$0
1
$87,620
12
$100,176
0
$0
0
$0
1
$46,390
Aggregated Statistics For Year 2007 (Based on 6 partial tracts)
A) FHA, FSA/RHS & VA Home Purchase Loans
B) Conventional Home Purchase Loans
C) Refinancings
D) Home Improvement Loans
F) Non-occupant Loans on < 5 Family Dwellings (A B C & D)
G) Loans On Manufactured Home Dwelling (A B C & D)
Number
Average Value
Number
Average Value
Number
Average Value
Number
Average Value
Number
Average Value
Number
Average Value
LOANS ORIGINATED
11
$81,048
61
$102,574
80
$89,346
29
$33,683
9
$35,752
6
$65,238
APPLICATIONS APPROVED, NOT ACCEPTED
0
$0
10
$79,165
17
$65,625
13
$23,922
3
$48,033
2
$58,835
APPLICATIONS DENIED
2
$72,365
10
$44,303
86
$84,606
44
$37,951
5
$38,804
5
$69,692
APPLICATIONS WITHDRAWN
0
$0
8
$70,726
30
$83,233
6
$68,932
0
$0
0
$0
FILES CLOSED FOR INCOMPLETENESS
0
$0
0
$0
6
$115,918
3
$13,747
0
$0
0
$0
Aggregated Statistics For Year 2006 (Based on 6 partial tracts)
A) FHA, FSA/RHS & VA Home Purchase Loans
B) Conventional Home Purchase Loans
C) Refinancings
D) Home Improvement Loans
F) Non-occupant Loans on < 5 Family Dwellings (A B C & D)
G) Loans On Manufactured Home Dwelling (A B C & D)
Number
Average Value
Number
Average Value
Number
Average Value
Number
Average Value
Number
Average Value
Number
Average Value
LOANS ORIGINATED
8
$73,101
72
$71,991
101
$78,061
32
$26,460
11
$51,277
9
$55,679
APPLICATIONS APPROVED, NOT ACCEPTED
0
$0
14
$71,371
29
$78,698
9
$47,073
4
$37,788
4
$42,360
APPLICATIONS DENIED
4
$118,872
33
$58,387
118
$68,542
32
$29,238
5
$47,614
6
$58,210
APPLICATIONS WITHDRAWN
0
$0
5
$106,466
29
$89,280
4
$31,795
0
$0
3
$98,860
FILES CLOSED FOR INCOMPLETENESS
0
$0
3
$53,490
14
$131,229
0
$0
0
$0
0
$0
Aggregated Statistics For Year 2005 (Based on 6 partial tracts)
A) FHA, FSA/RHS & VA Home Purchase Loans
B) Conventional Home Purchase Loans
C) Refinancings
D) Home Improvement Loans
F) Non-occupant Loans on < 5 Family Dwellings (A B C & D)
G) Loans On Manufactured Home Dwelling (A B C & D)
Number
Average Value
Number
Average Value
Number
Average Value
Number
Average Value
Number
Average Value
Number
Average Value
LOANS ORIGINATED
7
$71,910
65
$65,170
96
$82,886
26
$38,248
19
$43,231
8
$59,735
APPLICATIONS APPROVED, NOT ACCEPTED
3
$56,270
5
$61,166
25
$74,214
5
$38,658
1
$83,490
6
$47,963
APPLICATIONS DENIED
2
$59,795
28
$48,511
121
$70,346
40
$32,476
3
$43,860
27
$44,488
APPLICATIONS WITHDRAWN
0
$0
9
$100,269
33
$88,198
9
$81,714
3
$61,613
3
$112,967
FILES CLOSED FOR INCOMPLETENESS
0
$0
0
$0
8
$54,988
0
$0
0
$0
0
$0
Aggregated Statistics For Year 2004 (Based on 6 partial tracts)
A) FHA, FSA/RHS & VA Home Purchase Loans
B) Conventional Home Purchase Loans
C) Refinancings
D) Home Improvement Loans
E) Loans on Dwellings For 5+ Families
F) Non-occupant Loans on < 5 Family Dwellings (A B C & D)
G) Loans On Manufactured Home Dwelling (A B C & D)
Number
Average Value
Number
Average Value
Number
Average Value
Number
Average Value
Number
Average Value
Number
Average Value
Number
Average Value
LOANS ORIGINATED
0
$0
50
$72,165
117
$63,933
44
$25,202
1
$27,580
2
$47,685
9
$49,334
APPLICATIONS APPROVED, NOT ACCEPTED
1
$97,930
8
$55,686
24
$68,825
11
$21,815
0
$0
1
$10,310
3
$42,533
APPLICATIONS DENIED
1
$76,030
19
$46,629
141
$72,188
38
$22,034
0
$0
3
$17,747
14
$36,774
APPLICATIONS WITHDRAWN
0
$0
8
$74,718
50
$78,533
5
$28,176
0
$0
4
$28,200
2
$42,660
FILES CLOSED FOR INCOMPLETENESS
0
$0
1
$88,860
18
$92,141
0
$0
0
$0
0
$0
0
$0
Aggregated Statistics For Year 2003 (Based on 6 partial tracts)
A) FHA, FSA/RHS & VA Home Purchase Loans
B) Conventional Home Purchase Loans
C) Refinancings
D) Home Improvement Loans
F) Non-occupant Loans on < 5 Family Dwellings (A B C & D)
Number
Average Value
Number
Average Value
Number
Average Value
Number
Average Value
Number
Average Value
LOANS ORIGINATED
4
$102,240
47
$66,397
179
$71,664
59
$29,016
7
$30,446
APPLICATIONS APPROVED, NOT ACCEPTED
0
$0
8
$95,656
45
$69,286
15
$29,046
0
$0
APPLICATIONS DENIED
0
$0
20
$52,229
147
$64,497
45
$14,222
7
$43,056
APPLICATIONS WITHDRAWN
1
$143,030
8
$85,972
67
$65,686
6
$42,642
0
$0
FILES CLOSED FOR INCOMPLETENESS
1
$56,700
0
$0
10
$55,061
2
$8,275
0
$0
Aggregated Statistics For Year 2002 (Based on 4 partial tracts)
A) FHA, FSA/RHS & VA Home Purchase Loans
B) Conventional Home Purchase Loans
C) Refinancings
D) Home Improvement Loans
F) Non-occupant Loans on < 5 Family Dwellings (A B C & D)
Number
Average Value
Number
Average Value
Number
Average Value
Number
Average Value
Number
Average Value
LOANS ORIGINATED
6
$84,305
44
$72,122
149
$66,134
30
$26,408
9
$53,438
APPLICATIONS APPROVED, NOT ACCEPTED
0
$0
9
$39,038
43
$66,612
7
$34,044
1
$32,940
APPLICATIONS DENIED
2
$42,190
26
$54,879
106
$62,577
34
$15,155
3
$26,523
APPLICATIONS WITHDRAWN
0
$0
9
$70,109
59
$67,350
4
$24,832
0
$0
FILES CLOSED FOR INCOMPLETENESS
0
$0
2
$43,670
12
$50,433
0
$0
1
$70,870
Aggregated Statistics For Year 2001 (Based on 4 partial tracts)
A) FHA, FSA/RHS & VA Home Purchase Loans
B) Conventional Home Purchase Loans
C) Refinancings
D) Home Improvement Loans
F) Non-occupant Loans on < 5 Family Dwellings (A B C & D)
Number
Average Value
Number
Average Value
Number
Average Value
Number
Average Value
Number
Average Value
LOANS ORIGINATED
8
$61,026
38
$61,834
142
$59,064
36
$26,619
1
$213,910
APPLICATIONS APPROVED, NOT ACCEPTED
1
$78,600
13
$42,164
40
$44,814
21
$17,916
2
$13,355
APPLICATIONS DENIED
1
$92,780
37
$38,377
120
$55,154
44
$13,039
2
$48,830
APPLICATIONS WITHDRAWN
0
$0
7
$47,966
57
$67,290
16
$20,862
1
$96,650
FILES CLOSED FOR INCOMPLETENESS
0
$0
0
$0
4
$40,732
0
$0
0
$0
Aggregated Statistics For Year 2000 (Based on 4 partial tracts)
A) FHA, FSA/RHS & VA Home Purchase Loans
B) Conventional Home Purchase Loans
C) Refinancings
D) Home Improvement Loans
E) Loans on Dwellings For 5+ Families
F) Non-occupant Loans on < 5 Family Dwellings (A B C & D)
Number
Average Value
Number
Average Value
Number
Average Value
Number
Average Value
Number
Average Value
Number
Average Value
LOANS ORIGINATED
8
$50,470
40
$64,238
63
$53,266
32
$18,552
1
$34,790
2
$51,570
APPLICATIONS APPROVED, NOT ACCEPTED
2
$63,745
4
$56,712
22
$59,040
7
$18,333
0
$0
0
$0
APPLICATIONS DENIED
0
$0
32
$47,394
65
$57,018
26
$15,215
0
$0
1
$10,720
APPLICATIONS WITHDRAWN
0
$0
6
$34,558
25
$51,745
1
$56,700
0
$0
1
$34,470
FILES CLOSED FOR INCOMPLETENESS
0
$0
3
$50,610
2
$46,020
0
$0
0
$0
0
$0
Aggregated Statistics For Year 1999 (Based on 2 partial tracts)
A) FHA, FSA/RHS & VA Home Purchase Loans
B) Conventional Home Purchase Loans
C) Refinancings
D) Home Improvement Loans
F) Non-occupant Loans on < 5 Family Dwellings (A B C & D)


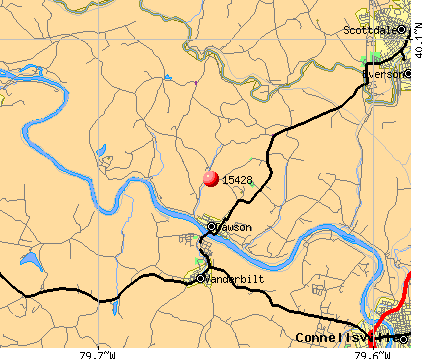 Nearest zip codes: 15430, 15486, 15479, 15448, 15683, 15482.