Estimated zip code population in 2022: 809 Zip code population in 2010: 955 Zip code population in 2000: 897
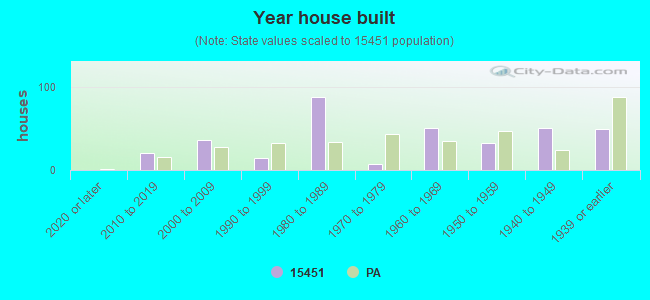
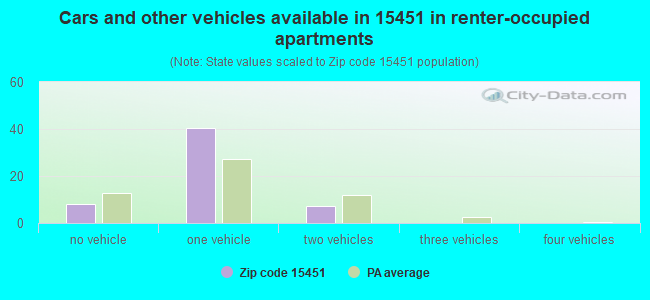
Houses and condos: 350 Renter-occupied apartments: 55
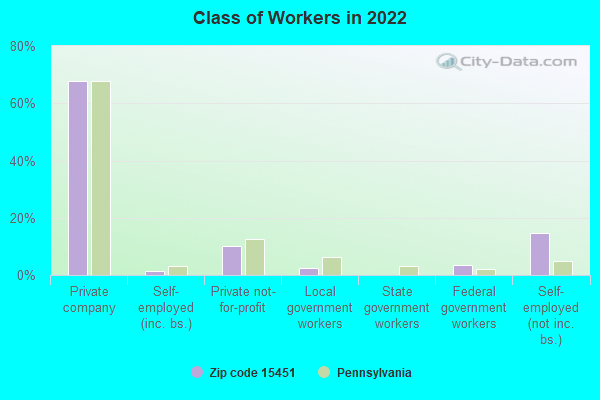
% of renters here:
16%
State:
31%
March 2022 cost of living index in zip code 15451: 88.2 (less than average, U.S. average is 100)
Land area: 10.2 sq. mi. Water area: 0.1 sq. mi.
Population density: 80 people per square mile
(very low).
OSM Map
General Map
Google Map
MSN Map
OSM Map
General Map
Google Map
MSN Map
OSM Map
General Map
Google Map
MSN Map
OSM Map
General Map
Google Map
MSN Map
Please wait while loading the map...
Real estate property taxes paid for housing units in 2022:
This zip code:
1.2% ($1,307)
Pennsylvania:
1.3% ($3,094)
Median real estate property taxes paid for housing units with mortgages in 2022: $1,274 Median real estate property taxes paid for housing units with no mortgage in 2022: $1,356
Business Search- 14 Million verified businesses
Males: 418
(51.6%)
Females: 391
(48.4%)
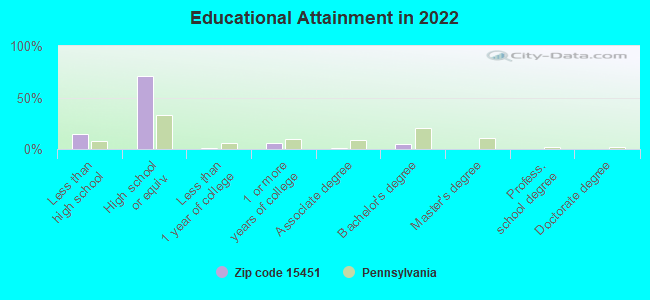
For population 25 years and over in 15451:
High school or higher: 82.1%
Bachelor's degree or higher: 5.2%
Graduate or professional degree: 0.0%
Unemployed: 4.2%
Mean travel time to work (commute): 13.6 minutes
For population 15 years and over in 15451:
Never married: 12.2%
Now married: 65.2%
Separated: 0.0%
Widowed: 16.8%
Divorced: 5.8%
Zip code 15451 compared to state average:
Median household income below state average.
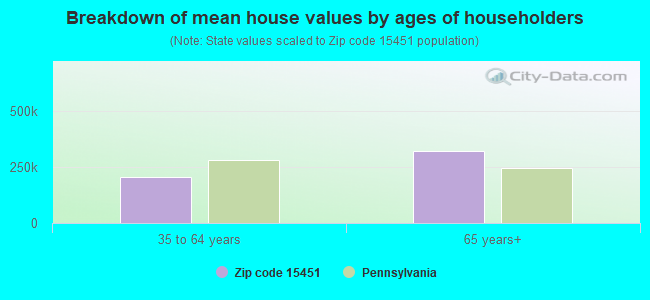
Median house value below state average.
Black race population percentage significantly below state average.
Hispanic race population percentage significantly below state average.
Median age significantly above state average.
Foreign-born population percentage significantly below state average.
Renting percentage below state average.
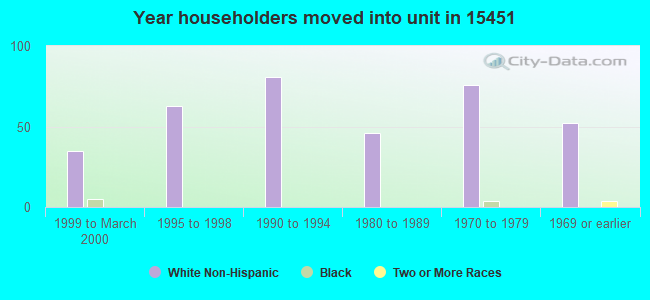
Length of stay since moving in significantly above state average.
Number of college students significantly below state average.
Percentage of population with a bachelor's degree or higher significantly below state average.
Estimated median house/condo value in 2022: $113,525
15451:
$113,525
Pennsylvania:
$245,500
According to our research of Pennsylvania and other state lists, there were 2 registered sex offenders living in 15451 zip code as of May 20, 2024. The ratio of all residents to sex offenders in zip code 15451 is 601 to 1. The ratio of registered sex offenders to all residents in this zip code is near the state average.
Median resident age:
This zip code:
50.3 years
Pennsylvania median age:
40.9 years
Average household size:
This zip code:
2.3 people
Pennsylvania:
2.4 people
Averages for the 2020 tax year for zip code 15451, filed in 2021:
Average Adjusted Gross Income (AGI) in 2020: $49,556 (Individual Income Tax Returns)
Here:
$49,556
State:
$75,707
Salary/wage: $44,304 (reported on 77.8% of returns)
Here:
$44,304
State:
$62,806
(% of AGI for various income ranges: 904.4% for AGIs below $25k, 2803.8% for AGIs $25k-50k, 4654.3% for AGIs $50k-75k, 14686.7% for AGIs $100k-200k)
Taxable interest for individuals: $889 (reported on 25.0% of returns)
This zip code:
$889
Pennsylvania:
$1,633
(% of AGI for various income ranges: 2.2% for AGIs below $25k, 14.3% for AGIs $50k-75k, 226.7% for AGIs $100k-200k)
Ordinary dividends: $1,700 (reported on 8.3% of returns)
Here:
$1,700
State:
$7,382
(% of AGI for various income ranges: 72.9% for AGIs $50k-75k)
Net capital gain/loss in AGI: +$7,833 (reported on 8.3% of returns)
Here:
+$7,833
State:
+$23,522
(% of AGI for various income ranges: 335.7% for AGIs $50k-75k)
Profit/loss from business: +$10,850 (reported on 5.6% of returns)
Here:
+$10,850
State:
+$16,274
(% of AGI for various income ranges: 241.1% for AGIs below $25k)
Taxable individual retirement arrangement distribution: $15,000 (reported on 8.3% of returns)
15451:
$15,000
Pennsylvania:
$18,583
(% of AGI for various income ranges: 642.9% for AGIs $50k-75k)
Earned income credit: $2,600 (reported on 13.9% of returns)
Here:
$2,600
State:
$2,100
(% of AGI for various income ranges: 87.8% for AGIs below $25k, 63.7% for AGIs $25k-50k)
Percentage of individuals using paid preparers for their 2020 taxes: 94.4%
Here:
94%
State:
92%
(% for various income ranges: 91.7% for AGIs below $25k, 100.0% for AGIs $25k-50k, 100.0% for AGIs $50k-75k, 66.7% for AGIs $75k-100k, 100.0% for AGIs $100k-200k)
Averages for the 2012 tax year for zip code 15451, filed in 2013:
Average Adjusted Gross Income (AGI) in 2012: $43,809 (Individual Income Tax Returns)
Here:
$43,809
State:
$61,346
Salary/wage: $38,566 (reported on 87.9% of returns)
Here:
$38,566
State:
$51,902
(% of AGI for various income ranges: 74.9% for AGIs below $25k, 73.8% for AGIs $25k-50k, 88.5% for AGIs $50k-75k, 87.9% for AGIs $75k-100k, 63.5% for AGIs $100k-200k)
Taxable interest for individuals: $443 (reported on 21.2% of returns)
This zip code:
$443
Pennsylvania:
$1,588
Ordinary dividends: $600 (reported on 6.1% of returns)
Here:
$600
State:
$5,827
Profit/loss from business: +$6,233 (reported on 9.1% of returns)
Here:
+$6,233
State:
+$16,268
Total itemized deductions: $17,475 (21% of AGI, reported on 12.1% of returns)
Here:
$17,475
State:
$23,538
Here:
20.8% of AGI
State:
18.4% of AGI
Charity contributions: $3,433 (reported on 9.1% of returns)
Here:
$3,433
State:
$4,025
Taxes paid: $4,600 (reported on 12.1% of returns)
15451:
$4,600
State:
$9,982
Earned income credit: $2,543 (reported on 21.2% of returns)
Here:
$2,543
State:
$2,106
(% of AGI for various income ranges: 10.2% for AGIs below $25k)
Percentage of individuals using paid preparers for their 2012 taxes: 45.5%
Here:
45%
State:
53%
(% for various income ranges: 46.2% for AGIs below $25k, 50.0% for AGIs $25k-50k, 33.3% for AGIs $50k-75k, 100.0% for AGIs $75k-100k)
Averages for the 2004 tax year for zip code 15451, filed in 2005:
Average Adjusted Gross Income (AGI) in 2004: $33,475 (Individual Income Tax Returns)
Here:
$33,475
State:
$48,049
Salary/wage: $30,981 (reported on 88.5% of returns)
Here:
$30,981
State:
$42,646
(% of AGI for various income ranges: 80.3% for AGIs below $10k, 76.1% for AGIs $10k-25k, 84.2% for AGIs $25k-50k, 85.3% for AGIs $50k-75k, 80.1% for AGIs $75k-100k)
Taxable interest for individuals: $918 (reported on 31.8% of returns)
This zip code:
$918
Pennsylvania:
$1,657
(% of AGI for various income ranges: 1.5% for AGIs $10k-25k, 1.3% for AGIs $25k-50k, 0.1% for AGIs $50k-75k, 0.6% for AGIs $75k-100k)
Taxable dividends: $194 (reported on 10.2% of returns)
Here:
$194
State:
$3,566
Profit/loss from business: +$4,257 (reported on 11.5% of returns)
Here:
+$4,257
State:
+$14,267
Total itemized deductions: $14,647 (22% of AGI, reported on 11.1% of returns)
Here:
$14,647
State:
$18,804
Here:
21.8% of AGI
State:
19.5% of AGI
Charity contributions deductions: $2,042 (3% of AGI, reported on 7.9% of returns)
Here:
$2,042
State:
$3,337
Here:
3.0% of AGI
State:
3.3% of AGI
Total tax: $3,703 (reported on 71.8% of returns)
15451:
$3,703
State:
$8,008
(% of AGI for various income ranges: 1.9% for AGIs below $10k, 4.0% for AGIs $10k-25k, 5.8% for AGIs $25k-50k, 9.1% for AGIs $50k-75k, 12.5% for AGIs $75k-100k)
Earned income credit: $1,852 (reported on 20.0% of returns)
Here:
$1,852
State:
$1,643
Percentage of individuals using paid preparers for their 2004 taxes: 51.5%
Here:
51%
State:
56%
(% for various income ranges: 48.3% for AGIs below $10k, 55.7% for AGIs $10k-25k, 46.3% for AGIs $25k-50k, 48.5% for AGIs $50k-75k, 65.5% for AGIs $75k-100k)
Size of family households: 101 2-persons, 41 3-persons, 9 5-persons, 49 6-persons
Size of nonfamily households: 135 1-person, 17 2-persons
44 married couples with children.
0 single-parent households ().
99.1% of residents of 15451 zip code speak English at home.
Foreign born population: 0 (0.0%)
:
0.0%
Whole state:
7.5%
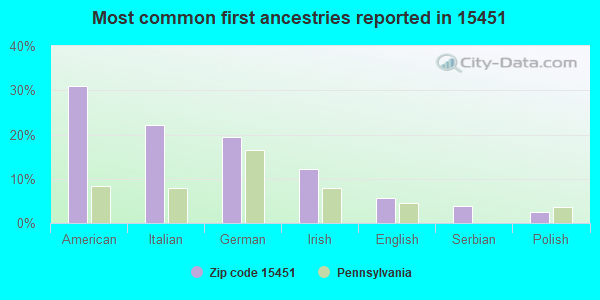
31%American
22%Italian
19%German
12%Irish
6%English
4%Serbian
2%Polish
Housing units lacking complete plumbing facilities: 2.7% Housing units lacking complete kitchen facilities: 2.9%
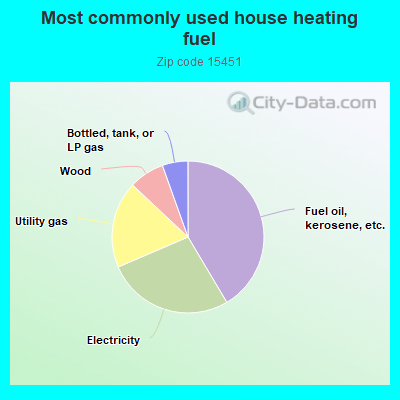
41.8%Fuel oil, kerosene, etc.
27.3%Electricity
18.6%Utility gas
7.6%Wood
5.5%Bottled, tank, or LP gas
Population in 1990: 2,217.
Place of birth for U.S.-born residents:
This state: 514
Midwest: 53
South: 243
71% of the 15451 zip code residents lived in the same house 5 years ago. Out of people who lived in different houses, 83% lived in this county. Out of people who lived in different counties, 50% lived in Pennsylvania.
100% of the 15451 zip code residents lived in the same house 1 year ago. Out of people who lived in different houses, 300% moved from this county.
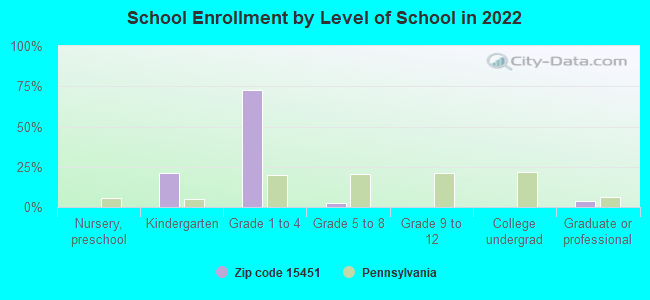
Private vs. public school enrollment:
Students in private schools in grades 1 to 8 (elementary and middle school):
Here:
0.0%
Pennsylvania:
15.7%
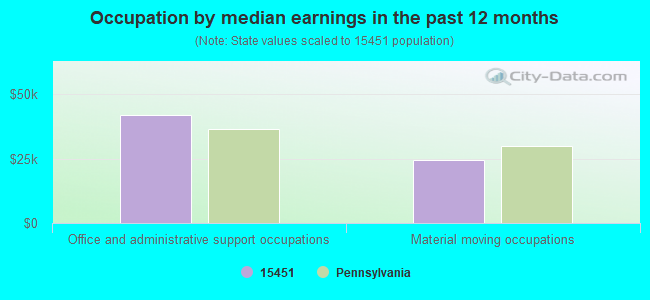
Occupation by median earnings in the past 12 months ($)
41,903Office and administrative support occupations
24,344Material moving occupations
Top industries in this zip code by the number of employees in 2005:
Utilities: Hydroelectric Power Generation (10-19 employees: 1 establishment)
Other Services (except Public Administration): Religious Organizations (1-4: 2)
Construction: Site Preparation Contractors (1-4: 1)
Construction: New Single-Family Housing Construction (except Operative Builders) (1-4: 1)
People in group quarters in 2000:
2 people in other noninstitutional group quarters
Fatal accident statistics in 2012:
Fatal accident count: 1
Vehicles involved in fatal accidents: 1
Fatal accidents caused by drunken drivers: 1
Fatalities: 1
Persons involved in fatal accidents: 1
Pedestrians involved in fatal accidents: 0
Home Mortgage Disclosure Act Aggregated Statistics For Year 2009 (Based on 2 partial tracts)
A) FHA, FSA/RHS & VA Home Purchase Loans
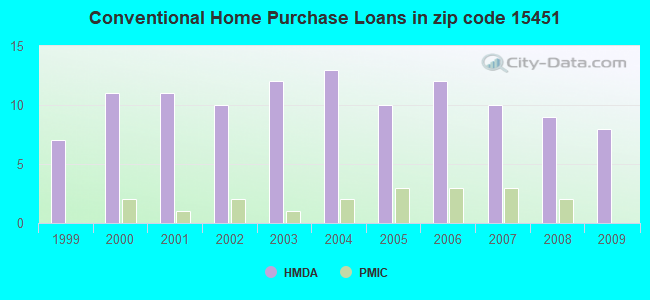
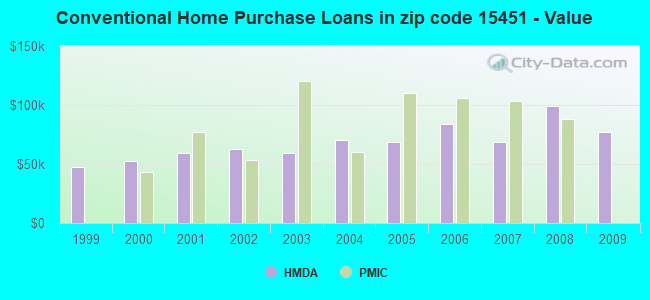
B) Conventional Home Purchase Loans
C) Refinancings
D) Home Improvement Loans
F) Non-occupant Loans on < 5 Family Dwellings (A B C & D)
G) Loans On Manufactured Home Dwelling (A B C & D)
Number
Average Value
Number
Average Value
Number
Average Value
Number
Average Value
Number
Average Value
Number
Average Value
LOANS ORIGINATED
2
$108,095
8
$77,192
16
$98,052
7
$30,786
0
$0
4
$72,752
APPLICATIONS APPROVED, NOT ACCEPTED
0
$0
0
$0
2
$73,440
1
$50,000
0
$0
0
$0
APPLICATIONS DENIED
1
$233,770
2
$56,375
8
$101,716
3
$38,387
0
$0
2
$81,545
APPLICATIONS WITHDRAWN
0
$0
3
$93,210
5
$108,406
1
$12,070
1
$11,720
0
$0
FILES CLOSED FOR INCOMPLETENESS
0
$0
0
$0
2
$187,570
0
$0
0
$0
0
$0
Aggregated Statistics For Year 2008 (Based on 2 partial tracts)
A) FHA, FSA/RHS & VA Home Purchase Loans
B) Conventional Home Purchase Loans
C) Refinancings
D) Home Improvement Loans
F) Non-occupant Loans on < 5 Family Dwellings (A B C & D)
G) Loans On Manufactured Home Dwelling (A B C & D)
Number
Average Value
Number
Average Value
Number
Average Value
Number
Average Value
Number
Average Value
Number
Average Value
LOANS ORIGINATED
2
$98,270
9
$99,494
16
$92,794
8
$29,696
2
$35,170
2
$47,755
APPLICATIONS APPROVED, NOT ACCEPTED
0
$0
2
$57,755
4
$97,578
0
$0
0
$0
2
$57,755
APPLICATIONS DENIED
1
$66,550
3
$92,407
19
$81,935
7
$55,169
1
$62,410
5
$73,512
APPLICATIONS WITHDRAWN
1
$58,960
2
$56,030
2
$141,715
1
$16,550
1
$29,310
0
$0
FILES CLOSED FOR INCOMPLETENESS
0
$0
0
$0
2
$97,060
0
$0
0
$0
0
$0
Aggregated Statistics For Year 2007 (Based on 2 partial tracts)
A) FHA, FSA/RHS & VA Home Purchase Loans
B) Conventional Home Purchase Loans
C) Refinancings
D) Home Improvement Loans
F) Non-occupant Loans on < 5 Family Dwellings (A B C & D)
G) Loans On Manufactured Home Dwelling (A B C & D)
Number
Average Value
Number
Average Value
Number
Average Value
Number
Average Value
Number
Average Value
Number
Average Value
LOANS ORIGINATED
1
$107,230
10
$68,546
14
$64,330
10
$31,825
2
$38,790
3
$81,143
APPLICATIONS APPROVED, NOT ACCEPTED
0
$0
3
$86,773
6
$84,763
2
$47,065
0
$0
3
$44,593
APPLICATIONS DENIED
0
$0
5
$53,238
24
$72,595
10
$46,789
1
$8,620
7
$52,903
APPLICATIONS WITHDRAWN
0
$0
2
$75,855
6
$83,040
2
$38,620
0
$0
0
$0
FILES CLOSED FOR INCOMPLETENESS
0
$0
0
$0
0
$0
0
$0
0
$0
0
$0
Aggregated Statistics For Year 2006 (Based on 2 partial tracts)
A) FHA, FSA/RHS & VA Home Purchase Loans
B) Conventional Home Purchase Loans
C) Refinancings
D) Home Improvement Loans
F) Non-occupant Loans on < 5 Family Dwellings (A B C & D)
G) Loans On Manufactured Home Dwelling (A B C & D)
Number
Average Value
Number
Average Value
Number
Average Value
Number
Average Value
Number
Average Value
Number
Average Value
LOANS ORIGINATED
1
$91,370
12
$84,246
17
$82,468
10
$29,825
2
$46,030
3
$48,960
APPLICATIONS APPROVED, NOT ACCEPTED
0
$0
2
$44,305
5
$63,306
2
$29,310
0
$0
1
$47,930
APPLICATIONS DENIED
0
$0
6
$82,522
36
$72,245
16
$30,666
3
$39,997
10
$66,443
APPLICATIONS WITHDRAWN
0
$0
2
$93,095
14
$86,003
1
$78,960
0
$0
1
$51,720
FILES CLOSED FOR INCOMPLETENESS
0
$0
1
$107,230
3
$99,417
0
$0
0
$0
0
$0
Aggregated Statistics For Year 2005 (Based on 2 partial tracts)
A) FHA, FSA/RHS & VA Home Purchase Loans
B) Conventional Home Purchase Loans
C) Refinancings
D) Home Improvement Loans
F) Non-occupant Loans on < 5 Family Dwellings (A B C & D)
G) Loans On Manufactured Home Dwelling (A B C & D)
Number
Average Value
Number
Average Value
Number
Average Value
Number
Average Value
Number
Average Value
Number
Average Value
LOANS ORIGINATED
1
$78,960
10
$68,684
24
$75,296
9
$28,350
1
$54,820
4
$44,135
APPLICATIONS APPROVED, NOT ACCEPTED
0
$0
3
$49,650
7
$55,070
1
$32,410
0
$0
2
$58,790
APPLICATIONS DENIED
0
$0
11
$46,391
43
$65,215
16
$29,243
3
$33,100
13
$42,968
APPLICATIONS WITHDRAWN
0
$0
0
$0
19
$78,742
2
$93,440
0
$0
2
$52,235
FILES CLOSED FOR INCOMPLETENESS
0
$0
0
$0
2
$135,335
0
$0
0
$0
0
$0
Aggregated Statistics For Year 2004 (Based on 2 partial tracts)
A) FHA, FSA/RHS & VA Home Purchase Loans
B) Conventional Home Purchase Loans
C) Refinancings
D) Home Improvement Loans
F) Non-occupant Loans on < 5 Family Dwellings (A B C & D)
G) Loans On Manufactured Home Dwelling (A B C & D)
Number
Average Value
Number
Average Value
Number
Average Value
Number
Average Value
Number
Average Value
Number
Average Value
LOANS ORIGINATED
1
$46,200
13
$70,631
29
$66,083
9
$30,112
4
$46,720
6
$52,582
APPLICATIONS APPROVED, NOT ACCEPTED
0
$0
2
$72,065
10
$63,236
2
$11,380
0
$0
1
$25,170
APPLICATIONS DENIED
0
$0
13
$59,703
53
$67,516
15
$34,664
4
$41,548
17
$59,042
APPLICATIONS WITHDRAWN
0
$0
4
$59,048
28
$64,711
1
$57,580
1
$81,030
4
$57,322
FILES CLOSED FOR INCOMPLETENESS
0
$0
0
$0
8
$88,182
0
$0
0
$0
0
$0
Aggregated Statistics For Year 2003 (Based on 2 partial tracts)
A) FHA, FSA/RHS & VA Home Purchase Loans
B) Conventional Home Purchase Loans
C) Refinancings
D) Home Improvement Loans
F) Non-occupant Loans on < 5 Family Dwellings (A B C & D)
Number
Average Value
Number
Average Value
Number
Average Value
Number
Average Value
Number
Average Value
LOANS ORIGINATED
2
$59,825
12
$59,421
41
$75,831
7
$23,741
2
$62,065
APPLICATIONS APPROVED, NOT ACCEPTED
0
$0
1
$41,030
10
$70,546
2
$18,445
0
$0
APPLICATIONS DENIED
0
$0
4
$55,858
34
$69,071
8
$18,576
1
$34,140
APPLICATIONS WITHDRAWN
1
$45,170
4
$23,360
29
$66,487
2
$22,240
2
$37,065
FILES CLOSED FOR INCOMPLETENESS
0
$0
1
$37,240
2
$66,030
1
$55,170
0
$0
Aggregated Statistics For Year 2002 (Based on 2 partial tracts)
A) FHA, FSA/RHS & VA Home Purchase Loans
B) Conventional Home Purchase Loans
C) Refinancings
D) Home Improvement Loans
F) Non-occupant Loans on < 5 Family Dwellings (A B C & D)
Number
Average Value
Number
Average Value
Number
Average Value
Number
Average Value
Number
Average Value
LOANS ORIGINATED
1
$50,690
10
$62,547
34
$64,894
8
$15,085
2
$22,585
APPLICATIONS APPROVED, NOT ACCEPTED
0
$0
1
$93,100
9
$64,899
1
$30,340
0
$0
APPLICATIONS DENIED
0
$0
7
$39,947
30
$55,007
3
$10,000
1
$40,000
APPLICATIONS WITHDRAWN
0
$0
3
$66,660
27
$71,157
2
$18,445
0
$0
FILES CLOSED FOR INCOMPLETENESS
0
$0
0
$0
3
$55,857
0
$0
0
$0
Aggregated Statistics For Year 2001 (Based on 2 partial tracts)
A) FHA, FSA/RHS & VA Home Purchase Loans
B) Conventional Home Purchase Loans
C) Refinancings
D) Home Improvement Loans
F) Non-occupant Loans on < 5 Family Dwellings (A B C & D)
Number
Average Value
Number
Average Value
Number
Average Value
Number
Average Value
Number
Average Value
LOANS ORIGINATED
1
$104,130
11
$59,525
24
$60,713
5
$29,790
2
$29,655
APPLICATIONS APPROVED, NOT ACCEPTED
0
$0
3
$47,927
9
$50,188
0
$0
1
$36,890
APPLICATIONS DENIED
0
$0
9
$45,973
30
$59,501
8
$17,068
2
$33,790
APPLICATIONS WITHDRAWN
0
$0
3
$42,180
15
$57,214
2
$10,860
0
$0
FILES CLOSED FOR INCOMPLETENESS
0
$0
0
$0
1
$63,790
0
$0
0
$0
Aggregated Statistics For Year 2000 (Based on 2 partial tracts)
A) FHA, FSA/RHS & VA Home Purchase Loans
B) Conventional Home Purchase Loans
C) Refinancings
D) Home Improvement Loans
F) Non-occupant Loans on < 5 Family Dwellings (A B C & D)
Number
Average Value
Number
Average Value
Number
Average Value
Number
Average Value
Number
Average Value
LOANS ORIGINATED
1
$111,370
11
$52,817
19
$35,405
8
$18,705
2
$24,480
APPLICATIONS APPROVED, NOT ACCEPTED
0
$0
4
$37,670
5
$77,580
3
$25,517
0
$0
APPLICATIONS DENIED
0
$0
16
$37,023
23
$52,365
5
$17,930
2
$37,930
APPLICATIONS WITHDRAWN
0
$0
2
$12,585
10
$45,962
1
$58,960
0
$0
FILES CLOSED FOR INCOMPLETENESS
0
$0
0
$0
2
$61,720
0
$0
0
$0
Aggregated Statistics For Year 1999 (Based on 1 partial tract)
A) FHA, FSA/RHS & VA Home Purchase Loans
B) Conventional Home Purchase Loans
C) Refinancings
D) Home Improvement Loans
F) Non-occupant Loans on < 5 Family Dwellings (A B C & D)

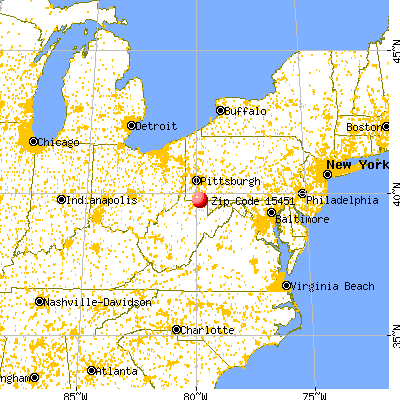


 Nearest zip codes: 15474, 15478, 15460, 15467, 15461, 15327.