Estimated zip code population in 2022: 225
Zip code population in 2010: 398
Zip code population in 2000: 413
March 2022 cost of living index in zip code 15462: 88.1
(less than average, U.S. average is 100)
Land area: 1.4
sq. mi.
Water area: 0.0
sq. mi.
| Population density: 159 people per square mile | | (very low). |
![Age and Sex of Residents in zip code 15462]()
- OSM Map
- General Map
- Google Map
- MSN Map
- OSM Map
- General Map
- Google Map
- MSN Map
- OSM Map
- General Map
- Google Map
- MSN Map
- OSM Map
- General Map
- Google Map
- MSN Map
Please wait while loading the map...
Real estate property taxes paid for housing units in 2022:
| This zip code: | 9.3% ($1,007) |
| Pennsylvania: | 1.3% ($3,094) |
Business Search - 14 Million verified businesses
| Males: 115 |  (51.3%) (51.3%) |
| Females: 109 |  (48.7%) (48.7%) |
For population 25 years and over in 15462:
- High school or higher: 66.8%
- Bachelor's degree or higher: 0.0%
- Graduate or professional degree: 0.0%
- Mean travel time to work (commute): 54.3 minutes
For population 15 years and over in 15462:
- Never married: 43.2%
- Now married: 23.0%
- Separated: 0.0%
- Widowed: 5.9%
- Divorced: 27.9%
Zip code 15462 compared to state average:
- Median household income significantly below state average.
- Median house value significantly below state average.
- Unemployed percentage significantly below state average.
- Black race population percentage significantly below state average.
- Hispanic race population percentage significantly below state average.
- Median age below state average.
- Foreign-born population percentage significantly below state average.
- Renting percentage significantly below state average.
- Length of stay since moving in significantly above state average.
- Percentage of population with a bachelor's degree or higher significantly below state average.
Data:
100%
rural population.
Estimated median house/condo value in 2022: $10,852
| 15462: | $10,852 |
| Pennsylvania: | $245,500 |
Median resident age:| This zip code: | 36.4 years |
| Pennsylvania median age: | 40.9 years |
Average household size:| This zip code: | 2.4 people |
| Pennsylvania: | 2.4 people |
Averages for the 2020 tax year for zip code 15462, filed in 2021:
Average Adjusted Gross Income (AGI) in 2020: $44,527 (Individual Income Tax Returns)
| Here: | $44,527 |
| State: | $75,707 |
Salary/wage: $37,279 (reported on 93.3% of returns)
| Here: | $37,279 |
| State: | $62,806 |
(% of AGI for various income ranges: 1106.0% for AGIs below $25k, 3247.5% for AGIs $25k-50k, 2617.5% for AGIs $50k-75k)
Earned income credit: $3,333 (reported on 20.0% of returns)
(% of AGI for various income ranges: 200.0% for AGIs below $25k)
Percentage of individuals using paid preparers for their 2020 taxes: 100.0%
(% for various income ranges: 100.0% for AGIs below $25k, 100.0% for AGIs $25k-50k, 100.0% for AGIs $50k-75k, 100.0% for AGIs $75k-100k)
Averages for the 2012 tax year for zip code 15462, filed in 2013:
Average Adjusted Gross Income (AGI) in 2012: $33,239 (Individual Income Tax Returns)
| Here: | $33,239 |
| State: | $61,346 |
Salary/wage: $29,365 (reported on 94.4% of returns)
| Here: | $29,365 |
| State: | $51,902 |
(% of AGI for various income ranges: 81.8% for AGIs below $25k, 80.6% for AGIs $25k-50k, 85.4% for AGIs $50k-75k)
Taxable interest for individuals: $133 (reported on 16.7% of returns)
| This zip code: | $133 |
| Pennsylvania: | $1,588 |
Earned income credit: $2,180 (reported on 27.8% of returns)
(% of AGI for various income ranges: 8.7% for AGIs below $25k)
Percentage of individuals using paid preparers for their 2012 taxes: 66.7%
(% for various income ranges: 60.0% for AGIs below $25k, 75.0% for AGIs $25k-50k, 75.0% for AGIs $50k-75k)
Averages for the 2004 tax year for zip code 15462, filed in 2005:
Average Adjusted Gross Income (AGI) in 2004: $22,048 (Individual Income Tax Returns)
| Here: | $22,048 |
| State: | $48,049 |
Salary/wage: $20,709 (reported on 83.6% of returns)
| Here: | $20,709 |
| State: | $42,646 |
(% of AGI for various income ranges: 68.4% for AGIs below $10k, 82.1% for AGIs $10k-25k, 77.5% for AGIs $25k-50k, 78.1% for AGIs $50k-75k)
Taxable interest for individuals: $372 (reported on 22.8% of returns)
| This zip code: | $372 |
| Pennsylvania: | $1,657 |
Taxable dividends: $2,000 (reported on 6.3% of returns)
Profit/loss from business: +$526 (reported on 10.1% of returns)
Total itemized deductions: $10,538 (25% of AGI, reported on 6.9% of returns)
| Here: | $10,538 |
| State: | $18,804 |
| Here: | 24.9% of AGI |
| State: | 19.5% of AGI |
Total tax: $2,000 (reported on 63.0% of returns)
(% of AGI for various income ranges: 2.4% for AGIs below $10k, 3.6% for AGIs $10k-25k, 6.1% for AGIs $25k-50k, 9.0% for AGIs $50k-75k)
Earned income credit: $1,964 (reported on 29.6% of returns)
Percentage of individuals using paid preparers for their 2004 taxes: 68.3%
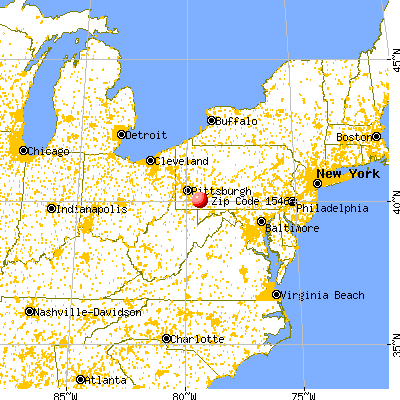
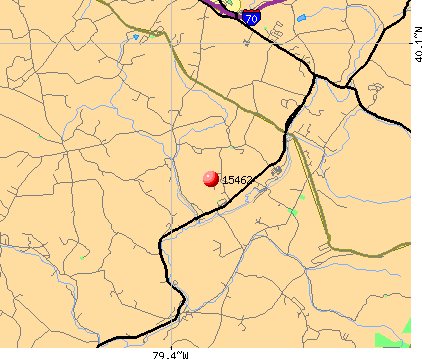
![15462 map]() Nearest zip codes: 15628
Nearest zip codes: 15628,
15446,
15622,
15646,
15469,
15490.
Percentage of family households:| This zip code: | 21.7% |
| Pennsylvania: | 42.6% |
Percentage of households with unmarried partners:| This zip code: | 0.0% |
| Pennsylvania: | 46.5% |
No gay or lesbian households reported
Household received Food Stamps/SNAP in the past 12 months: 86
Household did not receive Food Stamps/SNAP in the past 12 months: 13
Women who did not have a birth in the past 12 months: 63 (20 now married, 43 unmarried)
Housing units in zip code 15462 with a mortgage: 20
Residents with income below the poverty level in 2022:
| This zip code: | 26.0% |
| Whole state: | 11.8% |
| This zip code: | 16.9% |
| Whole state: | 6.1% |
Median number of rooms in houses and condos:

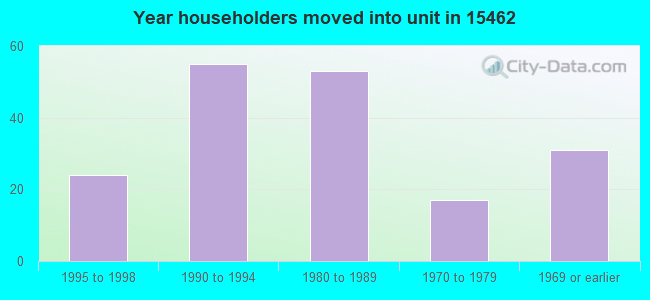
- Year house built (houses)
- 02020 or later
- 02010 to 2019
- 02000 to 2009
- 231990 to 1999
- 211980 to 1989
- 391970 to 1979
- 01960 to 1969
- 01950 to 1959
- 191940 to 1949
- 381939 or earlier
![Zip code 15462 satellite photo by USGS]()
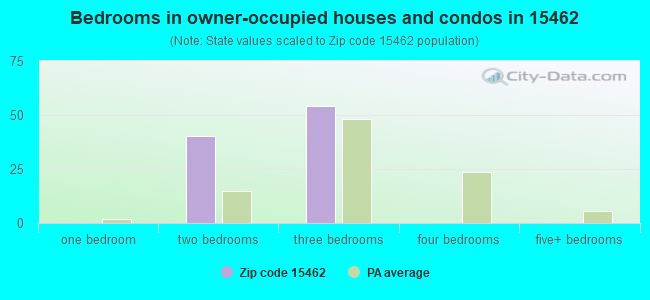
- Bedrooms in owner-occupied houses and condos in 15462
- 0no bedroom
- 01 bedroom
- 402 bedrooms
- 543 bedrooms
- 04 bedrooms
- 05+ bedrooms
- Cars and other vehicles available in 15462 in owner-occupied houses/condos
- 0no vehicle
- 341 vehicle
- 222 vehicles
- 03 vehicles
- 384 vehicles
- 05+ vehicles
Zip code 15462 household income distribution in 2022
![Zip code 15462 household income distribution in 2022]()
- 23Less than $10,000
- 38$10,000 to $14,999
- 14$40,000 to $44,999
- 20$75,000 to $99,999
Estimate of home value of owner-occupied houses/condos in 2022 in zip code 15462
![Estimate of home value of owner-occupied houses/condos in 2022 in zip code 15462]()
- 67Less than $10,000
- 10$40,000 to $49,999
- 15$125,000 to $149,999
Estimated median house (or condo) value in 2022 for:
- White Non-Hispanic householders: $19,229
Estimated median house or condo value in 2022: $10,852
| 15462: | $10,852 |
| Pennsylvania: | $245,500 |
Mean price in 2022:
Detached houses: $137,709| Here: | $137,709 |
| State: | $317,202 |
Mobile homes: $76,234| Here: | $76,234 |
| State: | $92,414 |
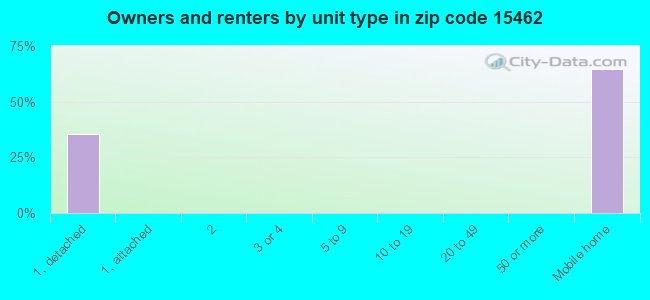
Housing units in structures:
- One, detached: 84
- Mobile homes: 59
Means of transportation to work in zip code 15462
![Means of transportation to work in zip code 15462]()
- 45.6%37Drove a car alone
- 50.6%41Carpooled
Travel time to work (commute) in zip code 15462
![Travel time to work (commute) in zip code 15462]()
- 14Less than 5 minutes
- 2210 to 14 minutes
- 2030 to 34 minutes
- 2090 or more minutes
Percentage of zip code residents living and working in this county: 45.7%
Household type by relationship:
Households: 225
- Male householders: 60 (40 living alone), Female householders: 34 (21 living alone)
21 spouses (21 opposite-sex spouses), 0 unmarried partners, (0 opposite-sex unmarried partners), 98 children (55 natural, 0 adopted, 42 stepchildren), 0 grandchildren, 0 brothers or sisters, 10 parents, 0 foster children, 0 other relatives, 0 non-relatives
Size of family households: 12 3-persons, 20 6-persons
Size of nonfamily households: 60 1-person
64 married couples with children.
0 single-parent households ().
98.2% of residents of 15462 zip code speak English at home.
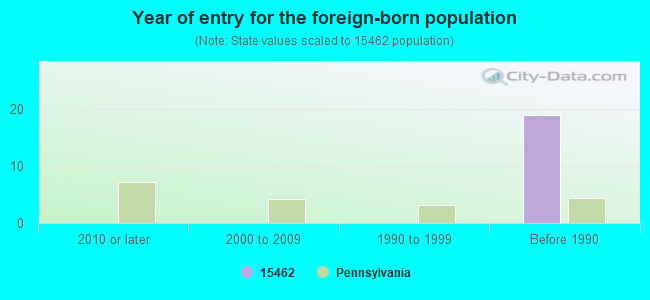
Foreign born population: 0 (0.0%)
- Year of entry for the foreign-born population
- 02010 or later
- 02000 to 2009
- 01990 to 1999
- 19Before 1990
![Zip code 15462 topographic map]()
Housing units lacking complete plumbing facilities: 30.6%
Housing units lacking complete kitchen facilities: 56.6%
Population in 1990: 77. Population change in the 1990s: +336 (+436.4%).
Place of birth for U.S.-born residents:
91% of the 15462 zip code residents lived in the same house 5 years ago.
Out of people who lived in different houses, 82% lived in this county.
100% of the 15462 zip code residents lived in the same house 1 year ago.
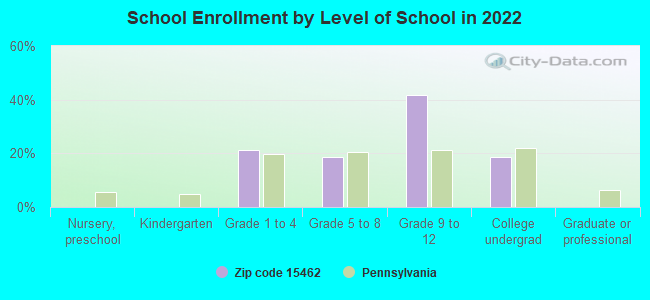
Private vs. public school enrollment:
Students in private schools in grades 1 to 8 (elementary and middle school):
| Here: | 0.0% |
| Pennsylvania: | 15.7% |
| Here: | 0.0% |
| Pennsylvania: | 13.4% |
19
| Here: | 100.0% |
| Pennsylvania: | 39.8% |
Top industries in this zip code by the number of employees in 2005:
- Other Services (except Public Administration): Religious Organizations (1-4 employees: 1 establishment)
- Professional, Scientific, and Technical Services: Other Accounting Services (1-4: 1)
- Other Services (except Public Administration): Environment, Conservation and Wildlife Organizations (1-4: 1)
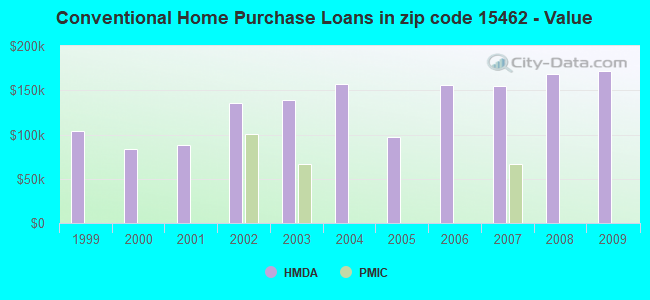
Home Mortgage Disclosure Act Aggregated Statistics For Year 2009
(Based on 2 partial tracts)
|
| B) Conventional
Home Purchase Loans | C) Refinancings
| D) Home Improvement Loans
| F) Non-occupant Loans on
< 5 Family Dwellings (A B C & D) | G) Loans On Manufactured
Home Dwelling (A B C & D) |
|---|
| Number | Average Value | Number | Average Value | Number | Average Value | Number | Average Value | Number | Average Value |
|---|
| LOANS ORIGINATED | 1 | $171,740 | 5 | $150,424 | 1 | $36,990 | 2 | $227,650 | 0 | $0 |
| APPLICATIONS APPROVED, NOT ACCEPTED | 0 | $0 | 1 | $80,050 | 0 | $0 | 0 | $0 | 0 | $0 |
| APPLICATIONS DENIED | 0 | $0 | 3 | $133,467 | 1 | $24,690 | 1 | $140,570 | 1 | $18,670 |
| APPLICATIONS WITHDRAWN | 0 | $0 | 1 | $155,850 | 0 | $0 | 0 | $0 | 0 | $0 |
| FILES CLOSED FOR INCOMPLETENESS | 0 | $0 | 0 | $0 | 0 | $0 | 0 | $0 | 0 | $0 |
Aggregated Statistics For Year 2008
(Based on 2 partial tracts)
|
| B) Conventional
Home Purchase Loans | C) Refinancings
| D) Home Improvement Loans
| F) Non-occupant Loans on
< 5 Family Dwellings (A B C & D) | G) Loans On Manufactured
Home Dwelling (A B C & D) |
|---|
| Number | Average Value | Number | Average Value | Number | Average Value | Number | Average Value | Number | Average Value |
|---|
| LOANS ORIGINATED | 2 | $168,880 | 3 | $72,627 | 2 | $25,045 | 1 | $238,730 | 1 | $57,380 |
| APPLICATIONS APPROVED, NOT ACCEPTED | 0 | $0 | 0 | $0 | 0 | $0 | 0 | $0 | 0 | $0 |
| APPLICATIONS DENIED | 1 | $160,250 | 4 | $89,890 | 1 | $19,580 | 0 | $0 | 1 | $49,890 |
| APPLICATIONS WITHDRAWN | 0 | $0 | 1 | $87,080 | 0 | $0 | 0 | $0 | 0 | $0 |
| FILES CLOSED FOR INCOMPLETENESS | 0 | $0 | 0 | $0 | 0 | $0 | 0 | $0 | 0 | $0 |
Aggregated Statistics For Year 2007
(Based on 2 partial tracts)
|
| B) Conventional
Home Purchase Loans | C) Refinancings
| D) Home Improvement Loans
| F) Non-occupant Loans on
< 5 Family Dwellings (A B C & D) | G) Loans On Manufactured
Home Dwelling (A B C & D) |
|---|
| Number | Average Value | Number | Average Value | Number | Average Value | Number | Average Value | Number | Average Value |
|---|
| LOANS ORIGINATED | 2 | $154,430 | 4 | $86,842 | 2 | $47,840 | 1 | $250,570 | 1 | $44,630 |
| APPLICATIONS APPROVED, NOT ACCEPTED | 0 | $0 | 1 | $78,990 | 0 | $0 | 0 | $0 | 0 | $0 |
| APPLICATIONS DENIED | 1 | $141,530 | 5 | $100,218 | 2 | $22,290 | 0 | $0 | 1 | $62,490 |
| APPLICATIONS WITHDRAWN | 0 | $0 | 2 | $78,605 | 0 | $0 | 0 | $0 | 0 | $0 |
| FILES CLOSED FOR INCOMPLETENESS | 0 | $0 | 1 | $105,300 | 0 | $0 | 0 | $0 | 0 | $0 |
Aggregated Statistics For Year 2006
(Based on 2 partial tracts)
|
| B) Conventional
Home Purchase Loans | C) Refinancings
| D) Home Improvement Loans
| F) Non-occupant Loans on
< 5 Family Dwellings (A B C & D) | G) Loans On Manufactured
Home Dwelling (A B C & D) |
|---|
| Number | Average Value | Number | Average Value | Number | Average Value | Number | Average Value | Number | Average Value |
|---|
| LOANS ORIGINATED | 2 | $156,480 | 4 | $103,590 | 3 | $35,150 | 1 | $213,130 | 1 | $40,280 |
| APPLICATIONS APPROVED, NOT ACCEPTED | 1 | $106,970 | 1 | $78,730 | 1 | $14,930 | 0 | $0 | 0 | $0 |
| APPLICATIONS DENIED | 1 | $60,060 | 6 | $91,308 | 2 | $30,915 | 0 | $0 | 2 | $47,740 |
| APPLICATIONS WITHDRAWN | 0 | $0 | 3 | $91,400 | 0 | $0 | 0 | $0 | 0 | $0 |
| FILES CLOSED FOR INCOMPLETENESS | 0 | $0 | 1 | $129,280 | 0 | $0 | 0 | $0 | 0 | $0 |
Aggregated Statistics For Year 2005
(Based on 2 partial tracts)
|
| B) Conventional
Home Purchase Loans | C) Refinancings
| D) Home Improvement Loans
| F) Non-occupant Loans on
< 5 Family Dwellings (A B C & D) | G) Loans On Manufactured
Home Dwelling (A B C & D) |
|---|
| Number | Average Value | Number | Average Value | Number | Average Value | Number | Average Value | Number | Average Value |
|---|
| LOANS ORIGINATED | 2 | $97,305 | 5 | $97,122 | 3 | $32,267 | 1 | $82,630 | 1 | $32,790 |
| APPLICATIONS APPROVED, NOT ACCEPTED | 1 | $107,830 | 2 | $52,675 | 0 | $0 | 0 | $0 | 1 | $34,910 |
| APPLICATIONS DENIED | 2 | $62,845 | 8 | $99,278 | 2 | $51,690 | 1 | $49,440 | 3 | $54,360 |
| APPLICATIONS WITHDRAWN | 0 | $0 | 3 | $100,273 | 0 | $0 | 0 | $0 | 0 | $0 |
| FILES CLOSED FOR INCOMPLETENESS | 0 | $0 | 1 | $79,340 | 0 | $0 | 0 | $0 | 0 | $0 |
Aggregated Statistics For Year 2004
(Based on 2 partial tracts)
|
| B) Conventional
Home Purchase Loans | C) Refinancings
| D) Home Improvement Loans
| F) Non-occupant Loans on
< 5 Family Dwellings (A B C & D) | G) Loans On Manufactured
Home Dwelling (A B C & D) |
|---|
| Number | Average Value | Number | Average Value | Number | Average Value | Number | Average Value | Number | Average Value |
|---|
| LOANS ORIGINATED | 2 | $156,710 | 7 | $75,770 | 3 | $33,750 | 1 | $217,480 | 1 | $31,070 |
| APPLICATIONS APPROVED, NOT ACCEPTED | 0 | $0 | 2 | $59,405 | 0 | $0 | 0 | $0 | 0 | $0 |
| APPLICATIONS DENIED | 2 | $58,140 | 8 | $86,380 | 3 | $28,520 | 0 | $0 | 1 | $59,050 |
| APPLICATIONS WITHDRAWN | 0 | $0 | 3 | $95,970 | 0 | $0 | 0 | $0 | 0 | $0 |
| FILES CLOSED FOR INCOMPLETENESS | 0 | $0 | 1 | $97,960 | 0 | $0 | 0 | $0 | 0 | $0 |
Aggregated Statistics For Year 2003
(Based on 2 partial tracts)
|
| B) Conventional
Home Purchase Loans | C) Refinancings
| D) Home Improvement Loans
| F) Non-occupant Loans on
< 5 Family Dwellings (A B C & D) |
|---|
| Number | Average Value | Number | Average Value | Number | Average Value | Number | Average Value |
|---|
| LOANS ORIGINATED | 4 | $139,278 | 13 | $83,097 | 3 | $27,273 | 4 | $145,272 |
| APPLICATIONS APPROVED, NOT ACCEPTED | 0 | $0 | 4 | $69,918 | 0 | $0 | 1 | $81,010 |
| APPLICATIONS DENIED | 1 | $69,170 | 9 | $71,498 | 3 | $14,067 | 1 | $39,470 |
| APPLICATIONS WITHDRAWN | 0 | $0 | 4 | $92,560 | 0 | $0 | 0 | $0 |
| FILES CLOSED FOR INCOMPLETENESS | 0 | $0 | 0 | $0 | 0 | $0 | 0 | $0 |
Aggregated Statistics For Year 2002
(Based on 2 partial tracts)
|
| B) Conventional
Home Purchase Loans | C) Refinancings
| D) Home Improvement Loans
| F) Non-occupant Loans on
< 5 Family Dwellings (A B C & D) |
|---|
| Number | Average Value | Number | Average Value | Number | Average Value | Number | Average Value |
|---|
| LOANS ORIGINATED | 2 | $135,355 | 8 | $79,486 | 2 | $37,015 | 3 | $101,150 |
| APPLICATIONS APPROVED, NOT ACCEPTED | 0 | $0 | 2 | $61,985 | 0 | $0 | 0 | $0 |
| APPLICATIONS DENIED | 1 | $46,810 | 6 | $72,687 | 2 | $15,460 | 0 | $0 |
| APPLICATIONS WITHDRAWN | 0 | $0 | 4 | $68,690 | 1 | $10,320 | 0 | $0 |
| FILES CLOSED FOR INCOMPLETENESS | 0 | $0 | 1 | $65,780 | 0 | $0 | 0 | $0 |
Aggregated Statistics For Year 2001
(Based on 2 partial tracts)
|
| B) Conventional
Home Purchase Loans | C) Refinancings
| D) Home Improvement Loans
| F) Non-occupant Loans on
< 5 Family Dwellings (A B C & D) |
|---|
| Number | Average Value | Number | Average Value | Number | Average Value | Number | Average Value |
|---|
| LOANS ORIGINATED | 3 | $88,683 | 9 | $69,558 | 3 | $30,343 | 3 | $90,910 |
| APPLICATIONS APPROVED, NOT ACCEPTED | 1 | $42,910 | 2 | $69,020 | 1 | $12,300 | 0 | $0 |
| APPLICATIONS DENIED | 2 | $57,255 | 7 | $56,954 | 4 | $13,902 | 1 | $17,860 |
| APPLICATIONS WITHDRAWN | 0 | $0 | 3 | $64,263 | 1 | $14,170 | 0 | $0 |
| FILES CLOSED FOR INCOMPLETENESS | 0 | $0 | 1 | $51,000 | 0 | $0 | 0 | $0 |
Aggregated Statistics For Year 2000
(Based on 2 partial tracts)
|
| B) Conventional
Home Purchase Loans | C) Refinancings
| D) Home Improvement Loans
| F) Non-occupant Loans on
< 5 Family Dwellings (A B C & D) |
|---|
| Number | Average Value | Number | Average Value | Number | Average Value | Number | Average Value |
|---|
| LOANS ORIGINATED | 3 | $83,607 | 4 | $46,248 | 3 | $19,243 | 1 | $137,830 |
| APPLICATIONS APPROVED, NOT ACCEPTED | 1 | $41,340 | 1 | $65,780 | 1 | $10,370 | 0 | $0 |
| APPLICATIONS DENIED | 2 | $48,930 | 5 | $52,168 | 1 | $36,080 | 0 | $0 |
| APPLICATIONS WITHDRAWN | 0 | $0 | 2 | $41,035 | 0 | $0 | 0 | $0 |
| FILES CLOSED FOR INCOMPLETENESS | 0 | $0 | 0 | $0 | 0 | $0 | 0 | $0 |
Aggregated Statistics For Year 1999
(Based on 1 partial tract)
|
| B) Conventional
Home Purchase Loans | C) Refinancings
| D) Home Improvement Loans
|
|---|
| Number | Average Value | Number | Average Value | Number | Average Value |
|---|
| LOANS ORIGINATED | 1 | $103,910 | 2 | $62,315 | 1 | $19,350 |
| APPLICATIONS APPROVED, NOT ACCEPTED | 0 | $0 | 1 | $36,740 | 0 | $0 |
| APPLICATIONS DENIED | 1 | $44,400 | 2 | $52,750 | 1 | $20,620 |
| APPLICATIONS WITHDRAWN | 0 | $0 | 1 | $42,020 | 0 | $0 |
| FILES CLOSED FOR INCOMPLETENESS | 0 | $0 | 0 | $0 | 0 | $0 |
Private Mortgage Insurance Companies Aggregated Statistics For Year 2007
(Based on 2 partial tracts)
|
| A) Conventional
Home Purchase Loans |
|---|
| Number | Average Value |
|---|
| LOANS ORIGINATED | 1 | $66,340 |
| APPLICATIONS APPROVED, NOT ACCEPTED | 0 | $0 |
| APPLICATIONS DENIED | 0 | $0 |
| APPLICATIONS WITHDRAWN | 0 | $0 |
| FILES CLOSED FOR INCOMPLETENESS | 0 | $0 |
Aggregated Statistics For Year 2003
(Based on 2 partial tracts)
|
| A) Conventional
Home Purchase Loans |
|---|
| Number | Average Value |
|---|
| LOANS ORIGINATED | 1 | $66,180 |
| APPLICATIONS APPROVED, NOT ACCEPTED | 0 | $0 |
| APPLICATIONS DENIED | 0 | $0 |
| APPLICATIONS WITHDRAWN | 0 | $0 |
| FILES CLOSED FOR INCOMPLETENESS | 0 | $0 |
Aggregated Statistics For Year 2002
(Based on 2 partial tracts)
|
| A) Conventional
Home Purchase Loans | B) Refinancings
| C) Non-occupant Loans on
< 5 Family Dwellings (A & B) |
|---|
| Number | Average Value | Number | Average Value | Number | Average Value |
|---|
| LOANS ORIGINATED | 1 | $100,290 | 1 | $52,070 | 1 | $70,440 |
| APPLICATIONS APPROVED, NOT ACCEPTED | 0 | $0 | 0 | $0 | 0 | $0 |
| APPLICATIONS DENIED | 0 | $0 | 0 | $0 | 0 | $0 |
| APPLICATIONS WITHDRAWN | 0 | $0 | 0 | $0 | 0 | $0 |
| FILES CLOSED FOR INCOMPLETENESS | 0 | $0 | 0 | $0 | 0 | $0 |
| Most common first names in zip code 15462 among deceased individuals |
| Name | Count | Lived (average) |
|---|
| Frank | 8 | 72.5 years |
| James | 5 | 67.6 years |
| Mary | 5 | 88.4 years |
| George | 4 | 77.3 years |
| John | 4 | 76.5 years |
| David | 3 | 60.3 years |
| Betty | 3 | 71.1 years |
| Frances | 3 | 72.3 years |
| Gilbert | 3 | 79.3 years |
| Mike | 3 | 79.4 years |
| Most common last names in zip code 15462 among deceased individuals |
| Last name | Count | Lived (average) |
|---|
| Hess | 6 | 82.5 years |
| Martin | 6 | 71.3 years |
| Ritenour | 5 | 74.2 years |
| Firestone | 4 | 67.8 years |
| Kalp | 4 | 84.7 years |
| Nedrow | 4 | 85.5 years |
| Sisson | 4 | 79.0 years |
| Solomon | 4 | 82.2 years |
| Eicher | 3 | 88.0 years |
| Miller | 3 | 77.7 years |
Businesses in zip code 15462


 Nearest zip codes: 15628, 15446, 15622, 15646, 15469, 15490.