Estimated zip code population in 2022: 321
Zip code population in 2010: 293
Zip code population in 2000: 264
March 2022 cost of living index in zip code 15520: 91.5
(less than average, U.S. average is 100)
Land area: 0.7
sq. mi.
Water area: 0.0
sq. mi.
| Population density: 474 people per square mile | | (low). |
![Age and Sex of Residents in zip code 15520]()
- OSM Map
- General Map
- Google Map
- MSN Map
- OSM Map
- General Map
- Google Map
- MSN Map
- OSM Map
- General Map
- Google Map
- MSN Map
- OSM Map
- General Map
- Google Map
- MSN Map
Please wait while loading the map...
Median real estate property taxes paid for housing units with mortgages in 2022: $662
Business Search - 14 Million verified businesses
| Males: 179 |  (55.9%) (55.9%) |
| Females: 141 |  (44.1%) (44.1%) |
For population 25 years and over in 15520:
- High school or higher: 69.2%
- Bachelor's degree or higher: 0.0%
- Graduate or professional degree: 0.0%
- Mean travel time to work (commute): 23.3 minutes
For population 15 years and over in 15520:
- Never married: 37.9%
- Now married: 53.9%
- Separated: 0.0%
- Widowed: 8.3%
- Divorced: 0.0%
Zip code 15520 compared to state average:
- Median household income significantly below state average.
- Median house value below state average.
- Unemployed percentage significantly below state average.
- Black race population percentage significantly below state average.
- Hispanic race population percentage significantly below state average.
- Median age significantly above state average.
- Foreign-born population percentage significantly below state average.
- Renting percentage significantly below state average.
- Length of stay since moving in significantly above state average.
- House age significantly below state average.
- Number of college students significantly below state average.
- Percentage of population with a bachelor's degree or higher significantly below state average.
Data:
100%
rural population.
Estimated median house/condo value in 2022: $113,091
| 15520: | $113,091 |
| Pennsylvania: | $245,500 |
Median resident age:| This zip code: | 52.8 years |
| Pennsylvania median age: | 40.9 years |
Average household size:| This zip code: | 2.8 people |
| Pennsylvania: | 2.4 people |
Averages for the 2004 tax year for zip code 15520, filed in 2005:
Average Adjusted Gross Income (AGI) in 2004: $21,806 (Individual Income Tax Returns)
| Here: | $21,806 |
| State: | $48,049 |
Salary/wage: $21,429 (reported on 88.8% of returns)
| Here: | $21,429 |
| State: | $42,646 |
Taxable interest for individuals: $333 (reported on 20.1% of returns)
| This zip code: | $333 |
| Pennsylvania: | $1,657 |
Total tax: $1,629 (reported on 66.4% of returns)
Earned income credit: $1,036 (reported on 20.9% of returns)
Percentage of individuals using paid preparers for their 2004 taxes: 54.5%
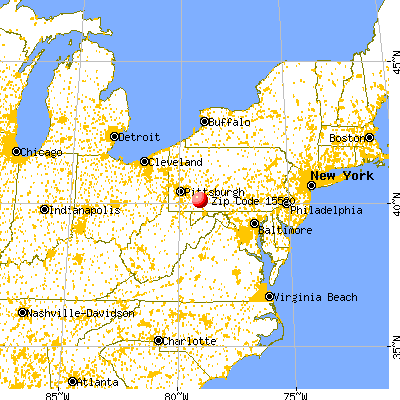
![15520 map]() Nearest zip codes: 15555
Nearest zip codes: 15555,
15561,
15546,
15544,
15547,
15531.
Percentage of family households:| This zip code: | 73.3% |
| Pennsylvania: | 42.6% |
Percentage of households with unmarried partners:| This zip code: | 0.0% |
| Pennsylvania: | 46.5% |
No gay or lesbian households reported
Household received Food Stamps/SNAP in the past 12 months: 0
Household did not receive Food Stamps/SNAP in the past 12 months: 114
Women who did not have a birth in the past 12 months: 48 (19 now married, 29 unmarried)
Housing units in zip code 15520 with a mortgage: 86
Median number of rooms in houses and condos:

- Year house built (houses)
- 02020 or later
- 02010 to 2019
- 392000 to 2009
- 531990 to 1999
- 01980 to 1989
- 01970 to 1979
- 01960 to 1969
- 01950 to 1959
- 01940 to 1949
- 201939 or earlier
![Zip code 15520 satellite photo by USGS]()
- Bedrooms in owner-occupied houses and condos in 15520
- 0no bedroom
- 01 bedroom
- 02 bedrooms
- 933 bedrooms
- 214 bedrooms
- 05+ bedrooms
- Cars and other vehicles available in 15520 in owner-occupied houses/condos
- 0no vehicle
- 591 vehicle
- 02 vehicles
- 463 vehicles
- 94 vehicles
- 05+ vehicles
Zip code 15520 household income distribution in 2022
![Zip code 15520 household income distribution in 2022]()
- 58$50,000 to $59,999
- 19$75,000 to $99,999
- 27$100,000 to $124,999
- 8$125,000 to $149,999
Estimate of home value of owner-occupied houses/condos in 2022 in zip code 15520
![Estimate of home value of owner-occupied houses/condos in 2022 in zip code 15520]()
- 24$25,000 to $29,999
- 13$90,000 to $99,999
- 51$100,000 to $124,999
- 6$125,000 to $149,999
Estimated median house (or condo) value in 2022 for:
- White Non-Hispanic householders: $113,090
Estimated median house or condo value in 2022: $113,091
| 15520: | $113,091 |
| Pennsylvania: | $245,500 |
Mean price in 2022:
Detached houses: $100,135| Here: | $100,135 |
| State: | $317,202 |
Housing units in structures:
- One, detached: 86
- Mobile homes: 26
Means of transportation to work in zip code 15520
![Means of transportation to work in zip code 15520]()
- 83.8%175Drove a car alone
- 12.5%26Carpooled
Travel time to work (commute) in zip code 15520
![Travel time to work (commute) in zip code 15520]()
- 1910 to 14 minutes
- 5415 to 19 minutes
- 4620 to 24 minutes
- 7935 to 39 minutes
Percentage of zip code residents living and working in this county: 92.8%
Household type by relationship:
Households: 321
- Male householders: 0 (0 living alone), Female householders: 117 (0 living alone)
88 spouses (88 opposite-sex spouses), 0 unmarried partners, (0 opposite-sex unmarried partners), 28 children (0 natural, 0 adopted, 28 stepchildren), 94 grandchildren, 0 brothers or sisters, 0 parents, 0 foster children, 0 other relatives, 0 non-relatives
Size of family households: 67 2-persons, 46 3-persons
98.4% of residents of 15520 zip code speak English at home.
Foreign born population: 0 (0.0%)

- 75.1%Electricity
- 25.9%Fuel oil, kerosene, etc.
Place of birth for U.S.-born residents:
- This state: 291
- Northeast: 27
78% of the 15520 zip code residents lived in the same house 5 years ago.
Out of people who lived in different houses, 80% lived in this county.
100% of the 15520 zip code residents lived in the same house 1 year ago.
Top industries in this zip code by the number of employees in 2005:
- Wholesale Trade: Office Equipment Merchant Wholesalers (50-99 employees: 1 establishment)
- Other Services (except Public Administration): Religious Organizations (1-4: 1)
- Finance and Insurance: Direct Health and Medical Insurance Carriers (1-4: 1)
- Mining: Bituminous Coal Underground Mining (1-4: 1)
- Professional, Scientific, and Technical Services: Surveying and Mapping (except Geophysical) Services (1-4: 1)
Home Mortgage Disclosure Act Aggregated Statistics For Year 2003
(Based on 2 partial tracts)
|
| B) Conventional
Home Purchase Loans | C) Refinancings
| D) Home Improvement Loans
|
|---|
| Number | Average Value | Number | Average Value | Number | Average Value |
|---|
| LOANS ORIGINATED | 2 | $50,005 | 6 | $67,637 | 2 | $21,160 |
| APPLICATIONS APPROVED, NOT ACCEPTED | 0 | $0 | 1 | $80,890 | 0 | $0 |
| APPLICATIONS DENIED | 1 | $33,350 | 3 | $62,923 | 0 | $0 |
| APPLICATIONS WITHDRAWN | 0 | $0 | 2 | $69,795 | 0 | $0 |
| FILES CLOSED FOR INCOMPLETENESS | 0 | $0 | 0 | $0 | 0 | $0 |
Aggregated Statistics For Year 2002
(Based on 2 partial tracts)
|
| B) Conventional
Home Purchase Loans | C) Refinancings
| D) Home Improvement Loans
|
|---|
| Number | Average Value | Number | Average Value | Number | Average Value |
|---|
| LOANS ORIGINATED | 1 | $89,320 | 4 | $60,860 | 1 | $19,480 |
| APPLICATIONS APPROVED, NOT ACCEPTED | 0 | $0 | 1 | $56,820 | 0 | $0 |
| APPLICATIONS DENIED | 0 | $0 | 3 | $59,577 | 0 | $0 |
| APPLICATIONS WITHDRAWN | 0 | $0 | 1 | $71,370 | 0 | $0 |
| FILES CLOSED FOR INCOMPLETENESS | 0 | $0 | 0 | $0 | 0 | $0 |
Aggregated Statistics For Year 2001
(Based on 2 partial tracts)
|
| B) Conventional
Home Purchase Loans | C) Refinancings
| D) Home Improvement Loans
|
|---|
| Number | Average Value | Number | Average Value | Number | Average Value |
|---|
| LOANS ORIGINATED | 1 | $68,300 | 3 | $54,227 | 1 | $21,900 |
| APPLICATIONS APPROVED, NOT ACCEPTED | 0 | $0 | 1 | $34,140 | 0 | $0 |
| APPLICATIONS DENIED | 1 | $30,270 | 2 | $63,035 | 1 | $7,150 |
| APPLICATIONS WITHDRAWN | 0 | $0 | 1 | $77,030 | 0 | $0 |
| FILES CLOSED FOR INCOMPLETENESS | 0 | $0 | 0 | $0 | 0 | $0 |
Aggregated Statistics For Year 2000
(Based on 2 partial tracts)
|
| B) Conventional
Home Purchase Loans | C) Refinancings
| D) Home Improvement Loans
|
|---|
| Number | Average Value | Number | Average Value | Number | Average Value |
|---|
| LOANS ORIGINATED | 1 | $56,410 | 2 | $47,490 | 1 | $20,780 |
| APPLICATIONS APPROVED, NOT ACCEPTED | 0 | $0 | 0 | $0 | 0 | $0 |
| APPLICATIONS DENIED | 1 | $33,970 | 1 | $62,020 | 1 | $9,250 |
| APPLICATIONS WITHDRAWN | 0 | $0 | 1 | $39,200 | 0 | $0 |
| FILES CLOSED FOR INCOMPLETENESS | 0 | $0 | 0 | $0 | 0 | $0 |
Aggregated Statistics For Year 1999
(Based on 1 partial tract)
|
| B) Conventional
Home Purchase Loans | C) Refinancings
| D) Home Improvement Loans
|
|---|
| Number | Average Value | Number | Average Value | Number | Average Value |
|---|
| LOANS ORIGINATED | 1 | $30,260 | 1 | $59,340 | 1 | $17,420 |
| APPLICATIONS APPROVED, NOT ACCEPTED | 0 | $0 | 0 | $0 | 0 | $0 |
| APPLICATIONS DENIED | 0 | $0 | 1 | $29,550 | 0 | $0 |
| APPLICATIONS WITHDRAWN | 0 | $0 | 1 | $24,930 | 0 | $0 |
| FILES CLOSED FOR INCOMPLETENESS | 0 | $0 | 0 | $0 | 0 | $0 |
Private Mortgage Insurance Companies Aggregated Statistics For Year 2003
(Based on 2 partial tracts)
|
| B) Refinancings
|
|---|
| Number | Average Value |
|---|
| LOANS ORIGINATED | 1 | $45,750 |
| APPLICATIONS APPROVED, NOT ACCEPTED | 0 | $0 |
| APPLICATIONS DENIED | 0 | $0 |
| APPLICATIONS WITHDRAWN | 0 | $0 |
| FILES CLOSED FOR INCOMPLETENESS | 0 | $0 |
| Most common first names in zip code 15520 among deceased individuals |
| Name | Count | Lived (average) |
|---|
| John | 7 | 75.1 years |
| Mary | 6 | 87.0 years |
| William | 6 | 80.3 years |
| George | 4 | 75.7 years |
| Robert | 4 | 75.3 years |
| Michael | 3 | 75.6 years |
| Edward | 2 | 73.5 years |
| Hazel | 2 | 73.9 years |
| Albert | 2 | 84.5 years |
| Emma | 2 | 71.0 years |
| Most common last names in zip code 15520 among deceased individuals |
| Last name | Count | Lived (average) |
|---|
| Niemiec | 6 | 78.2 years |
| Nicklow | 5 | 82.4 years |
| Tunstall | 5 | 72.4 years |
| Edmiston | 3 | 68.3 years |
| Wyant | 3 | 74.6 years |
| Shaffer | 3 | 65.0 years |
| Bailey | 3 | 78.6 years |
| Furman | 3 | 74.4 years |
| Zanoni | 3 | 79.6 years |
| Tressler | 3 | 80.0 years |


 Nearest zip codes: 15555, 15561, 15546, 15544, 15547, 15531.


