Estimated zip code population in 2022: 9,309 Zip code population in 2010: 9,363 Zip code population in 2000: 8,505
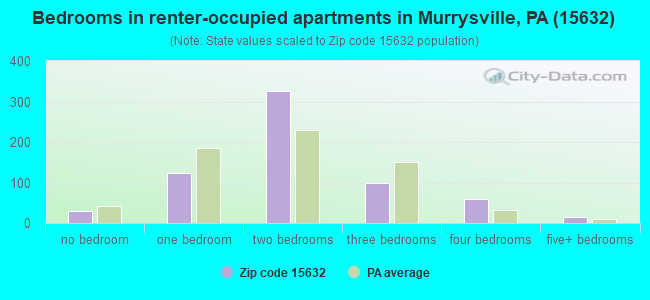
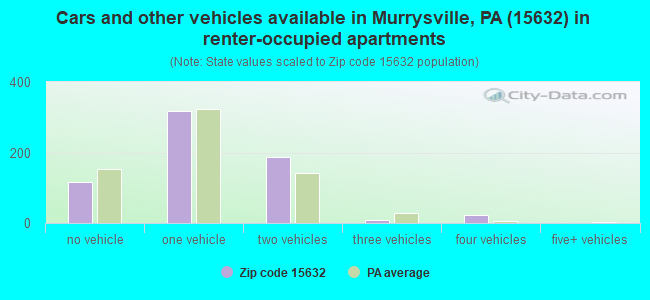
Houses and condos: 4,058 Renter-occupied apartments: 652
% of renters here:
17%
State:
31%
March 2022 cost of living index in zip code 15632: 91.2 (less than average, U.S. average is 100)
Land area: 27.1 sq. mi. Water area: 0.7 sq. mi.
Population density: 344 people per square mile
(very low).
OSM Map
General Map
Google Map
MSN Map
OSM Map
General Map
Google Map
MSN Map
OSM Map
General Map
Google Map
MSN Map
OSM Map
General Map
Google Map
MSN Map
Please wait while loading the map...
Real estate property taxes paid for housing units in 2022:
This zip code:
1.2% ($3,523)
Pennsylvania:
1.3% ($3,094)
Median real estate property taxes paid for housing units with mortgages in 2022: $3,906 (1.3%) Median real estate property taxes paid for housing units with no mortgage in 2022: $2,820 (1.1%)
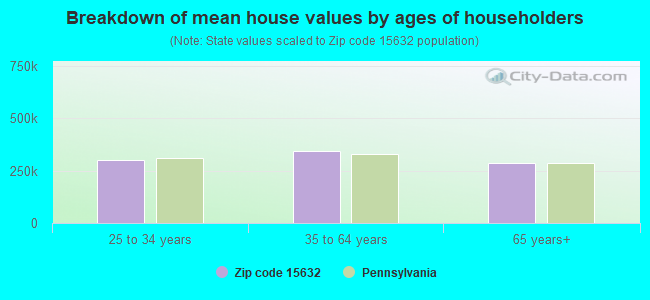
Estimated median house/condo value in 2022: $283,161
15632:
$283,161
Pennsylvania:
$245,500
According to our research of Pennsylvania and other state lists, there were 5 registered sex offenders living in 15632 zip code as of May 20, 2024. The ratio of all residents to sex offenders in zip code 15632 is 1,841 to 1. The ratio of registered sex offenders to all residents in this zip code is much lower than the state average.
Median resident age:
This zip code:
47.0 years
Pennsylvania median age:
40.9 years
Average household size:
This zip code:
2.4 people
Pennsylvania:
2.4 people
Averages for the 2020 tax year for zip code 15632, filed in 2021:
Average Adjusted Gross Income (AGI) in 2020: $103,189 (Individual Income Tax Returns)
Here:
$103,189
State:
$75,707
Salary/wage: $81,232 (reported on 78.8% of returns)
Here:
$81,232
State:
$62,806
(% of AGI for various income ranges: 1135.9% for AGIs below $25k, 3451.2% for AGIs $25k-50k, 5961.4% for AGIs $50k-75k, 9124.0% for AGIs $75k-100k, 16688.9% for AGIs $100k-200k, 89210.0% for AGIs over 200k)
Taxable interest for individuals: $1,966 (reported on 41.3% of returns)
This zip code:
$1,966
Pennsylvania:
$1,633
(% of AGI for various income ranges: 22.0% for AGIs below $25k, 43.6% for AGIs $25k-50k, 53.6% for AGIs $50k-75k, 91.0% for AGIs $75k-100k, 154.0% for AGIs $100k-200k, 1423.3% for AGIs over 200k)
Ordinary dividends: $8,741 (reported on 33.4% of returns)
Here:
$8,741
State:
$7,382
(% of AGI for various income ranges: 48.6% for AGIs below $25k, 87.5% for AGIs $25k-50k, 148.8% for AGIs $50k-75k, 220.0% for AGIs $75k-100k, 493.3% for AGIs $100k-200k, 6160.7% for AGIs over 200k)
Net capital gain/loss in AGI: +$14,096 (reported on 30.3% of returns)
Here:
+$14,096
State:
+$23,522
(% of AGI for various income ranges: 22.1% for AGIs below $25k, 78.1% for AGIs $25k-50k, 149.5% for AGIs $50k-75k, 280.7% for AGIs $75k-100k, 634.0% for AGIs $100k-200k, 10134.0% for AGIs over 200k)
Profit/loss from business: +$24,226 (reported on 14.1% of returns)
Here:
+$24,226
State:
+$16,274
(% of AGI for various income ranges: 104.9% for AGIs below $25k, 179.7% for AGIs $25k-50k, 300.7% for AGIs $50k-75k, 263.0% for AGIs $75k-100k, 645.8% for AGIs $100k-200k, 5928.7% for AGIs over 200k)
Taxable individual retirement arrangement distribution: $22,751 (reported on 15.1% of returns)
15632:
$22,751
Pennsylvania:
$18,583
(% of AGI for various income ranges: 106.0% for AGIs below $25k, 212.0% for AGIs $25k-50k, 373.8% for AGIs $50k-75k, 722.7% for AGIs $75k-100k, 1152.1% for AGIs $100k-200k, 2806.0% for AGIs over 200k)
Self-employed (Keogh) retirement plans: $22,375 (reported on 0.8% of returns)
15632:
$22,375
Pennsylvania:
$25,407
(% of AGI for various income ranges: 596.7% for AGIs over 200k)
Total itemized deductions: $34,551 (reported on 8.8% of returns)
Here:
$34,551
State:
$34,850
(% of AGI for various income ranges: 160.6% for AGIs $25k-50k, 204.3% for AGIs $50k-75k, 348.3% for AGIs $75k-100k, 713.5% for AGIs $100k-200k, 5186.0% for AGIs over 200k)
Charity contributions: $10,897 (reported on 7.3% of returns)
Here:
$10,897
State:
$12,392
(% of AGI for various income ranges: 11.4% for AGIs below $25k, 31.2% for AGIs $50k-75k, 59.0% for AGIs $75k-100k, 169.3% for AGIs $100k-200k, 1705.3% for AGIs over 200k)
Taxes paid: $8,402 (reported on 8.8% of returns)
15632:
$8,402
State:
$8,200
(% of AGI for various income ranges: 28.4% for AGIs $25k-50k, 52.1% for AGIs $50k-75k, 95.7% for AGIs $75k-100k, 221.4% for AGIs $100k-200k, 1099.3% for AGIs over 200k)
Earned income credit: $1,861 (reported on 7.3% of returns)
Here:
$1,861
State:
$2,100
(% of AGI for various income ranges: 46.5% for AGIs below $25k, 42.5% for AGIs $25k-50k)
Percentage of individuals using paid preparers for their 2020 taxes: 89.4%
Here:
89%
State:
92%
(% for various income ranges: 87.9% for AGIs below $25k, 90.3% for AGIs $25k-50k, 90.2% for AGIs $50k-75k, 87.5% for AGIs $75k-100k, 89.7% for AGIs $100k-200k, 92.3% for AGIs over 200k)
Averages for the 2012 tax year for zip code 15632, filed in 2013:
Average Adjusted Gross Income (AGI) in 2012: $85,992 (Individual Income Tax Returns)
Here:
$85,992
State:
$61,346
Salary/wage: $65,096 (reported on 83.3% of returns)
Here:
$65,096
State:
$51,902
(% of AGI for various income ranges: 71.7% for AGIs below $25k, 73.1% for AGIs $25k-50k, 71.7% for AGIs $50k-75k, 73.4% for AGIs $75k-100k, 76.4% for AGIs $100k-200k, 47.7% for AGIs over 200k)
Taxable interest for individuals: $2,128 (reported on 44.3% of returns)
This zip code:
$2,128
Pennsylvania:
$1,588
(% of AGI for various income ranges: 1.9% for AGIs below $25k, 0.9% for AGIs $25k-50k, 0.9% for AGIs $50k-75k, 0.8% for AGIs $75k-100k, 1.0% for AGIs $100k-200k, 1.2% for AGIs over 200k)
Ordinary dividends: $8,731 (reported on 34.3% of returns)
Here:
$8,731
State:
$5,827
(% of AGI for various income ranges: 2.4% for AGIs below $25k, 1.6% for AGIs $25k-50k, 1.9% for AGIs $50k-75k, 1.8% for AGIs $75k-100k, 2.0% for AGIs $100k-200k, 5.6% for AGIs over 200k)
Net capital gain/loss in AGI: +$14,201 (reported on 25.2% of returns)
Here:
+$14,201
State:
+$14,495
(% of AGI for various income ranges: 0.7% for AGIs $25k-50k, 0.7% for AGIs $50k-75k, 1.1% for AGIs $75k-100k, 1.3% for AGIs $100k-200k, 8.5% for AGIs over 200k)
Profit/loss from business: +$25,159 (reported on 14.0% of returns)
Here:
+$25,159
State:
+$16,268
(% of AGI for various income ranges: 5.2% for AGIs below $25k, 4.4% for AGIs $25k-50k, 3.7% for AGIs $50k-75k, 5.2% for AGIs $75k-100k, 3.0% for AGIs $100k-200k, 4.4% for AGIs over 200k)
Taxable individual retirement arrangement distribution: $15,925 (reported on 14.6% of returns)
15632:
$15,925
Pennsylvania:
$14,550
(% of AGI for various income ranges: 5.6% for AGIs below $25k, 3.8% for AGIs $25k-50k, 2.9% for AGIs $50k-75k, 4.3% for AGIs $75k-100k, 3.6% for AGIs $100k-200k, 1.3% for AGIs over 200k)
Self-employment retirement plans: $22,700 (reported on 1.1% of returns)
15632:
$22,700
Pennsylvania:
$20,922
Total itemized deductions: $26,067 (15% of AGI, reported on 36.7% of returns)
Here:
$26,067
State:
$23,538
Here:
14.9% of AGI
State:
18.4% of AGI
(% of AGI for various income ranges: 9.4% for AGIs below $25k, 8.2% for AGIs $25k-50k, 9.9% for AGIs $50k-75k, 12.5% for AGIs $75k-100k, 13.8% for AGIs $100k-200k, 10.1% for AGIs over 200k)
Charity contributions: $4,594 (reported on 31.8% of returns)
Here:
$4,594
State:
$4,025
(% of AGI for various income ranges: 0.5% for AGIs below $25k, 1.0% for AGIs $25k-50k, 1.0% for AGIs $50k-75k, 1.5% for AGIs $75k-100k, 1.9% for AGIs $100k-200k, 2.0% for AGIs over 200k)
Taxes paid: $12,313 (reported on 36.7% of returns)
15632:
$12,313
State:
$9,982
(% of AGI for various income ranges: 2.2% for AGIs below $25k, 2.7% for AGIs $25k-50k, 3.4% for AGIs $50k-75k, 5.2% for AGIs $75k-100k, 6.6% for AGIs $100k-200k, 5.6% for AGIs over 200k)
Earned income credit: $1,828 (reported on 9.1% of returns)
Here:
$1,828
State:
$2,106
(% of AGI for various income ranges: 3.0% for AGIs below $25k, 0.8% for AGIs $25k-50k)
Percentage of individuals using paid preparers for their 2012 taxes: 50.4%
Here:
50%
State:
53%
(% for various income ranges: 44.3% for AGIs below $25k, 50.0% for AGIs $25k-50k, 55.2% for AGIs $50k-75k, 53.3% for AGIs $75k-100k, 50.0% for AGIs $100k-200k, 70.6% for AGIs over 200k)
Averages for the 2004 tax year for zip code 15632, filed in 2005:
Average Adjusted Gross Income (AGI) in 2004: $58,878 (Individual Income Tax Returns)
Here:
$58,878
State:
$48,049
Salary/wage: $49,939 (reported on 82.3% of returns)
Here:
$49,939
State:
$42,646
(% of AGI for various income ranges: 157.7% for AGIs below $10k, 66.9% for AGIs $10k-25k, 76.8% for AGIs $25k-50k, 74.3% for AGIs $50k-75k, 79.4% for AGIs $75k-100k, 64.0% for AGIs over 100k)
Taxable interest for individuals: $1,878 (reported on 55.0% of returns)
This zip code:
$1,878
Pennsylvania:
$1,657
(% of AGI for various income ranges: 16.0% for AGIs below $10k, 3.8% for AGIs $10k-25k, 2.0% for AGIs $25k-50k, 1.6% for AGIs $50k-75k, 1.7% for AGIs $75k-100k, 1.3% for AGIs over 100k)
Taxable dividends: $3,012 (reported on 37.9% of returns)
Here:
$3,012
State:
$3,566
(% of AGI for various income ranges: 10.0% for AGIs below $10k, 2.3% for AGIs $10k-25k, 1.7% for AGIs $25k-50k, 1.3% for AGIs $50k-75k, 1.6% for AGIs $75k-100k, 2.1% for AGIs over 100k)
Net capital gain/loss: +$7,185 (reported on 29.3% of returns)
Here:
+$7,185
State:
+$9,716
(% of AGI for various income ranges: -5.5% for AGIs below $10k, 0.5% for AGIs $10k-25k, 0.6% for AGIs $25k-50k, 1.0% for AGIs $50k-75k, 1.5% for AGIs $75k-100k, 5.7% for AGIs over 100k)
Profit/loss from business: +$23,453 (reported on 15.5% of returns)
Here:
+$23,453
State:
+$14,267
(% of AGI for various income ranges: 7.1% for AGIs below $10k, 6.3% for AGIs $10k-25k, 5.4% for AGIs $25k-50k, 5.0% for AGIs $50k-75k, 4.6% for AGIs $75k-100k, 7.0% for AGIs over 100k)
IRA payment deduction: $3,276 (reported on 3.9% of returns)
15632:
$3,276
Pennsylvania:
$2,903
(% of AGI for various income ranges: 0.3% for AGIs $10k-25k, 0.5% for AGIs $25k-50k, 0.3% for AGIs $50k-75k, 0.3% for AGIs $75k-100k, 0.1% for AGIs over 100k)
Self-employed pension: $14,754 (reported on 1.4% of returns)
Here:
$14,754
Pennsylvania:
$14,674
(% of AGI for various income ranges: 0.2% for AGIs $50k-75k, 0.4% for AGIs $75k-100k, 0.5% for AGIs over 100k)
Total itemized deductions: $19,215 (17% of AGI, reported on 37.5% of returns)
Here:
$19,215
State:
$18,804
Here:
16.7% of AGI
State:
19.5% of AGI
(% of AGI for various income ranges: 23.3% for AGIs below $10k, 8.7% for AGIs $10k-25k, 11.0% for AGIs $25k-50k, 13.7% for AGIs $50k-75k, 16.0% for AGIs $75k-100k, 11.5% for AGIs over 100k)
Charity contributions deductions: $2,943 (2% of AGI, reported on 34.6% of returns)
Here:
$2,943
State:
$3,337
Here:
2.5% of AGI
State:
3.3% of AGI
(% of AGI for various income ranges: 0.7% for AGIs below $10k, 0.9% for AGIs $10k-25k, 1.3% for AGIs $25k-50k, 1.4% for AGIs $50k-75k, 2.0% for AGIs $75k-100k, 1.9% for AGIs over 100k)
Total tax: $10,930 (reported on 76.4% of returns)
15632:
$10,930
State:
$8,008
(% of AGI for various income ranges: 4.6% for AGIs below $10k, 4.7% for AGIs $10k-25k, 7.4% for AGIs $25k-50k, 9.0% for AGIs $50k-75k, 10.4% for AGIs $75k-100k, 18.8% for AGIs over 100k)
Earned income credit: $1,455 (reported on 7.9% of returns)
Here:
$1,455
State:
$1,643
Percentage of individuals using paid preparers for their 2004 taxes: 52.6%
Here:
53%
State:
56%
(% for various income ranges: 46.7% for AGIs below $10k, 51.5% for AGIs $10k-25k, 56.0% for AGIs $25k-50k, 59.1% for AGIs $50k-75k, 50.0% for AGIs $75k-100k, 55.2% for AGIs over 100k)
Likely homosexual households (counted as self-reported same-sex unmarried-partner households)
Lesbian couples: 0.1% of all households
Gay men: 0.1% of all households
Household received Food Stamps/SNAP in the past 12 months: 289 Household did not receive Food Stamps/SNAP in the past 12 months: 3,556
Women who had a birth in the past 12 months: 47 (51 now married, 0 unmarried) Women who did not have a birth in the past 12 months: 1,572 (883 now married, 680 unmarried)
Housing units in zip code 15632 with a mortgage: 1,845 (166 second mortgage, 157 both second mortgage and home equity loan) Houses without a mortgage: 157
Median monthly owner costs for units with a mortgage: $1,703 Median monthly owner costs for units without a mortgage: $653
Residents with income below the poverty level in 2022:
This zip code:
5.7%
Whole state:
11.8%
Residents with income below 50% of the poverty level in 2022:
This zip code:
3.0%
Whole state:
6.1%
Median number of rooms in houses and condos:
Here:
7.5
State:
6.8
Median number of rooms in apartments:
Here:
4.3
State:
4.3
Notable locations in this zip code not listed on our city pages
Notable locations in zip code 15632: Manordale (A), Westmoreland Country Club (B), Repeater Station (C), Export Volunteer Fire Department (D), White Valley Volunteer Fire Department (E). Display/hide their locations on the map
In group quarters: 131 (-1 institutionalized population)
Size of family households: 1,128 2-persons, 540 3-persons, 506 4-persons, 263 5-persons, 42 6-persons
Size of nonfamily households: 1,107 1-person, 239 2-persons, 28 3-persons
1,532 married couples with children.
166 single-parent households (166 women).
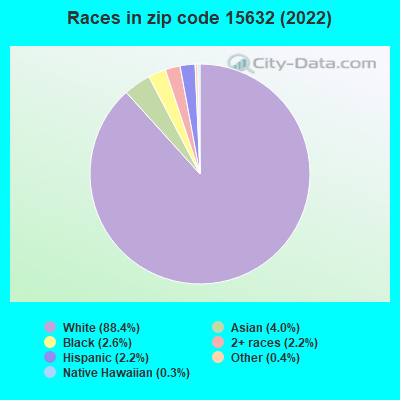
91.6% of residents of 15632 zip code speak English at home.
1.4% of residents speak Spanish at home (80% very well, 20% not well).
4.5% of residents speak other Indo-European language at home (80% very well, 16% well, 4% not well).
1.3% of residents speak Asian or Pacific Island language at home (81% very well, 12% well, 7% not well).
0.8% of residents speak other language at home (100% very well).
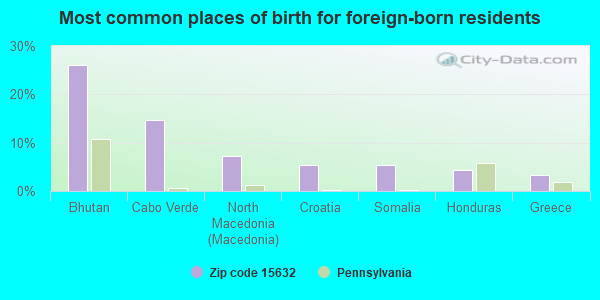
Foreign born population: 576 (6.2%) (76.2% of them are naturalized citizens)
This zip code:
6.2%
Whole state:
7.5%
26%Bhutan
15%Cabo Verde
7%North Macedonia (Macedonia)
5%Croatia
5%Somalia
4%Honduras
3%Greece
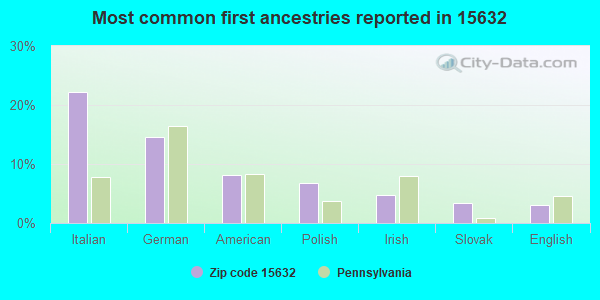
22%Italian
15%German
8%American
7%Polish
5%Irish
3%Slovak
3%English
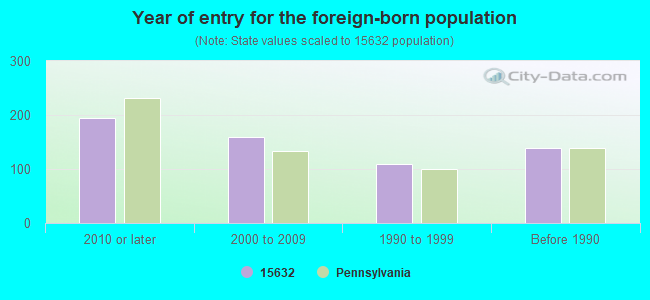
Year of entry for the foreign-born population
1942010 or later
1602000 to 2009
1101990 to 1999
139Before 1990
Facilities with environmental interests located in this zip code:
AMI DODUCO PLT 5 (1003 CORPORATE DRIVE in EXPORT, PA)
AIR MINOR (AIRS/AFS) CRITERIA AND HAZARDOUS AIR POLLUTANT INVENTORY (Inventory of air pollution sources) STATE MASTER (Pennsylvania database) - RCRIS-PAR000256024, HAZARDOUS WASTE PROGRAM, RCRIS-PAD987360047, AFS-25-1200205-1, AIR PROGRAM STATE MASTER (Pennsylvania database) - RCRIS-PAD987270279, HAZARDOUS WASTE PROGRAM HAZARDOUS WASTE BIENNIAL REPORTER (Resource Conservation and Recovery Act (tracking hazardous waste)) Large Quantity Generators, more that 1000 kg of hazardous waste/month (Resource Conservation and Recovery Act (tracking hazardous waste)) - notification TRI REPORTER (Tracking of toxic chemicals releasing facilities) Business SIC classification: ROLLING, DRAWING, AND EXTRUDING OF NONFERROUS METALS, EXCEPT COPPER AND ALUMINUM; FABRICATED METAL PRODUCTS Organizations: ADVANCED METALLURGY, INC. (CONTACT/GENERAL)
, AMI DODUCO INC (CONTACT/OPERATOR)
, TECHNITROL INC (CONTACT/OWNER)
, ADVANCED METALLURGY, INC. (CONTACT/OWNER)
Alternative names: ADVANCED METALLURGY PLT 5, AMI DODUCO INC PLT 5, AMI DODUCO (EXPORT) INC., AMI DODUCO (EXPORT) INC.
ANTECH LABS (ONE TRIANGLE DR in EXPORT, PA)
STATE MASTER (Pennsylvania database) - RCRIS-PAD987365657, HAZARDOUS WASTE PROGRAM Small Quantity Generators, between 100 kg and 1000 kg of hazardous waste/month (Resource Conservation and Recovery Act (tracking hazardous waste)) - notification Organizations: EARTH SCIENCES CONSULTANTS INC (CONTACT/OWNER)
Alternative names: ANTECH LIMITED
ALLTEL (OLD WILLIAM PENN HIGHWAY in EXPORT, PA)
(Integrated Compliance Information System) - ICIS-HQ-2000-6004, FORMAL ENFORCEMENT ACTION
ADVANCED MANUFACTURING TECHNOLOGIES INC (9001 CORPORATE CIRCLE in EXPORT, PA)
Conditionally Exempt Small Quantity Generators, less than 100 kg/month of hazardous waste (Resource Conservation and Recovery Act (tracking hazardous waste)) - notification TRI REPORTER (Tracking of toxic chemicals releasing facilities) Business SIC classification: ELECTRONIC COMPONENTS Organizations: ADVANCED MFG TECH (CONTACT/OWNER)
Alternative names: ADVANCED MFG. TECHS. INC.
AMERICAN AUTO-MATRIX INC (ONE TECHNOLOGY DR in EXPORT, PA)
Small Quantity Generators, between 100 kg and 1000 kg of hazardous waste/month (Resource Conservation and Recovery Act (tracking hazardous waste)) - notification Organizations: OPERNAME (CONTACT/OPERATOR)
ARBCO INDUSTRIES INC (2040 BORLAND ROAD in EXPORT, PA)
Small Quantity Generators, between 100 kg and 1000 kg of hazardous waste/month (Resource Conservation and Recovery Act (tracking hazardous waste)) - notification TRI REPORTER (Tracking of toxic chemicals releasing facilities) Business SIC classification: PLASTICS PRODUCTS Organizations: ARBCO INC (CONTACT/OWNER)
Alternative names: ARBCO INC
Housing units lacking complete plumbing facilities: 2.0% Housing units lacking complete kitchen facilities: 2.7%
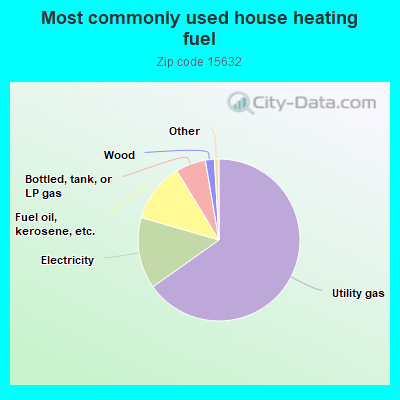
65.2%Utility gas
14.3%Electricity
11.8%Fuel oil, kerosene, etc.
6.0%Bottled, tank, or LP gas
1.8%Wood
Population in 1990: 8,364. Population change in the 1990s: +141 (+1.7%).
Place of birth for U.S.-born residents:
This state: 7,155
Northeast: 406
Midwest: 484
South: 450
West: 178
72% of the 15632 zip code residents lived in the same house 5 years ago. Out of people who lived in different houses, 64% lived in this county. Out of people who lived in different counties, 50% lived in Pennsylvania.
89% of the 15632 zip code residents lived in the same house 1 year ago. Out of people who lived in different houses, 51% moved from this county. Out of people who lived in different houses, 33% moved from different county within same state. Out of people who lived in different houses, 12% moved from different state. Out of people who lived in different houses, 3% moved from abroad.
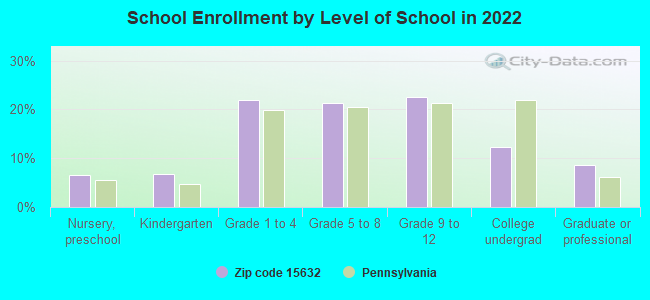
Private vs. public school enrollment:
Students in private schools in grades 1 to 8 (elementary and middle school): 128
Here:
14.1%
Pennsylvania:
15.7%
Students in private schools in grades 9 to 12 (high school): 29
Here:
6.3%
Pennsylvania:
13.4%
Students in private undergraduate colleges: 62
Here:
24.2%
Pennsylvania:
39.8%
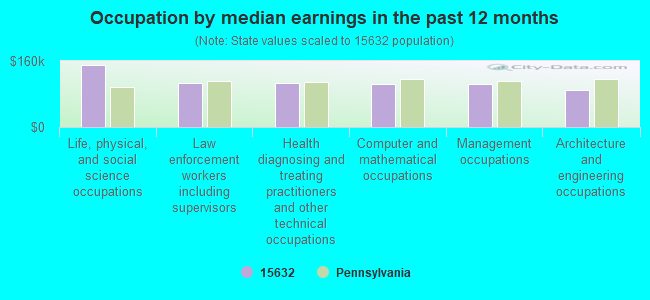
Occupation by median earnings in the past 12 months ($)
149,524Life, physical, and social science occupations
107,493Law enforcement workers including supervisors
105,924Health diagnosing and treating practitioners and other technical occupations
104,906Computer and mathematical occupations
104,674Management occupations
89,438Architecture and engineering occupations
Companies with federal contracts located in this zip code (EXPORT, PA):
E A FISCHIONE INSTRUMENTS, IN (9003 CORPORATE CIR; small business) : $332,230 in 7 contractsfrom 2002 to 2006
Contracts for Other Defense -- Applied Research and Exploratory Development (R&D), Electrical and Electronic Properties Measuring and Testing Instruments, Laboratory Equipment and Supplies, Medical and Surgical Instruments, Equipment, and Supplies by Navy, NASA, National Institute of Standards and Technology, National Institutes of Health, and others Signed by year:2000: $0; 2001: $0; 2002: $92,839; 2003: $57,471; 2004: $45,655; 2005: $111,765; 2006: $24,500.
Biggest contracts:
$65,540 with Navy for Other Defense -- Applied Research and Exploratory Development (R&D). Signed on 2005-04-18. Completion date: 2005-06-17.
$57,471 with NASA for Electrical and Electronic Properties Measuring and Testing Instruments. Signed on 2003-05-15. Completion date: 2003-07-15.
$48,000 with National Institute of Standards and Technology for Laboratory Equipment and Supplies. Taking place in MD. Signed on 2002-05-15. Completion date: 2002-07-15.
$46,225 with National Institute of Standards and Technology for Laboratory Equipment and Supplies. Signed on 2005-08-22. Completion date: 2005-10-12.
$345,543 with U.S. Army Corps of Engineers - civil program financing only for Construction of Structures and Facilities -- Highways, Roads, Streets, Bridges, and Railways (includes resurfacing). Signed on 2003-03-25. Completion date: 2003-06-30.
-$46,000, same as above.Signed on 2003-03-25. Completion date: 2003-08-22.
GLUCOSE SENSING TECHNOLOGIES,L (3000 LEXINGTON CT; small business)
$99,668 with Army for Biomedical -- Basic Research (R&D). Signed on 2004-06-17. Completion date: 2005-02-01.
KASTO-RACINE INC (3002 VENTURE CT)
$73,256 with Navy for Saws and Filing Machines. Taking place in VA. Signed on 2003-12-09. Completion date: 2003-12-09.
VERSA-MATIC TOOL INC (6017ENTERPRISE DR)
$61,759 with Defense Logistics Agency for Power and Hand Pumps. Signed on 2001-03-06. Completion date: 2001-04-12.
SAFE INNOVATIVE DRIVING TECH (2336 MOUNT VERNON AVE.)
$48,780 with Federal Bureau of Investigation for Other Education and Training Services. Signed on 2003-11-14. Completion date: 2003-11-14.
2SQ INDUSTRIAL SUPPLY INC (1002CORPORATE LANE; small business) : $19,411 in 2 contractsfrom 2004 to 2005
$16,310 with Army for Miscellaneous Special Industry Machinery. Signed on 2004-03-31. Completion date: 2004-04-16.
$3,101 with Army for Miscellaneous Items. Signed on 2005-08-19. Completion date: 2005-08-07.
FULMER COMPANY LLC (3004 VENTURE COURT; small business)
$4,650 with Defense Logistics Agency for Electrical Contact Brushes and Electrodes. Signed on 2005-11-16. Completion date: 2005-12-26.
RALPH A HILLER COMPANY (6005 ENTERPRISE DRIVE; small business)
$3,187 with Army for Laboratory Equipment and Supplies. Signed on 2002-01-23. Completion date: 2002-02-15.
Top industries in this zip code by the number of employees in 2005:
Real Estate and Rental and Leasing: Other Commercial and Industrial Machinery and Equipment Rental and Leasing (100-249 employees: 1 establishment, 10-19 employees: 1 establishment)
Arts, Entertainment, and Recreation: Golf Courses and Country Clubs (50-99: 1, 10-19: 1, 1-4: 1)
Construction: Water and Sewer Line and Related Structures Construction (50-99: 1, 1-4: 1)
People in group quarters in 2010:
111 people in college/university student housing
15 people in workers' group living quarters and job corps centers
People in group quarters in 2000:
63 people in college dormitories (includes college quarters off campus)
33 people in other noninstitutional group quarters
Fatal accident statistics in 2014:
Fatal accident count: 1
Vehicles involved in fatal accidents: 2
Fatal accidents caused by drunken drivers: 0
Fatalities: 1
Persons involved in fatal accidents: 2
Pedestrians involved in fatal accidents: 0
Fatal accident statistics in 2013:
Fatal accident count: 2
Vehicles involved in fatal accidents: 6
Fatal accidents caused by drunken drivers: 1
Fatalities: 2
Persons involved in fatal accidents: 9
Pedestrians involved in fatal accidents: 0
Home Mortgage Disclosure Act Aggregated Statistics For Year 2009 (Based on 14 partial tracts)
A) FHA, FSA/RHS & VA Home Purchase Loans
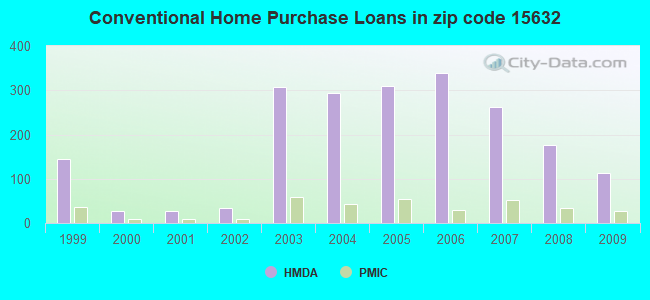
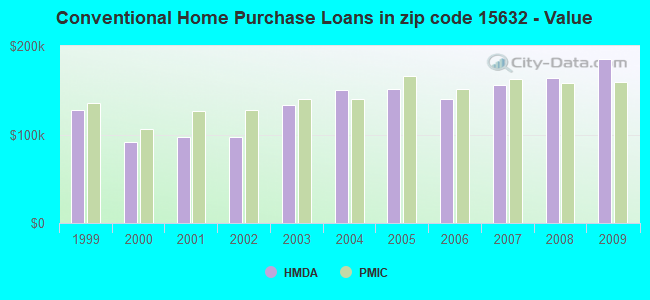
B) Conventional Home Purchase Loans
C) Refinancings
D) Home Improvement Loans
F) Non-occupant Loans on < 5 Family Dwellings (A B C & D)
G) Loans On Manufactured Home Dwelling (A B C & D)
Number
Average Value
Number
Average Value
Number
Average Value
Number
Average Value
Number
Average Value
Number
Average Value
LOANS ORIGINATED
84
$142,598
114
$184,851
494
$169,336
80
$53,415
13
$138,388
2
$53,260
APPLICATIONS APPROVED, NOT ACCEPTED
2
$219,405
7
$166,901
49
$150,993
11
$47,425
3
$55,527
0
$0
APPLICATIONS DENIED
7
$129,297
13
$183,205
157
$154,894
45
$43,087
6
$100,497
4
$71,260
APPLICATIONS WITHDRAWN
5
$175,888
9
$245,727
120
$181,232
9
$42,533
4
$282,222
1
$60,750
FILES CLOSED FOR INCOMPLETENESS
4
$159,458
2
$97,525
20
$161,825
2
$30,225
0
$0
0
$0
Aggregated Statistics For Year 2008 (Based on 14 partial tracts)
A) FHA, FSA/RHS & VA Home Purchase Loans
B) Conventional Home Purchase Loans
C) Refinancings
D) Home Improvement Loans
E) Loans on Dwellings For 5+ Families
F) Non-occupant Loans on < 5 Family Dwellings (A B C & D)
G) Loans On Manufactured Home Dwelling (A B C & D)
Number
Average Value
Number
Average Value
Number
Average Value
Number
Average Value
Number
Average Value
Number
Average Value
Number
Average Value
LOANS ORIGINATED
53
$150,070
176
$163,687
232
$155,637
99
$49,068
0
$0
21
$147,268
6
$38,903
APPLICATIONS APPROVED, NOT ACCEPTED
0
$0
25
$160,522
48
$147,646
9
$45,786
0
$0
0
$0
2
$112,110
APPLICATIONS DENIED
2
$100,455
16
$167,756
179
$163,082
55
$80,613
1
$138,440
5
$199,084
5
$82,890
APPLICATIONS WITHDRAWN
4
$127,080
28
$201,168
63
$167,867
10
$45,232
0
$0
3
$211,877
1
$61,920
FILES CLOSED FOR INCOMPLETENESS
1
$111,280
6
$153,543
16
$152,756
3
$80,077
0
$0
1
$200,710
0
$0
Aggregated Statistics For Year 2007 (Based on 14 partial tracts)
A) FHA, FSA/RHS & VA Home Purchase Loans
B) Conventional Home Purchase Loans
C) Refinancings
D) Home Improvement Loans
E) Loans on Dwellings For 5+ Families
F) Non-occupant Loans on < 5 Family Dwellings (A B C & D)
G) Loans On Manufactured Home Dwelling (A B C & D)
Number
Average Value
Number
Average Value
Number
Average Value
Number
Average Value
Number
Average Value
Number
Average Value
Number
Average Value
LOANS ORIGINATED
30
$137,390
262
$155,907
294
$125,273
108
$35,433
0
$0
19
$102,733
8
$64,590
APPLICATIONS APPROVED, NOT ACCEPTED
2
$192,450
28
$174,593
67
$128,921
15
$39,635
0
$0
4
$118,418
3
$69,603
APPLICATIONS DENIED
4
$157,348
38
$114,523
226
$143,058
60
$57,688
1
$477,890
8
$200,782
12
$45,002
APPLICATIONS WITHDRAWN
2
$90,505
23
$132,737
86
$129,064
10
$80,427
0
$0
2
$63,865
0
$0
FILES CLOSED FOR INCOMPLETENESS
1
$97,660
5
$131,098
23
$166,553
2
$93,700
0
$0
1
$76,030
0
$0
Aggregated Statistics For Year 2006 (Based on 14 partial tracts)
A) FHA, FSA/RHS & VA Home Purchase Loans
B) Conventional Home Purchase Loans
C) Refinancings
D) Home Improvement Loans
F) Non-occupant Loans on < 5 Family Dwellings (A B C & D)
G) Loans On Manufactured Home Dwelling (A B C & D)
Number
Average Value
Number
Average Value
Number
Average Value
Number
Average Value
Number
Average Value
Number
Average Value
LOANS ORIGINATED
24
$117,667
338
$139,855
373
$115,980
137
$41,323
23
$85,875
12
$36,185
APPLICATIONS APPROVED, NOT ACCEPTED
0
$0
28
$94,636
79
$116,029
18
$54,747
4
$66,590
1
$24,140
APPLICATIONS DENIED
0
$0
46
$92,301
273
$153,737
74
$51,031
10
$93,502
8
$42,372
APPLICATIONS WITHDRAWN
2
$90,985
25
$137,073
144
$142,268
7
$25,670
4
$187,070
1
$28,670
FILES CLOSED FOR INCOMPLETENESS
0
$0
1
$90,720
38
$165,500
3
$28,110
0
$0
0
$0
Aggregated Statistics For Year 2005 (Based on 14 partial tracts)
A) FHA, FSA/RHS & VA Home Purchase Loans
B) Conventional Home Purchase Loans
C) Refinancings
D) Home Improvement Loans
F) Non-occupant Loans on < 5 Family Dwellings (A B C & D)
G) Loans On Manufactured Home Dwelling (A B C & D)
Number
Average Value
Number
Average Value
Number
Average Value
Number
Average Value
Number
Average Value
Number
Average Value
LOANS ORIGINATED
14
$129,525
309
$151,478
434
$122,332
116
$44,791
35
$67,834
14
$59,586
APPLICATIONS APPROVED, NOT ACCEPTED
2
$210,750
34
$112,981
72
$131,797
24
$42,473
6
$77,982
4
$77,970
APPLICATIONS DENIED
1
$115,240
54
$122,778
299
$147,630
65
$29,383
16
$67,204
12
$43,005
APPLICATIONS WITHDRAWN
1
$78,020
38
$163,694
169
$136,186
35
$133,305
5
$107,670
2
$39,355
FILES CLOSED FOR INCOMPLETENESS
0
$0
7
$87,229
42
$154,944
0
$0
2
$55,165
0
$0
Aggregated Statistics For Year 2004 (Based on 14 partial tracts)
A) FHA, FSA/RHS & VA Home Purchase Loans
B) Conventional Home Purchase Loans
C) Refinancings
D) Home Improvement Loans
E) Loans on Dwellings For 5+ Families
F) Non-occupant Loans on < 5 Family Dwellings (A B C & D)
G) Loans On Manufactured Home Dwelling (A B C & D)
Number
Average Value
Number
Average Value
Number
Average Value
Number
Average Value
Number
Average Value
Number
Average Value
Number
Average Value
LOANS ORIGINATED
14
$97,509
294
$150,068
560
$125,527
167
$47,414
1
$148,830
33
$67,704
9
$46,237
APPLICATIONS APPROVED, NOT ACCEPTED
1
$134,420
27
$207,439
110
$123,297
24
$49,594
0
$0
6
$194,350
7
$62,247
APPLICATIONS DENIED
1
$189,220
42
$118,445
302
$137,591
77
$39,727
0
$0
18
$50,291
15
$45,205
APPLICATIONS WITHDRAWN
0
$0
35
$160,247
165
$152,108
20
$36,651
0
$0
4
$88,930
2
$123,595
FILES CLOSED FOR INCOMPLETENESS
0
$0
10
$110,104
72
$165,952
9
$59,361
0
$0
3
$69,637
0
$0
Aggregated Statistics For Year 2003 (Based on 14 partial tracts)
A) FHA, FSA/RHS & VA Home Purchase Loans
B) Conventional Home Purchase Loans
C) Refinancings
D) Home Improvement Loans
F) Non-occupant Loans on < 5 Family Dwellings (A B C & D)
Number
Average Value
Number
Average Value
Number
Average Value
Number
Average Value
Number
Average Value
LOANS ORIGINATED
27
$109,453
308
$133,550
1,379
$131,852
145
$40,998
36
$77,879
APPLICATIONS APPROVED, NOT ACCEPTED
0
$0
27
$108,575
211
$118,141
25
$46,955
8
$61,164
APPLICATIONS DENIED
3
$50,973
30
$90,226
373
$126,684
54
$43,649
14
$56,654
APPLICATIONS WITHDRAWN
2
$97,115
37
$136,815
219
$146,003
16
$26,159
2
$51,035
FILES CLOSED FOR INCOMPLETENESS
0
$0
8
$158,170
40
$145,546
5
$119,074
2
$79,260
Aggregated Statistics For Year 2002 (Based on 4 partial tracts)
A) FHA, FSA/RHS & VA Home Purchase Loans
B) Conventional Home Purchase Loans
C) Refinancings
D) Home Improvement Loans
F) Non-occupant Loans on < 5 Family Dwellings (A B C & D)
Number
Average Value
Number
Average Value
Number
Average Value
Number
Average Value
Number
Average Value
LOANS ORIGINATED
2
$103,330
33
$97,521
97
$96,733
15
$31,711
1
$67,000
APPLICATIONS APPROVED, NOT ACCEPTED
0
$0
3
$77,533
27
$93,289
5
$16,134
1
$194,950
APPLICATIONS DENIED
0
$0
9
$59,136
41
$83,280
7
$30,170
1
$65,560
APPLICATIONS WITHDRAWN
0
$0
5
$83,148
25
$95,430
1
$16,310
0
$0
FILES CLOSED FOR INCOMPLETENESS
1
$32,970
2
$94,175
5
$83,524
0
$0
1
$19,490
Aggregated Statistics For Year 2001 (Based on 4 partial tracts)
A) FHA, FSA/RHS & VA Home Purchase Loans
B) Conventional Home Purchase Loans
C) Refinancings
D) Home Improvement Loans
F) Non-occupant Loans on < 5 Family Dwellings (A B C & D)
Number
Average Value
Number
Average Value
Number
Average Value
Number
Average Value
Number
Average Value
LOANS ORIGINATED
4
$79,358
27
$96,926
78
$82,369
24
$24,391
2
$37,810
APPLICATIONS APPROVED, NOT ACCEPTED
0
$0
4
$57,770
18
$70,998
3
$40,527
0
$0
APPLICATIONS DENIED
0
$0
14
$42,744
43
$76,341
9
$11,918
1
$22,320
APPLICATIONS WITHDRAWN
0
$0
2
$100,935
24
$89,221
2
$16,950
1
$44,300
FILES CLOSED FOR INCOMPLETENESS
0
$0
1
$53,450
6
$92,735
1
$9,510
1
$54,920
Aggregated Statistics For Year 2000 (Based on 4 partial tracts)
A) FHA, FSA/RHS & VA Home Purchase Loans
B) Conventional Home Purchase Loans
C) Refinancings
D) Home Improvement Loans
F) Non-occupant Loans on < 5 Family Dwellings (A B C & D)
Number
Average Value
Number
Average Value
Number
Average Value
Number
Average Value
Number
Average Value
LOANS ORIGINATED
4
$82,400
26
$90,976
34
$66,636
20
$16,802
2
$54,650
APPLICATIONS APPROVED, NOT ACCEPTED
0
$0
4
$43,290
11
$77,303
6
$20,568
0
$0
APPLICATIONS DENIED
0
$0
13
$34,665
26
$95,051
9
$18,248
0
$0
APPLICATIONS WITHDRAWN
0
$0
1
$86,770
11
$88,331
1
$18,840
1
$36,960
FILES CLOSED FOR INCOMPLETENESS
0
$0
1
$41,080
3
$64,773
0
$0
0
$0
Aggregated Statistics For Year 1999 (Based on 4 partial tracts)
A) FHA, FSA/RHS & VA Home Purchase Loans
B) Conventional Home Purchase Loans
C) Refinancings
D) Home Improvement Loans
E) Loans on Dwellings For 5+ Families
F) Non-occupant Loans on < 5 Family Dwellings (A B C & D)
2004 - 2018 National Fire Incident Reporting System (NFIRS) incidents
Based on the data from the years 2004 - 2018 the average number of fires per year is 36. The highest number of fire incidents - 101 took place in 2007, and the least - 0 in 2013. The data has a growing trend.
When looking into fire subcategories, the most reports belonged to: Structure Fires (57.8%), and Outside Fires (23.6%).
Fire incident types reported to NFIRS in Zip Code 15632


 Nearest zip codes: 15626, 15668, 15623, 15684, 15644, 15636.


 Based on the data from the years 2004 - 2018 the average number of fires per year is 36. The highest number of fire incidents - 101 took place in 2007, and the least - 0 in 2013. The data has a growing trend.
 When looking into fire subcategories, the most reports belonged to: Structure Fires (57.8%), and Outside Fires (23.6%).