Estimated zip code population in 2022: 500 Zip code population in 2010: 500 Zip code population in 2000: 513
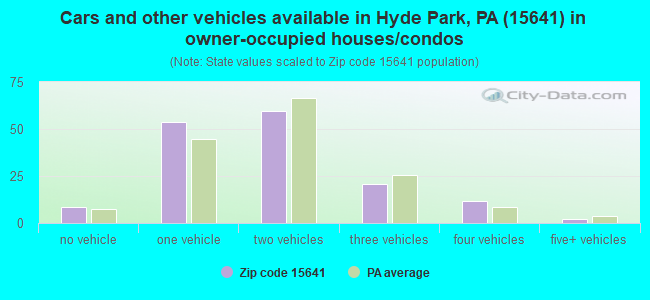
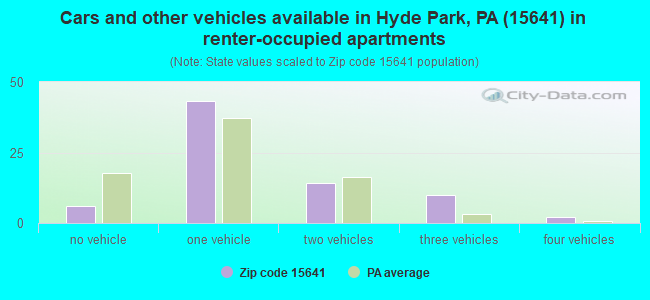
Houses and condos: 250 Renter-occupied apartments: 75
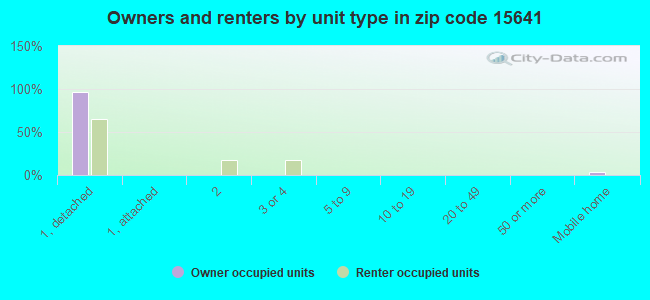
% of renters here:
33%
State:
31%
March 2022 cost of living index in zip code 15641: 88.8 (less than average, U.S. average is 100)
Land area: 0.2 sq. mi. Water area: 0.1 sq. mi.
Population density: 2,080 people per square mile
(low).
OSM Map
General Map
Google Map
MSN Map
OSM Map
General Map
Google Map
MSN Map
OSM Map
General Map
Google Map
MSN Map
OSM Map
General Map
Google Map
MSN Map
Please wait while loading the map...
Real estate property taxes paid for housing units in 2022:
This zip code:
1.1% ($1,399)
Pennsylvania:
1.3% ($3,094)
Median real estate property taxes paid for housing units with mortgages in 2022: $1,598 (1.3%) Median real estate property taxes paid for housing units with no mortgage in 2022: $1,296 (1.0%)
Business Search- 14 Million verified businesses
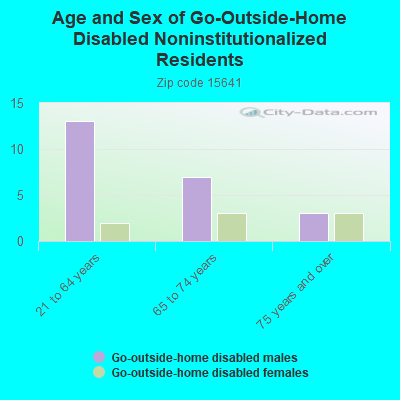
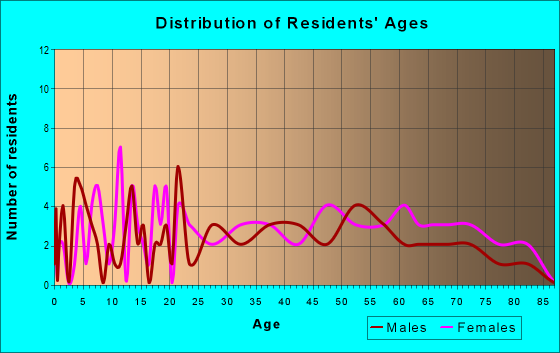
Males: 215
(43.1%)
Females: 284
(56.9%)
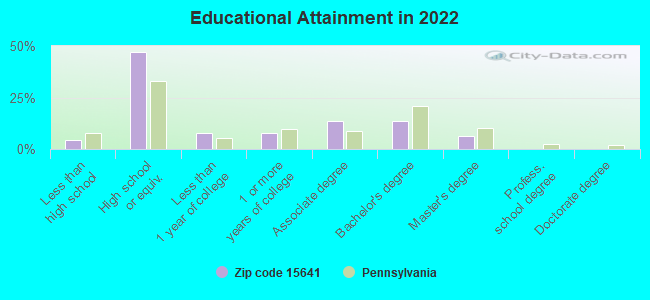
For population 25 years and over in 15641:
High school or higher: 95.0%
Bachelor's degree or higher: 19.7%
Graduate or professional degree: 6.3%
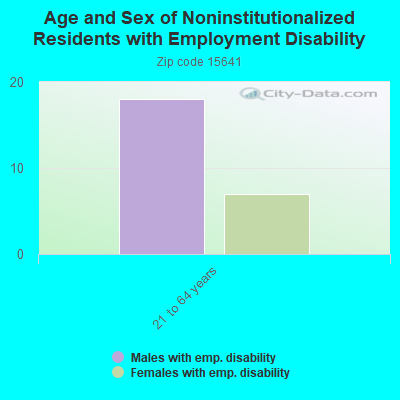
Unemployed: 6.4%
Mean travel time to work (commute): 28.4 minutes
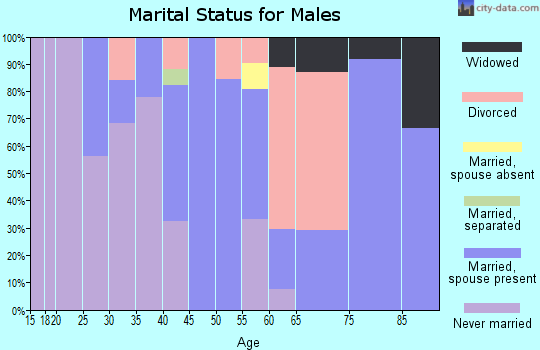
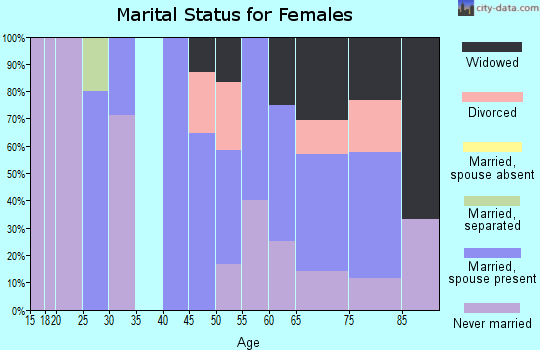
For population 15 years and over in 15641:
Never married: 32.8%
Now married: 44.9%
Separated: 0.9%
Widowed: 10.0%
Divorced: 11.5%
Zip code 15641 compared to state average:
Median house value below state average.
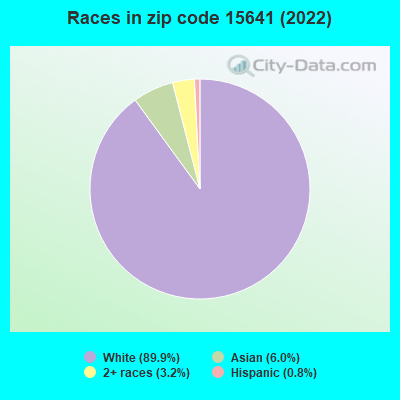
Black race population percentage significantly below state average.
Hispanic race population percentage significantly below state average.
Foreign-born population percentage significantly below state average.
Length of stay since moving in above state average.
Percentage of population with a bachelor's degree or higher below state average.
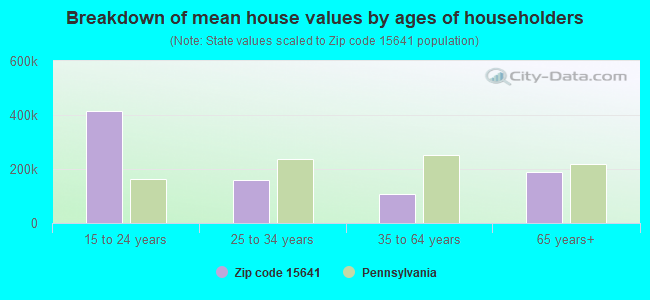
Estimated median house/condo value in 2022: $126,983
15641:
$126,983
Pennsylvania:
$245,500
According to our research of Pennsylvania and other state lists, there was 1 registered sex offender living in 15641 zip code as of May 20, 2024. The ratio of all residents to sex offenders in zip code 15641 is 457 to 1.
Median resident age:
This zip code:
40.6 years
Pennsylvania median age:
40.9 years
Average household size:
This zip code:
2.2 people
Pennsylvania:
2.4 people
Averages for the 2020 tax year for zip code 15641, filed in 2021:
Average Adjusted Gross Income (AGI) in 2020: $46,054 (Individual Income Tax Returns)
Here:
$46,054
State:
$75,707
Salary/wage: $41,891 (reported on 78.6% of returns)
Here:
$41,891
State:
$62,806
(% of AGI for various income ranges: 1051.7% for AGIs below $25k, 3020.0% for AGIs $25k-50k, 5967.5% for AGIs $50k-75k, 10210.0% for AGIs $75k-100k)
Taxable interest for individuals: $340 (reported on 17.9% of returns)
This zip code:
$340
Pennsylvania:
$1,633
(% of AGI for various income ranges: 24.3% for AGIs $25k-50k)
Ordinary dividends: $1,533 (reported on 10.7% of returns)
Here:
$1,533
State:
$7,382
(% of AGI for various income ranges: 65.7% for AGIs $25k-50k)
Net capital gain/loss in AGI: +$1,550 (reported on 7.1% of returns)
Here:
+$1,550
State:
+$23,522
(% of AGI for various income ranges: 44.3% for AGIs $25k-50k)
Earned income credit: $2,167 (reported on 10.7% of returns)
Here:
$2,167
State:
$2,100
(% of AGI for various income ranges: 108.3% for AGIs below $25k)
Percentage of individuals using paid preparers for their 2020 taxes: 89.3%
Here:
89%
State:
92%
(% for various income ranges: 88.9% for AGIs below $25k, 88.9% for AGIs $25k-50k, 80.0% for AGIs $50k-75k, 166.7% for AGIs $75k-100k, 0.0% for AGIs $100k-200k)
Averages for the 2012 tax year for zip code 15641, filed in 2013:
Average Adjusted Gross Income (AGI) in 2012: $38,123 (Individual Income Tax Returns)
Here:
$38,123
State:
$61,346
Salary/wage: $36,500 (reported on 76.9% of returns)
Here:
$36,500
State:
$51,902
(% of AGI for various income ranges: 69.2% for AGIs below $25k, 69.0% for AGIs $25k-50k, 72.6% for AGIs $50k-75k, 81.8% for AGIs $75k-100k)
Taxable interest for individuals: $867 (reported on 23.1% of returns)
This zip code:
$867
Pennsylvania:
$1,588
(% of AGI for various income ranges: 0.6% for AGIs below $25k, 1.1% for AGIs $25k-50k, 0.4% for AGIs $50k-75k)
Ordinary dividends: $2,120 (reported on 19.2% of returns)
Here:
$2,120
State:
$5,827
(% of AGI for various income ranges: 7.8% for AGIs below $25k, 0.3% for AGIs $50k-75k)
Net capital gain/loss in AGI: +$350 (reported on 7.7% of returns)
Here:
+$350
State:
+$14,495
Taxable individual retirement arrangement distribution: $6,267 (reported on 11.5% of returns)
15641:
$6,267
Pennsylvania:
$14,550
Total itemized deductions: $14,733 (18% of AGI, reported on 11.5% of returns)
Here:
$14,733
State:
$23,538
Here:
18.2% of AGI
State:
18.4% of AGI
Charity contributions: $1,250 (reported on 7.7% of returns)
Here:
$1,250
State:
$4,025
(% of AGI for various income ranges: 0.8% for AGIs $25k-50k)
Taxes paid: $5,167 (reported on 11.5% of returns)
15641:
$5,167
State:
$9,982
Earned income credit: $1,980 (reported on 19.2% of returns)
Here:
$1,980
State:
$2,106
(% of AGI for various income ranges: 7.8% for AGIs below $25k)
Percentage of individuals using paid preparers for their 2012 taxes: 50.0%
Here:
50%
State:
53%
(% for various income ranges: 40.0% for AGIs below $25k, 55.6% for AGIs $25k-50k, 100.0% for AGIs $50k-75k)
Averages for the 2004 tax year for zip code 15641, filed in 2005:
Average Adjusted Gross Income (AGI) in 2004: $33,515 (Individual Income Tax Returns)
Here:
$33,515
State:
$48,049
Salary/wage: $29,745 (reported on 80.0% of returns)
Here:
$29,745
State:
$42,646
(% of AGI for various income ranges: 70.8% for AGIs below $10k, 74.0% for AGIs $10k-25k, 74.8% for AGIs $25k-50k, 81.1% for AGIs $50k-75k, 116.5% for AGIs $75k-100k)
Taxable interest for individuals: $3,114 (reported on 42.2% of returns)
This zip code:
$3,114
Pennsylvania:
$1,657
(% of AGI for various income ranges: 6.2% for AGIs below $10k, 2.6% for AGIs $10k-25k, 2.9% for AGIs $25k-50k, 1.7% for AGIs $50k-75k, 13.9% for AGIs over 100k)
Taxable dividends: $1,421 (reported on 21.1% of returns)
Here:
$1,421
State:
$3,566
(% of AGI for various income ranges: 8.6% for AGIs below $10k, 1.5% for AGIs $25k-50k, 0.4% for AGIs $50k-75k, 0.5% for AGIs $75k-100k)
Profit/loss from business: +$1,667 (reported on 5.6% of returns)
Here:
+$1,667
State:
+$14,267
Total itemized deductions: $13,000 (21% of AGI, reported on 12.2% of returns)
Here:
$13,000
State:
$18,804
Here:
21.0% of AGI
State:
19.5% of AGI
Charity contributions deductions: $1,043 (2% of AGI, reported on 8.5% of returns)
Here:
$1,043
State:
$3,337
Here:
1.7% of AGI
State:
3.3% of AGI
Total tax: $4,057 (reported on 71.5% of returns)
15641:
$4,057
State:
$8,008
(% of AGI for various income ranges: 3.1% for AGIs $10k-25k, 6.8% for AGIs $25k-50k, 8.9% for AGIs $50k-75k, 11.8% for AGIs $75k-100k, 16.1% for AGIs over 100k)
Earned income credit: $1,595 (reported on 13.7% of returns)
Here:
$1,595
State:
$1,643
Percentage of individuals using paid preparers for their 2004 taxes: 57.0%
Here:
57%
State:
56%
(% for various income ranges: 47.4% for AGIs below $10k, 51.4% for AGIs $10k-25k, 60.0% for AGIs $25k-50k, 80.0% for AGIs $50k-75k, 100.0% for AGIs $75k-100k)
Household received Food Stamps/SNAP in the past 12 months: 42 Household did not receive Food Stamps/SNAP in the past 12 months: 189
Women who had a birth in the past 12 months: 3 (3 now married, 0 unmarried) Women who did not have a birth in the past 12 months: 122 (40 now married, 81 unmarried)
Housing units in zip code 15641 with a mortgage: 78 (6 second mortgage, 3 both second mortgage and home equity loan) Houses without a mortgage: 3
Median monthly owner costs for units with a mortgage: $1,042 Median monthly owner costs for units without a mortgage: $424
Residents with income below the poverty level in 2022:
This zip code:
7.1%
Whole state:
11.8%
Residents with income below 50% of the poverty level in 2022:
This zip code:
6.1%
Whole state:
6.1%
Median number of rooms in houses and condos:
Here:
6.1
State:
6.8
Median number of rooms in apartments:
Here:
5.7
State:
4.3
Notable locations in this zip code not listed on our city pages
Size of family households: 57 2-persons, 37 3-persons, 11 4-persons, 14 7-or-more-persons
Size of nonfamily households: 88 1-person, 23 2-persons
64 married couples with children.
37 single-parent households (27 men, 10 women).
97.7% of residents of 15641 zip code speak English at home.
0.4% of residents speak Spanish at home (100% very well).
0.8% of residents speak other Indo-European language at home (100% very well).
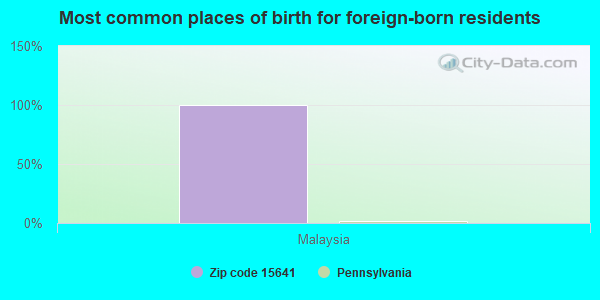
Foreign born population: 8 (1.7%) (100.0% of them are naturalized citizens)
This zip code:
1.7%
Whole state:
7.5%
100%Malaysia
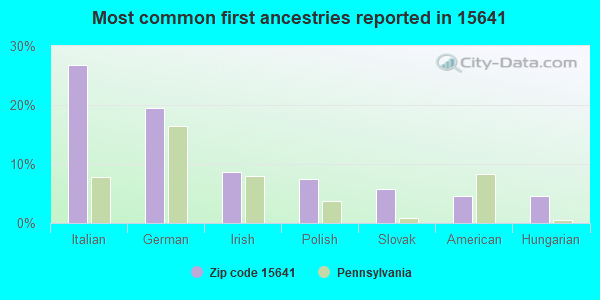
27%Italian
19%German
9%Irish
7%Polish
6%Slovak
5%American
5%Hungarian
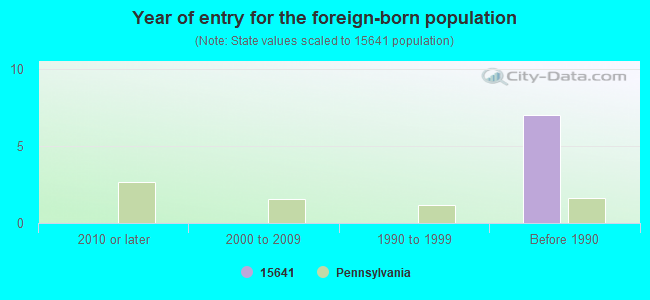
Year of entry for the foreign-born population
02010 or later
02000 to 2009
01990 to 1999
7Before 1990
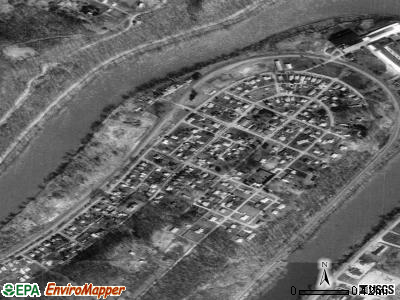
Facilities with environmental interests located in this zip code:
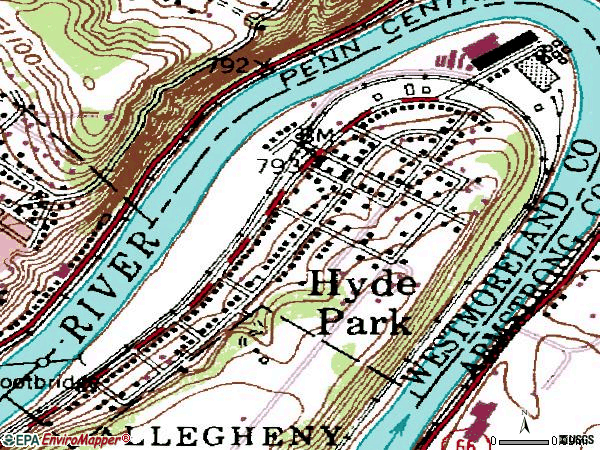
AKERS NATIONAL ROLL (HYDE PARK in HYDE PARK, PA)
National Pollutant Discharge Elimination System NON-MAJOR (Tracking pollutant discharge elimination systems) - permit Business SIC classification: GRAY AND DUCTILE IRON FOUNDRIES
Housing units lacking complete kitchen facilities: 4.7%
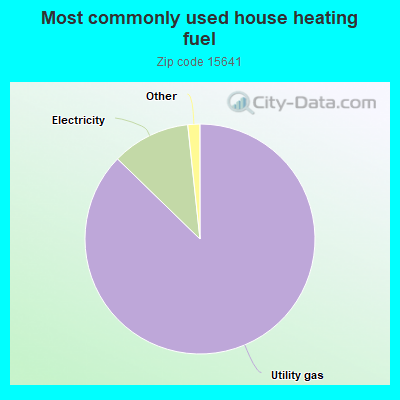
87.8%Utility gas
11.1%Electricity
0.9%Bottled, tank, or LP gas
0.9%Wood
Population in 1990: 542.
Place of birth for U.S.-born residents:
This state: 410
Northeast: 8
Midwest: 4
South: 58
West: 8
72% of the 15641 zip code residents lived in the same house 5 years ago. Out of people who lived in different houses, 59% lived in this county. Out of people who lived in different counties, 50% lived in Pennsylvania.
94% of the 15641 zip code residents lived in the same house 1 year ago. Out of people who lived in different houses, 50% moved from this county. Out of people who lived in different houses, 50% moved from different county within same state.
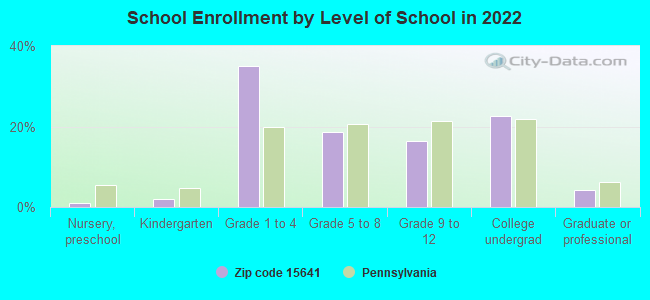
Private vs. public school enrollment:
Students in private schools in grades 1 to 8 (elementary and middle school): 6
Here:
12.2%
Pennsylvania:
15.7%
Students in private schools in grades 9 to 12 (high school): 1
Here:
11.3%
Pennsylvania:
13.4%
Students in private undergraduate colleges: 1
Here:
8.6%
Pennsylvania:
39.8%
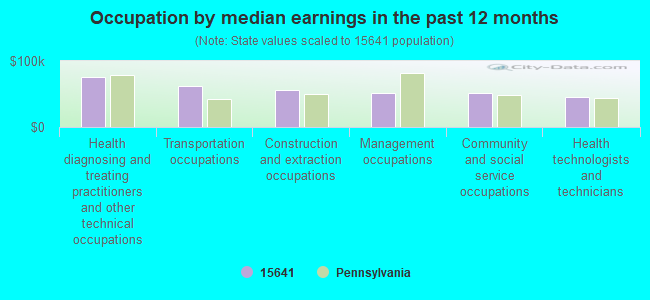
Occupation by median earnings in the past 12 months ($)
76,203Health diagnosing and treating practitioners and other technical occupations
61,883Transportation occupations
56,210Construction and extraction occupations
51,983Management occupations
51,846Community and social service occupations
46,017Health technologists and technicians
Top industries in this zip code by the number of employees in 2005:
Health Care and Social Assistance: Residential Mental Retardation Facilities (10-19 employees: 1 establishment)
Accommodation and Food Services: Drinking Places (Alcoholic Beverages) (1-4: 1)
Construction: Site Preparation Contractors (1-4: 1)
People in group quarters in 2000:
6 people in homes for the mentally retarded
Home Mortgage Disclosure Act Aggregated Statistics For Year 2009 (Based on 2 partial tracts)
A) FHA, FSA/RHS & VA Home Purchase Loans
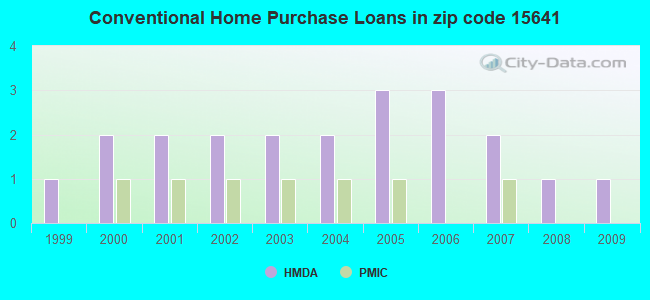
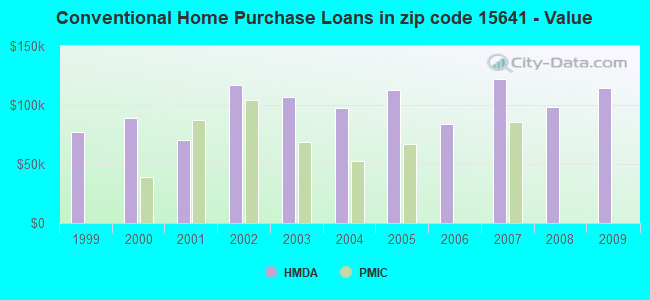
B) Conventional Home Purchase Loans
C) Refinancings
D) Home Improvement Loans
Number
Average Value
Number
Average Value
Number
Average Value
Number
Average Value
LOANS ORIGINATED
1
$144,550
1
$114,610
3
$117,907
0
$0
APPLICATIONS APPROVED, NOT ACCEPTED
0
$0
0
$0
0
$0
0
$0
APPLICATIONS DENIED
0
$0
0
$0
2
$83,440
1
$17,500
APPLICATIONS WITHDRAWN
0
$0
0
$0
1
$138,020
0
$0
FILES CLOSED FOR INCOMPLETENESS
0
$0
0
$0
0
$0
0
$0
Aggregated Statistics For Year 2008 (Based on 2 partial tracts)
A) FHA, FSA/RHS & VA Home Purchase Loans
B) Conventional Home Purchase Loans
C) Refinancings
D) Home Improvement Loans
Number
Average Value
Number
Average Value
Number
Average Value
Number
Average Value
LOANS ORIGINATED
1
$130,120
1
$98,580
2
$135,540
1
$32,310
APPLICATIONS APPROVED, NOT ACCEPTED
0
$0
0
$0
0
$0
0
$0
APPLICATIONS DENIED
0
$0
0
$0
2
$128,975
0
$0
APPLICATIONS WITHDRAWN
0
$0
0
$0
1
$113,230
0
$0
FILES CLOSED FOR INCOMPLETENESS
0
$0
0
$0
0
$0
0
$0
Aggregated Statistics For Year 2007 (Based on 2 partial tracts)
B) Conventional Home Purchase Loans
C) Refinancings
D) Home Improvement Loans
Number
Average Value
Number
Average Value
Number
Average Value
LOANS ORIGINATED
2
$121,825
2
$92,860
1
$52,360
APPLICATIONS APPROVED, NOT ACCEPTED
0
$0
0
$0
0
$0
APPLICATIONS DENIED
0
$0
3
$80,137
1
$44,060
APPLICATIONS WITHDRAWN
0
$0
1
$76,160
0
$0
FILES CLOSED FOR INCOMPLETENESS
0
$0
0
$0
0
$0
Aggregated Statistics For Year 2006 (Based on 2 partial tracts)
B) Conventional Home Purchase Loans
C) Refinancings
D) Home Improvement Loans
Number
Average Value
Number
Average Value
Number
Average Value
LOANS ORIGINATED
3
$83,793
3
$68,847
1
$32,440
APPLICATIONS APPROVED, NOT ACCEPTED
1
$72,840
1
$72,840
0
$0
APPLICATIONS DENIED
1
$43,070
3
$109,397
1
$70,720
APPLICATIONS WITHDRAWN
0
$0
1
$132,880
0
$0
FILES CLOSED FOR INCOMPLETENESS
0
$0
0
$0
0
$0
Aggregated Statistics For Year 2005 (Based on 2 partial tracts)
A) FHA, FSA/RHS & VA Home Purchase Loans
B) Conventional Home Purchase Loans
C) Refinancings
D) Home Improvement Loans
Number
Average Value
Number
Average Value
Number
Average Value
Number
Average Value
LOANS ORIGINATED
1
$115,990
3
$112,940
4
$107,902
1
$41,730
APPLICATIONS APPROVED, NOT ACCEPTED
0
$0
0
$0
1
$71,320
0
$0
APPLICATIONS DENIED
0
$0
1
$29,980
3
$96,710
1
$10,020
APPLICATIONS WITHDRAWN
0
$0
0
$0
2
$98,970
0
$0
FILES CLOSED FOR INCOMPLETENESS
0
$0
0
$0
0
$0
0
$0
Aggregated Statistics For Year 2004 (Based on 2 partial tracts)
B) Conventional Home Purchase Loans
C) Refinancings
D) Home Improvement Loans
Number
Average Value
Number
Average Value
Number
Average Value
LOANS ORIGINATED
2
$97,870
4
$103,172
2
$26,675
APPLICATIONS APPROVED, NOT ACCEPTED
0
$0
1
$72,580
1
$10,410
APPLICATIONS DENIED
1
$27,130
3
$100,613
1
$23,460
APPLICATIONS WITHDRAWN
0
$0
3
$97,847
0
$0
FILES CLOSED FOR INCOMPLETENESS
0
$0
1
$61,990
0
$0
Aggregated Statistics For Year 2003 (Based on 2 partial tracts)
B) Conventional Home Purchase Loans
C) Refinancings
D) Home Improvement Loans
Number
Average Value
Number
Average Value
Number
Average Value
LOANS ORIGINATED
2
$106,620
9
$93,120
2
$17,325
APPLICATIONS APPROVED, NOT ACCEPTED
0
$0
1
$118,320
0
$0
APPLICATIONS DENIED
0
$0
4
$94,165
1
$25,620
APPLICATIONS WITHDRAWN
0
$0
2
$93,120
0
$0
FILES CLOSED FOR INCOMPLETENESS
0
$0
0
$0
0
$0
Aggregated Statistics For Year 2002 (Based on 2 partial tracts)
B) Conventional Home Purchase Loans
C) Refinancings
D) Home Improvement Loans
Number
Average Value
Number
Average Value
Number
Average Value
LOANS ORIGINATED
2
$116,725
6
$80,777
2
$18,985
APPLICATIONS APPROVED, NOT ACCEPTED
0
$0
1
$94,650
0
$0
APPLICATIONS DENIED
0
$0
3
$85,983
1
$28,940
APPLICATIONS WITHDRAWN
0
$0
3
$78,523
0
$0
FILES CLOSED FOR INCOMPLETENESS
0
$0
1
$46,010
0
$0
Aggregated Statistics For Year 2001 (Based on 2 partial tracts)
B) Conventional Home Purchase Loans
C) Refinancings
D) Home Improvement Loans
Number
Average Value
Number
Average Value
Number
Average Value
LOANS ORIGINATED
2
$70,375
5
$77,804
2
$17,000
APPLICATIONS APPROVED, NOT ACCEPTED
0
$0
1
$83,160
0
$0
APPLICATIONS DENIED
1
$34,210
3
$51,193
1
$19,830
APPLICATIONS WITHDRAWN
0
$0
2
$87,050
0
$0
FILES CLOSED FOR INCOMPLETENESS
0
$0
1
$64,070
0
$0
Aggregated Statistics For Year 2000 (Based on 2 partial tracts)
A) FHA, FSA/RHS & VA Home Purchase Loans
B) Conventional Home Purchase Loans
C) Refinancings
D) Home Improvement Loans
Number
Average Value
Number
Average Value
Number
Average Value
Number
Average Value
LOANS ORIGINATED
1
$32,960
2
$88,905
2
$63,570
2
$19,935
APPLICATIONS APPROVED, NOT ACCEPTED
0
$0
0
$0
1
$45,450
0
$0
APPLICATIONS DENIED
0
$0
1
$41,000
2
$66,875
1
$11,620
APPLICATIONS WITHDRAWN
0
$0
0
$0
1
$80,140
0
$0
FILES CLOSED FOR INCOMPLETENESS
0
$0
0
$0
0
$0
0
$0
Aggregated Statistics For Year 1999 (Based on 1 partial tract)


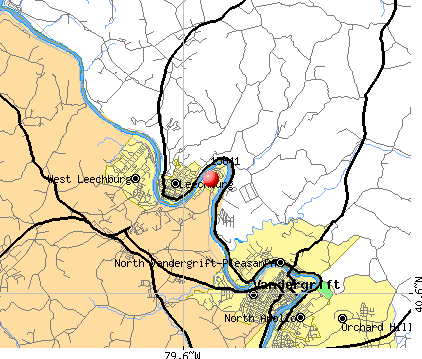 Nearest zip codes: 15690, 15629, 15656, 15673, 15613, 16229.