Estimated zip code population in 2022: 1,049 Zip code population in 2010: 972 Zip code population in 2000: 1,322
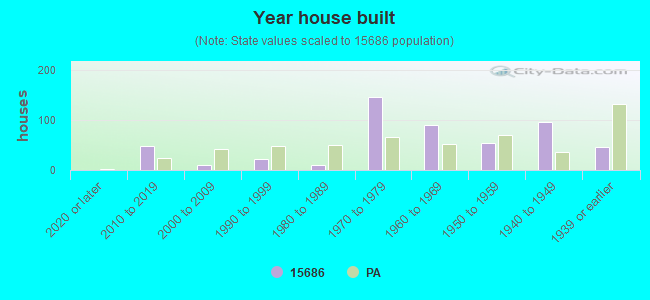
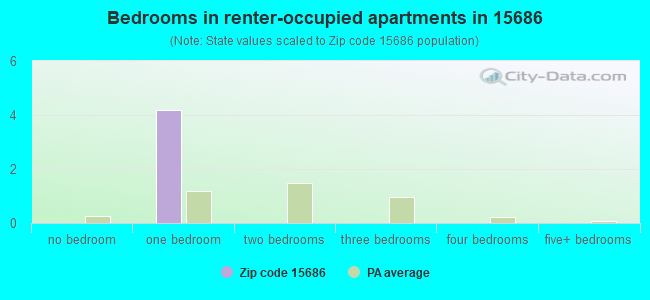
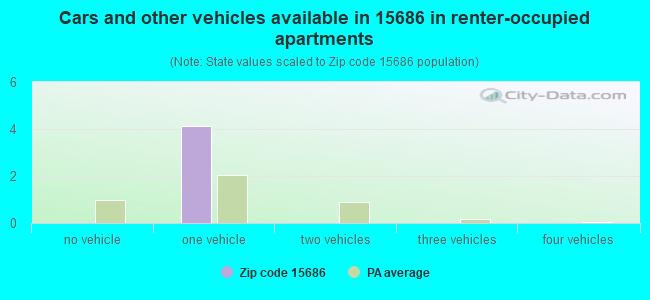
Houses and condos: 526 Renter-occupied apartments: 4
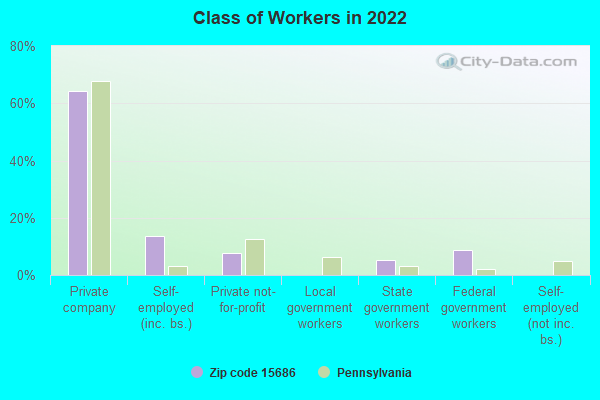
% of renters here:
1%
State:
31%
March 2022 cost of living index in zip code 15686: 91.0 (less than average, U.S. average is 100)
Land area: 10.2 sq. mi. Water area: 0.1 sq. mi.
Population density: 103 people per square mile
(very low).
OSM Map
General Map
Google Map
MSN Map
OSM Map
General Map
Google Map
MSN Map
OSM Map
General Map
Google Map
MSN Map
OSM Map
General Map
Google Map
MSN Map
Please wait while loading the map...
Real estate property taxes paid for housing units in 2022:
This zip code:
1.2% ($2,731)
Pennsylvania:
1.3% ($3,094)
Median real estate property taxes paid for housing units with mortgages in 2022: $5,275 (2.7%) Median real estate property taxes paid for housing units with no mortgage in 2022: $2,116 (0.9%)
Business Search- 14 Million verified businesses
Males: 526
(50.1%)
Females: 523
(49.9%)
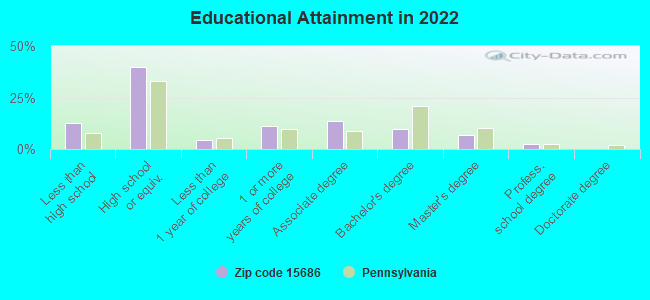
For population 25 years and over in 15686:
High school or higher: 86.1%
Bachelor's degree or higher: 18.8%
Graduate or professional degree: 9.3%
Mean travel time to work (commute): 23.2 minutes
For population 15 years and over in 15686:
Never married: 19.7%
Now married: 66.4%
Separated: 0.6%
Widowed: 4.1%
Divorced: 9.1%
Zip code 15686 compared to state average:
Unemployed percentage significantly below state average.
Black race population percentage significantly below state average.
Hispanic race population percentage significantly below state average.
Median age significantly above state average.
Foreign-born population percentage significantly below state average.
Renting percentage significantly below state average.
Percentage of population with a bachelor's degree or higher below state average.
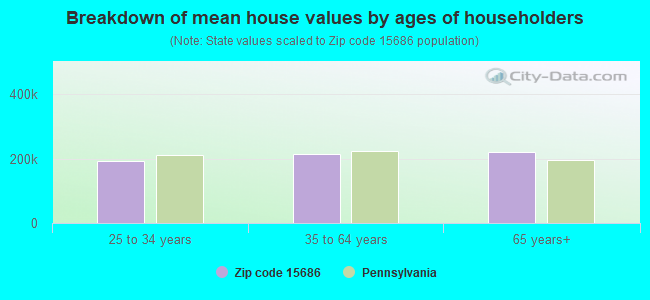
Estimated median house/condo value in 2022: $225,422
15686:
$225,422
Pennsylvania:
$245,500
Median resident age:
This zip code:
52.5 years
Pennsylvania median age:
40.9 years
Average household size:
This zip code:
2.2 people
Pennsylvania:
2.4 people
Averages for the 2020 tax year for zip code 15686, filed in 2021:
Average Adjusted Gross Income (AGI) in 2020: $63,779 (Individual Income Tax Returns)
Here:
$63,779
State:
$75,707
Salary/wage: $56,074 (reported on 72.1% of returns)
Here:
$56,074
State:
$62,806
(% of AGI for various income ranges: 1211.4% for AGIs below $25k, 3125.7% for AGIs $25k-50k, 4956.7% for AGIs $50k-75k, 7075.0% for AGIs $75k-100k, 17086.0% for AGIs $100k-200k)
Taxable interest for individuals: $711 (reported on 41.9% of returns)
This zip code:
$711
Pennsylvania:
$1,633
(% of AGI for various income ranges: 18.6% for AGIs below $25k, 11.4% for AGIs $25k-50k, 105.0% for AGIs $50k-75k, 88.0% for AGIs $100k-200k)
Ordinary dividends: $5,242 (reported on 27.9% of returns)
Here:
$5,242
State:
$7,382
(% of AGI for various income ranges: 34.3% for AGIs below $25k, 95.7% for AGIs $25k-50k, 573.3% for AGIs $50k-75k, 388.0% for AGIs $100k-200k)
Net capital gain/loss in AGI: +$3,036 (reported on 25.6% of returns)
Here:
+$3,036
State:
+$23,522
(% of AGI for various income ranges: 18.6% for AGIs below $25k, 265.0% for AGIs $50k-75k, 324.0% for AGIs $100k-200k)
Profit/loss from business: +$3,200 (reported on 9.3% of returns)
Here:
+$3,200
State:
+$16,274
(% of AGI for various income ranges: 213.3% for AGIs $50k-75k)
Taxable individual retirement arrangement distribution: $14,000 (reported on 16.3% of returns)
15686:
$14,000
Pennsylvania:
$18,583
(% of AGI for various income ranges: 578.6% for AGIs $25k-50k, 1437.5% for AGIs $75k-100k)
Earned income credit: $1,800 (reported on 7.0% of returns)
Here:
$1,800
State:
$2,100
(% of AGI for various income ranges: 77.1% for AGIs below $25k)
Percentage of individuals using paid preparers for their 2020 taxes: 93.0%
Here:
93%
State:
92%
(% for various income ranges: 83.3% for AGIs below $25k, 100.0% for AGIs $25k-50k, 88.9% for AGIs $50k-75k, 100.0% for AGIs $75k-100k, 100.0% for AGIs $100k-200k)
Averages for the 2012 tax year for zip code 15686, filed in 2013:
Average Adjusted Gross Income (AGI) in 2012: $48,952 (Individual Income Tax Returns)
Here:
$48,952
State:
$61,346
Salary/wage: $42,246 (reported on 76.1% of returns)
Here:
$42,246
State:
$51,902
(% of AGI for various income ranges: 58.2% for AGIs below $25k, 71.3% for AGIs $25k-50k, 68.1% for AGIs $50k-75k, 72.4% for AGIs $75k-100k, 59.9% for AGIs $100k-200k)
Taxable interest for individuals: $548 (reported on 45.7% of returns)
This zip code:
$548
Pennsylvania:
$1,588
(% of AGI for various income ranges: 2.7% for AGIs below $25k, 0.4% for AGIs $25k-50k, 0.4% for AGIs $50k-75k, 0.2% for AGIs $75k-100k, 0.2% for AGIs $100k-200k)
Ordinary dividends: $3,536 (reported on 30.4% of returns)
Here:
$3,536
State:
$5,827
(% of AGI for various income ranges: 6.4% for AGIs below $25k, 3.7% for AGIs $25k-50k, 2.3% for AGIs $50k-75k, 1.4% for AGIs $100k-200k)
Net capital gain/loss in AGI: +$514 (reported on 15.2% of returns)
Here:
+$514
State:
+$14,495
(% of AGI for various income ranges: 0.5% for AGIs $25k-50k, 0.3% for AGIs $100k-200k)
Profit/loss from business: +$6,000 (reported on 8.7% of returns)
Here:
+$6,000
State:
+$16,268
Taxable individual retirement arrangement distribution: $13,171 (reported on 15.2% of returns)
15686:
$13,171
Pennsylvania:
$14,550
Total itemized deductions: $17,670 (19% of AGI, reported on 21.7% of returns)
Here:
$17,670
State:
$23,538
Here:
19.0% of AGI
State:
18.4% of AGI
(% of AGI for various income ranges: 14.6% for AGIs $25k-50k, 8.2% for AGIs $75k-100k, 10.4% for AGIs $100k-200k)
Charity contributions: $3,057 (reported on 15.2% of returns)
Here:
$3,057
State:
$4,025
Taxes paid: $7,060 (reported on 21.7% of returns)
15686:
$7,060
State:
$9,982
(% of AGI for various income ranges: 4.9% for AGIs $25k-50k, 3.4% for AGIs $75k-100k, 4.6% for AGIs $100k-200k)
Earned income credit: $1,643 (reported on 15.2% of returns)
Here:
$1,643
State:
$2,106
(% of AGI for various income ranges: 3.1% for AGIs below $25k, 1.2% for AGIs $25k-50k)
Percentage of individuals using paid preparers for their 2012 taxes: 58.7%
Here:
59%
State:
53%
(% for various income ranges: 52.9% for AGIs below $25k, 50.0% for AGIs $25k-50k, 71.4% for AGIs $50k-75k, 60.0% for AGIs $75k-100k, 80.0% for AGIs $100k-200k)
Averages for the 2004 tax year for zip code 15686, filed in 2005:
Average Adjusted Gross Income (AGI) in 2004: $39,303 (Individual Income Tax Returns)
Here:
$39,303
State:
$48,049
Salary/wage: $35,861 (reported on 79.1% of returns)
Here:
$35,861
State:
$42,646
(% of AGI for various income ranges: 186.9% for AGIs below $10k, 59.6% for AGIs $10k-25k, 74.9% for AGIs $25k-50k, 75.5% for AGIs $50k-75k, 69.9% for AGIs $75k-100k, 70.0% for AGIs over 100k)
Taxable interest for individuals: $1,102 (reported on 55.2% of returns)
This zip code:
$1,102
Pennsylvania:
$1,657
(% of AGI for various income ranges: 21.2% for AGIs below $10k, 2.6% for AGIs $10k-25k, 1.9% for AGIs $25k-50k, 1.2% for AGIs $50k-75k, 0.7% for AGIs $75k-100k, 1.1% for AGIs over 100k)
Taxable dividends: $1,880 (reported on 31.8% of returns)
Here:
$1,880
State:
$3,566
(% of AGI for various income ranges: 6.1% for AGIs below $10k, 4.6% for AGIs $10k-25k, 1.9% for AGIs $25k-50k, 0.6% for AGIs $50k-75k, 0.5% for AGIs $75k-100k, 1.3% for AGIs over 100k)
Net capital gain/loss: +$1,500 (reported on 19.7% of returns)
Here:
+$1,500
State:
+$9,716
(% of AGI for various income ranges: 70.7% for AGIs below $10k, -0.0% for AGIs $25k-50k, 1.0% for AGIs $50k-75k, 0.9% for AGIs $75k-100k, -0.1% for AGIs over 100k)
Profit/loss from business: +$8,121 (reported on 14.8% of returns)
Here:
+$8,121
State:
+$14,267
Total itemized deductions: $14,114 (21% of AGI, reported on 23.5% of returns)
Here:
$14,114
State:
$18,804
Here:
21.0% of AGI
State:
19.5% of AGI
(% of AGI for various income ranges: 123.2% for AGIs below $10k, 8.1% for AGIs $25k-50k, 8.0% for AGIs $50k-75k, 11.4% for AGIs $75k-100k, 8.0% for AGIs over 100k)
Charity contributions deductions: $2,123 (3% of AGI, reported on 18.2% of returns)
Here:
$2,123
State:
$3,337
Here:
3.0% of AGI
State:
3.3% of AGI
(% of AGI for various income ranges: 1.6% for AGIs $25k-50k, 0.5% for AGIs $50k-75k, 0.7% for AGIs $75k-100k, 1.4% for AGIs over 100k)
Total tax: $4,933 (reported on 76.7% of returns)
15686:
$4,933
State:
$8,008
(% of AGI for various income ranges: 13.1% for AGIs below $10k, 4.4% for AGIs $10k-25k, 6.7% for AGIs $25k-50k, 8.4% for AGIs $50k-75k, 11.5% for AGIs $75k-100k, 16.1% for AGIs over 100k)
Earned income credit: $1,520 (reported on 11.2% of returns)
Here:
$1,520
State:
$1,643
Percentage of individuals using paid preparers for their 2004 taxes: 65.7%
Here:
66%
State:
56%
(% for various income ranges: 54.7% for AGIs below $10k, 62.6% for AGIs $10k-25k, 68.1% for AGIs $25k-50k, 75.4% for AGIs $50k-75k, 73.0% for AGIs $75k-100k, 63.0% for AGIs over 100k)
Household received Food Stamps/SNAP in the past 12 months: 3 Household did not receive Food Stamps/SNAP in the past 12 months: 462
Women who had a birth in the past 12 months: 17 (18 now married, 0 unmarried) Women who did not have a birth in the past 12 months: 196 (75 now married, 122 unmarried)
Housing units in zip code 15686 with a mortgage: 236 Median monthly owner costs for units with a mortgage: $1,127 Median monthly owner costs for units without a mortgage: $481
Residents with income below the poverty level in 2022:
This zip code:
5.9%
Whole state:
11.8%
Residents with income below 50% of the poverty level in 2022:
This zip code:
5.6%
Whole state:
6.1%
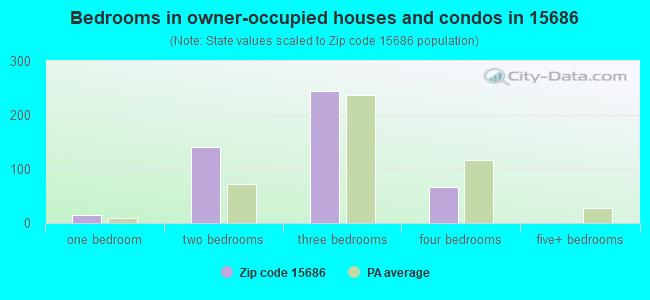
Median number of rooms in houses and condos:
Here:
5.5
State:
6.8
Notable locations in this zip code not listed on our city pages
Size of family households: 231 2-persons, 46 3-persons, 37 4-persons, 21 5-persons
Size of nonfamily households: 50 1-person, 88 2-persons
141 married couples with children.
5 single-parent households (2 men, 3 women).
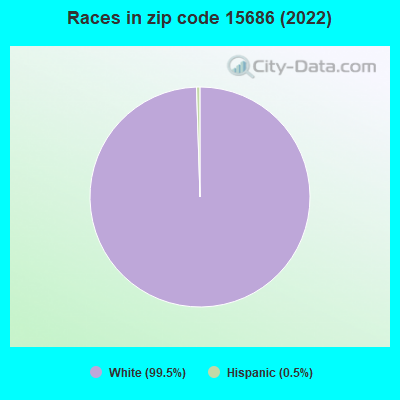
97.7% of residents of 15686 zip code speak English at home.
1.8% of residents speak other Indo-European language at home (100% very well).
0.7% of residents speak Asian or Pacific Island language at home (100% well).
Foreign born population: 0 (0.0%)
:
0.0%
Whole state:
7.5%
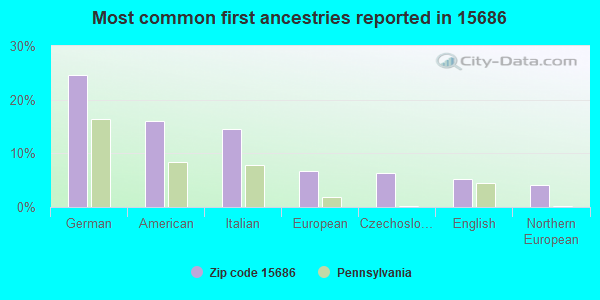
25%German
16%American
14%Italian
7%European
6%Czechoslovakian
5%English
4%Northern European
Facilities with environmental interests located in this zip code:
APOLLO RIDGE ELEM SCH STP (RT 56 E in SPRING CHURCH, PA)
STATE MASTER (Pennsylvania database) - PCS-PA0219045, National Pollutant Discharge Elimination System Permit National Pollutant Discharge Elimination System NON-MAJOR (Tracking pollutant discharge elimination systems) - permit Business SIC classification: SEWERAGE SYSTEMS Organizations: APOLLO-RIDGE SCHOOL DISTRICT (CONTACT/GENERAL)
Alternative names: APOLLO RIDGE ELEM SCHOOL, APOLLO RIDGE SCH DIST, APOLLO RIGDE SCHOOL DISTRICT
APOLLO-RIDGE HIGH SCHOOL (1825 STATE ROUTE 56 in SPRING CHURCH, PA)
(Geographic Names Information System) (National Center for Education Statistics) - STATE ID-2320 Organizations: APOLLO-RIDGE SD (SCHOOL DISTRICT)
Alternative names: APOLLO-RIDGE HS
APOLLO-RIDGE MIDDLE SCHOOL (1829 STATE ROUTE 56 in SPRING CHURCH, PA)
(Geographic Names Information System) (National Center for Education Statistics) - STATE ID-6570 Organizations: APOLLO-RIDGE SD (SCHOOL DISTRICT)
Alternative names: APOLLO-RIDGE MS
Housing units lacking complete plumbing facilities: 3.0% Housing units lacking complete kitchen facilities: 10.4%
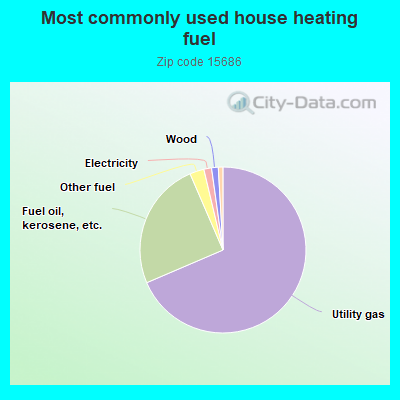
68.7%Utility gas
25.0%Fuel oil, kerosene, etc.
2.8%Other fuel
1.5%Electricity
1.3%Wood
0.9%Bottled, tank, or LP gas
Population in 1990: 1,291. Population change in the 1990s: +31 (+2.4%).
Place of birth for U.S.-born residents:
This state: 877
Northeast: 13
Midwest: 13
South: 109
West: 31
74% of the 15686 zip code residents lived in the same house 5 years ago. Out of people who lived in different houses, 62% lived in this county. Out of people who lived in different counties, 50% lived in Pennsylvania.
100% of the 15686 zip code residents lived in the same house 1 year ago.
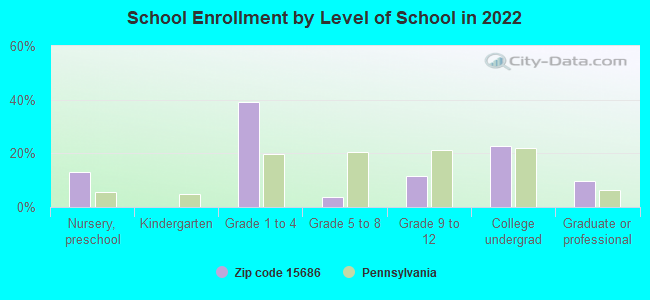
Private vs. public school enrollment:
Students in private schools in grades 1 to 8 (elementary and middle school): 23
Here:
32.9%
Pennsylvania:
15.7%
Students in private schools in grades 9 to 12 (high school): 3
Here:
19.3%
Pennsylvania:
13.4%
Students in private undergraduate colleges:
Here:
0.0%
Pennsylvania:
39.8%
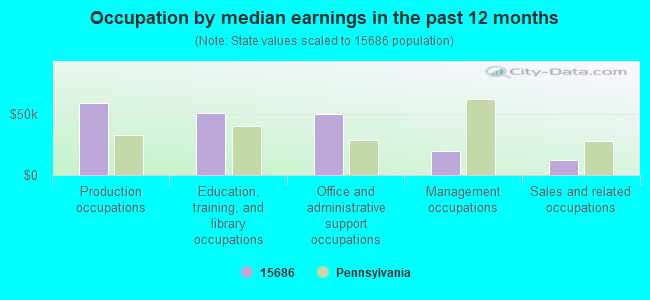
Occupation by median earnings in the past 12 months ($)
59,320Production occupations
51,306Education, training, and library occupations
50,119Office and administrative support occupations
19,473Management occupations
12,477Sales and related occupations
Top industries in this zip code by the number of employees in 2005:
Accommodation and Food Services: Full-Service Restaurants (10-19 employees: 1 establishment)
Construction: New Single-Family Housing Construction (except Operative Builders) (5-9: 1, 1-4: 1)
Mining: Crushed and Broken Limestone Mining and Quarrying (5-9: 1)
Administrative and Support and Waste Management and Remediation Services: Landscaping Services (1-4: 2)
Other Services (except Public Administration): Commercial and Industrial Machinery and Equipment (except Automotive and Electronic) Repair and Maintenance (1-4: 1)
Other Services (except Public Administration): Religious Organizations (1-4: 1)
Fatal accident statistics in 2010:
Fatal accident count: 1
Vehicles involved in fatal accidents: 3
Fatal accidents caused by drunken drivers: 0
Fatalities: 1
Persons involved in fatal accidents: 9
Pedestrians involved in fatal accidents: 0
Home Mortgage Disclosure Act Aggregated Statistics For Year 2009 (Based on 4 partial tracts)
A) FHA, FSA/RHS & VA Home Purchase Loans
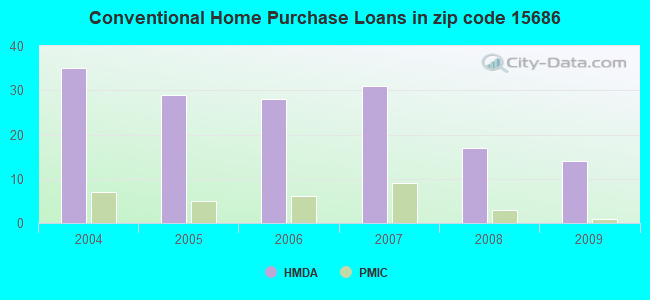
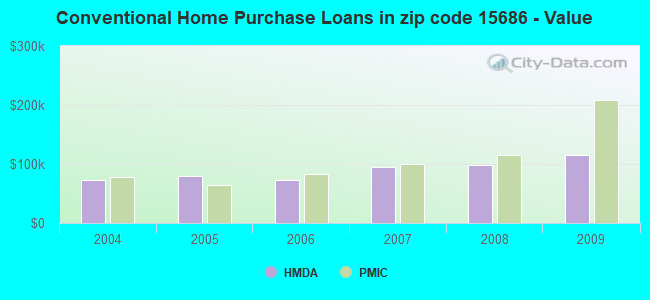
B) Conventional Home Purchase Loans
C) Refinancings
D) Home Improvement Loans
F) Non-occupant Loans on < 5 Family Dwellings (A B C & D)
G) Loans On Manufactured Home Dwelling (A B C & D)
Number
Average Value
Number
Average Value
Number
Average Value
Number
Average Value
Number
Average Value
Number
Average Value
LOANS ORIGINATED
6
$84,717
14
$114,624
49
$100,834
16
$36,048
2
$61,860
11
$57,090
APPLICATIONS APPROVED, NOT ACCEPTED
1
$117,620
1
$18,520
3
$110,943
1
$7,410
0
$0
1
$52,370
APPLICATIONS DENIED
1
$150,650
9
$87,843
24
$110,707
8
$15,470
3
$44,260
6
$50,303
APPLICATIONS WITHDRAWN
0
$0
2
$65,785
15
$132,665
1
$82,000
0
$0
1
$76,000
FILES CLOSED FOR INCOMPLETENESS
0
$0
0
$0
1
$128,020
0
$0
0
$0
0
$0
Aggregated Statistics For Year 2008 (Based on 4 partial tracts)
A) FHA, FSA/RHS & VA Home Purchase Loans
B) Conventional Home Purchase Loans
C) Refinancings
D) Home Improvement Loans
F) Non-occupant Loans on < 5 Family Dwellings (A B C & D)
G) Loans On Manufactured Home Dwelling (A B C & D)
Number
Average Value
Number
Average Value
Number
Average Value
Number
Average Value
Number
Average Value
Number
Average Value
LOANS ORIGINATED
7
$118,867
17
$98,735
30
$112,430
21
$40,623
2
$70,145
5
$60,766
APPLICATIONS APPROVED, NOT ACCEPTED
0
$0
2
$87,215
1
$166,370
2
$38,350
0
$0
0
$0
APPLICATIONS DENIED
1
$71,070
5
$82,166
29
$109,956
17
$45,056
1
$187,030
7
$102,534
APPLICATIONS WITHDRAWN
2
$72,210
2
$36,500
9
$124,919
2
$140,620
1
$6,350
1
$103,160
FILES CLOSED FOR INCOMPLETENESS
0
$0
1
$87,290
1
$195,950
1
$10,580
0
$0
0
$0
Aggregated Statistics For Year 2007 (Based on 4 partial tracts)
A) FHA, FSA/RHS & VA Home Purchase Loans
B) Conventional Home Purchase Loans
C) Refinancings
D) Home Improvement Loans
F) Non-occupant Loans on < 5 Family Dwellings (A B C & D)
G) Loans On Manufactured Home Dwelling (A B C & D)
Number
Average Value
Number
Average Value
Number
Average Value
Number
Average Value
Number
Average Value
Number
Average Value
LOANS ORIGINATED
2
$64,540
31
$95,282
37
$92,372
20
$32,984
3
$73,740
6
$61,878
APPLICATIONS APPROVED, NOT ACCEPTED
0
$0
2
$56,075
4
$108,495
2
$26,450
0
$0
0
$0
APPLICATIONS DENIED
1
$163,460
10
$89,573
40
$98,741
13
$42,377
2
$130,930
7
$64,646
APPLICATIONS WITHDRAWN
0
$0
4
$88,210
11
$87,457
1
$34,200
1
$79,350
2
$82,920
FILES CLOSED FOR INCOMPLETENESS
0
$0
1
$65,600
2
$96,015
0
$0
0
$0
0
$0
Aggregated Statistics For Year 2006 (Based on 4 partial tracts)
A) FHA, FSA/RHS & VA Home Purchase Loans
B) Conventional Home Purchase Loans
C) Refinancings
D) Home Improvement Loans
E) Loans on Dwellings For 5+ Families
F) Non-occupant Loans on < 5 Family Dwellings (A B C & D)
G) Loans On Manufactured Home Dwelling (A B C & D)
Number
Average Value
Number
Average Value
Number
Average Value
Number
Average Value
Number
Average Value
Number
Average Value
Number
Average Value
LOANS ORIGINATED
1
$62,950
28
$72,385
57
$69,010
31
$35,640
1
$3,170
3
$75,730
8
$68,160
APPLICATIONS APPROVED, NOT ACCEPTED
0
$0
2
$112,985
11
$74,487
2
$62,420
0
$0
0
$0
1
$145,410
APPLICATIONS DENIED
0
$0
8
$88,299
47
$79,481
17
$36,892
0
$0
1
$66,630
7
$71,331
APPLICATIONS WITHDRAWN
1
$22,220
4
$88,338
17
$82,165
1
$28,760
0
$0
1
$38,090
1
$54,090
FILES CLOSED FOR INCOMPLETENESS
0
$0
1
$116,870
3
$74,463
0
$0
0
$0
0
$0
0
$0
Aggregated Statistics For Year 2005 (Based on 4 partial tracts)
A) FHA, FSA/RHS & VA Home Purchase Loans
B) Conventional Home Purchase Loans
C) Refinancings
D) Home Improvement Loans
F) Non-occupant Loans on < 5 Family Dwellings (A B C & D)
G) Loans On Manufactured Home Dwelling (A B C & D)
Number
Average Value
Number
Average Value
Number
Average Value
Number
Average Value
Number
Average Value
Number
Average Value
LOANS ORIGINATED
2
$68,025
29
$79,386
54
$72,955
22
$42,583
3
$54,940
8
$56,552
APPLICATIONS APPROVED, NOT ACCEPTED
0
$0
2
$71,995
11
$99,022
1
$20,090
0
$0
2
$54,010
APPLICATIONS DENIED
0
$0
14
$76,182
51
$99,810
17
$19,366
4
$22,350
6
$56,475
APPLICATIONS WITHDRAWN
0
$0
5
$107,244
22
$109,568
7
$97,500
1
$44,400
1
$106,960
FILES CLOSED FOR INCOMPLETENESS
0
$0
1
$106,700
6
$142,947
0
$0
0
$0
0
$0
Aggregated Statistics For Year 2004 (Based on 4 partial tracts)
A) FHA, FSA/RHS & VA Home Purchase Loans
B) Conventional Home Purchase Loans
C) Refinancings
D) Home Improvement Loans
F) Non-occupant Loans on < 5 Family Dwellings (A B C & D)
G) Loans On Manufactured Home Dwelling (A B C & D)

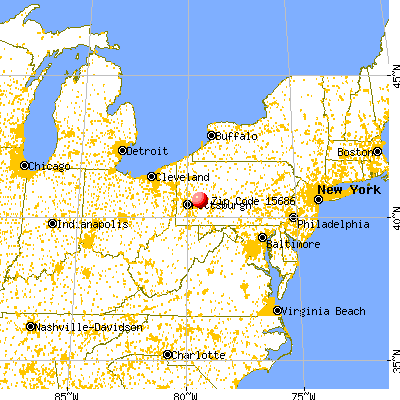


 Nearest zip codes: 15618, 15783, 15736, 16226, 15774, 15690.