Estimated zip code population in 2022: 2,929 Zip code population in 2010: 3,038 Zip code population in 2000: 4,340
Houses and condos: 1,532 Renter-occupied apartments: 560
% of renters here:
40%
State:
31%
March 2022 cost of living index in zip code 15697: 89.1 (less than average, U.S. average is 100)
Land area: 1.8 sq. mi. Water area: 0.0 sq. mi.
Population density: 1,630 people per square mile
(low).
OSM Map
General Map
Google Map
MSN Map
OSM Map
General Map
Google Map
MSN Map
OSM Map
General Map
Google Map
MSN Map
OSM Map
General Map
Google Map
MSN Map
Please wait while loading the map...
Real estate property taxes paid for housing units in 2022:
This zip code:
1.3% ($2,078)
Pennsylvania:
1.3% ($3,094)
Median real estate property taxes paid for housing units with mortgages in 2022: $1,954 (1.2%) Median real estate property taxes paid for housing units with no mortgage in 2022: $2,152 (1.6%)
Business Search- 14 Million verified businesses
Males: 1,295
(44.2%)
Females: 1,633
(55.8%)
For population 25 years and over in 15697:
High school or higher: 96.0%
Bachelor's degree or higher: 23.2%
Graduate or professional degree: 4.4%
Mean travel time to work (commute): 22.2 minutes
For population 15 years and over in 15697:
Never married: 29.7%
Now married: 47.9%
Separated: 1.1%
Widowed: 10.3%
Divorced: 11.1%
Zip code 15697 compared to state average:
Median house value below state average.
Unemployed percentage significantly below state average.
Black race population percentage significantly below state average.
Hispanic race population percentage significantly below state average.
Median age above state average.
Foreign-born population percentage significantly below state average.
Averages for the 2020 tax year for zip code 15697, filed in 2021:
Average Adjusted Gross Income (AGI) in 2020: $46,035 (Individual Income Tax Returns)
Here:
$46,035
State:
$75,707
Salary/wage: $42,382 (reported on 84.4% of returns)
Here:
$42,382
State:
$62,806
(% of AGI for various income ranges: 1064.5% for AGIs below $25k, 3390.7% for AGIs $25k-50k, 6191.9% for AGIs $50k-75k, 8630.0% for AGIs $75k-100k, 17695.0% for AGIs $100k-200k)
Taxable interest for individuals: $522 (reported on 23.1% of returns)
This zip code:
$522
Pennsylvania:
$1,633
(% of AGI for various income ranges: 10.8% for AGIs below $25k, 18.6% for AGIs $25k-50k, 10.5% for AGIs $50k-75k, 14.6% for AGIs $75k-100k, 36.2% for AGIs $100k-200k)
Ordinary dividends: $1,561 (reported on 14.4% of returns)
Here:
$1,561
State:
$7,382
(% of AGI for various income ranges: 12.0% for AGIs below $25k, 19.8% for AGIs $25k-50k, 29.5% for AGIs $50k-75k, 26.2% for AGIs $75k-100k, 162.5% for AGIs $100k-200k)
Net capital gain/loss in AGI: +$2,567 (reported on 11.2% of returns)
Here:
+$2,567
State:
+$23,522
(% of AGI for various income ranges: 6.8% for AGIs below $25k, 12.3% for AGIs $25k-50k, 44.8% for AGIs $50k-75k, 129.2% for AGIs $75k-100k, 150.0% for AGIs $100k-200k)
Profit/loss from business: +$5,213 (reported on 9.4% of returns)
Here:
+$5,213
State:
+$16,274
(% of AGI for various income ranges: 30.2% for AGIs below $25k, 74.4% for AGIs $25k-50k, 76.7% for AGIs $50k-75k, 138.5% for AGIs $75k-100k)
Taxable individual retirement arrangement distribution: $11,088 (reported on 10.0% of returns)
15697:
$11,088
Pennsylvania:
$18,583
(% of AGI for various income ranges: 91.5% for AGIs below $25k, 97.7% for AGIs $25k-50k, 122.9% for AGIs $50k-75k, 232.3% for AGIs $75k-100k, 535.0% for AGIs $100k-200k)
Earned income credit: $1,926 (reported on 14.4% of returns)
Here:
$1,926
State:
$2,100
(% of AGI for various income ranges: 66.2% for AGIs below $25k, 41.4% for AGIs $25k-50k)
Percentage of individuals using paid preparers for their 2020 taxes: 93.8%
Here:
94%
State:
92%
(% for various income ranges: 92.5% for AGIs below $25k, 94.2% for AGIs $25k-50k, 96.2% for AGIs $50k-75k, 93.8% for AGIs $75k-100k, 92.3% for AGIs $100k-200k)
Averages for the 2012 tax year for zip code 15697, filed in 2013:
Average Adjusted Gross Income (AGI) in 2012: $38,645 (Individual Income Tax Returns)
Here:
$38,645
State:
$61,346
Salary/wage: $36,269 (reported on 85.4% of returns)
Here:
$36,269
State:
$51,902
(% of AGI for various income ranges: 73.1% for AGIs below $25k, 82.5% for AGIs $25k-50k, 84.5% for AGIs $50k-75k, 87.0% for AGIs $75k-100k, 68.1% for AGIs $100k-200k)
Taxable interest for individuals: $614 (reported on 26.8% of returns)
This zip code:
$614
Pennsylvania:
$1,588
(% of AGI for various income ranges: 1.2% for AGIs below $25k, 0.5% for AGIs $25k-50k, 0.4% for AGIs $50k-75k, 0.1% for AGIs $75k-100k, 0.2% for AGIs $100k-200k)
Ordinary dividends: $1,339 (reported on 17.1% of returns)
Here:
$1,339
State:
$5,827
(% of AGI for various income ranges: 1.5% for AGIs below $25k, 0.4% for AGIs $25k-50k, 0.5% for AGIs $50k-75k, 0.1% for AGIs $75k-100k, 0.6% for AGIs $100k-200k)
Profit/loss from business: +$7,121 (reported on 8.5% of returns)
Here:
+$7,121
State:
+$16,268
(% of AGI for various income ranges: 3.4% for AGIs below $25k, 1.0% for AGIs $25k-50k, 1.5% for AGIs $50k-75k, 2.6% for AGIs $75k-100k)
Taxable individual retirement arrangement distribution: $9,447 (reported on 10.4% of returns)
15697:
$9,447
Pennsylvania:
$14,550
(% of AGI for various income ranges: 4.1% for AGIs below $25k, 3.4% for AGIs $25k-50k, 2.1% for AGIs $50k-75k, 3.1% for AGIs $75k-100k)
Total itemized deductions: $16,264 (21% of AGI, reported on 13.4% of returns)
Here:
$16,264
State:
$23,538
Here:
21.2% of AGI
State:
18.4% of AGI
(% of AGI for various income ranges: 5.6% for AGIs below $25k, 3.9% for AGIs $25k-50k, 4.8% for AGIs $50k-75k, 7.6% for AGIs $75k-100k, 7.7% for AGIs $100k-200k)
Charity contributions: $2,475 (reported on 9.8% of returns)
Here:
$2,475
State:
$4,025
(% of AGI for various income ranges: 0.7% for AGIs $25k-50k, 0.5% for AGIs $50k-75k, 0.9% for AGIs $75k-100k, 0.8% for AGIs $100k-200k)
Taxes paid: $4,895 (reported on 13.4% of returns)
15697:
$4,895
State:
$9,982
(% of AGI for various income ranges: 0.7% for AGIs below $25k, 1.0% for AGIs $25k-50k, 1.3% for AGIs $50k-75k, 2.5% for AGIs $75k-100k, 3.4% for AGIs $100k-200k)
Earned income credit: $1,656 (reported on 15.2% of returns)
Here:
$1,656
State:
$2,106
(% of AGI for various income ranges: 3.3% for AGIs below $25k, 0.7% for AGIs $25k-50k)
Percentage of individuals using paid preparers for their 2012 taxes: 44.5%
Here:
45%
State:
53%
(% for various income ranges: 39.4% for AGIs below $25k, 42.6% for AGIs $25k-50k, 50.0% for AGIs $50k-75k, 53.8% for AGIs $75k-100k, 71.4% for AGIs $100k-200k)
Averages for the 2004 tax year for zip code 15697, filed in 2005:
Average Adjusted Gross Income (AGI) in 2004: $31,648 (Individual Income Tax Returns)
Here:
$31,648
State:
$48,049
Salary/wage: $30,877 (reported on 84.1% of returns)
Here:
$30,877
State:
$42,646
(% of AGI for various income ranges: 73.3% for AGIs below $10k, 76.2% for AGIs $10k-25k, 82.9% for AGIs $25k-50k, 87.1% for AGIs $50k-75k, 90.0% for AGIs $75k-100k, 68.7% for AGIs over 100k)
Taxable interest for individuals: $1,161 (reported on 38.5% of returns)
This zip code:
$1,161
Pennsylvania:
$1,657
(% of AGI for various income ranges: 4.0% for AGIs below $10k, 2.0% for AGIs $10k-25k, 1.4% for AGIs $25k-50k, 1.0% for AGIs $50k-75k, 0.4% for AGIs $75k-100k, 2.1% for AGIs over 100k)
Taxable dividends: $1,132 (reported on 19.4% of returns)
Here:
$1,132
State:
$3,566
(% of AGI for various income ranges: 2.3% for AGIs below $10k, 1.5% for AGIs $10k-25k, 0.4% for AGIs $25k-50k, 0.4% for AGIs $50k-75k, 0.5% for AGIs $75k-100k, 0.9% for AGIs over 100k)
Net capital gain/loss: +$913 (reported on 11.2% of returns)
Here:
+$913
State:
+$9,716
(% of AGI for various income ranges: 1.4% for AGIs below $10k, 0.0% for AGIs $10k-25k, -0.0% for AGIs $25k-50k, 0.7% for AGIs $50k-75k, -0.1% for AGIs $75k-100k, 1.0% for AGIs over 100k)
Profit/loss from business: +$5,416 (reported on 10.6% of returns)
Here:
+$5,416
State:
+$14,267
(% of AGI for various income ranges: 5.0% for AGIs below $10k, 3.0% for AGIs $10k-25k, 2.2% for AGIs $25k-50k, 1.4% for AGIs $50k-75k, 0.7% for AGIs $75k-100k)
IRA payment deduction: $2,400 (reported on 2.8% of returns)
15697:
$2,400
Pennsylvania:
$2,903
Total itemized deductions: $12,551 (21% of AGI, reported on 16.2% of returns)
Here:
$12,551
State:
$18,804
Here:
21.3% of AGI
State:
19.5% of AGI
(% of AGI for various income ranges: 5.3% for AGIs below $10k, 3.5% for AGIs $10k-25k, 5.6% for AGIs $25k-50k, 7.2% for AGIs $50k-75k, 8.9% for AGIs $75k-100k, 8.8% for AGIs over 100k)
Charity contributions deductions: $1,892 (3% of AGI, reported on 14.2% of returns)
Here:
$1,892
State:
$3,337
Here:
3.2% of AGI
State:
3.3% of AGI
(% of AGI for various income ranges: 0.6% for AGIs $10k-25k, 0.7% for AGIs $25k-50k, 0.9% for AGIs $50k-75k, 1.1% for AGIs $75k-100k, 1.5% for AGIs over 100k)
Total tax: $3,632 (reported on 74.6% of returns)
15697:
$3,632
State:
$8,008
(% of AGI for various income ranges: 1.7% for AGIs below $10k, 4.6% for AGIs $10k-25k, 7.6% for AGIs $25k-50k, 8.8% for AGIs $50k-75k, 10.9% for AGIs $75k-100k, 16.6% for AGIs over 100k)
Earned income credit: $1,391 (reported on 15.2% of returns)
Here:
$1,391
State:
$1,643
Percentage of individuals using paid preparers for their 2004 taxes: 48.5%
Here:
49%
State:
56%
(% for various income ranges: 42.9% for AGIs below $10k, 48.8% for AGIs $10k-25k, 49.1% for AGIs $25k-50k, 51.9% for AGIs $50k-75k, 51.3% for AGIs $75k-100k, 69.2% for AGIs over 100k)
Household received Food Stamps/SNAP in the past 12 months: 203 Household did not receive Food Stamps/SNAP in the past 12 months: 1,189
Women who had a birth in the past 12 months: 42 (18 now married, 21 unmarried) Women who did not have a birth in the past 12 months: 621 (293 now married, 326 unmarried)
Housing units in zip code 15697 with a mortgage: 448 (46 second mortgage, 46 both second mortgage and home equity loan) Houses without a mortgage: 9
Median monthly owner costs for units with a mortgage: $1,219 Median monthly owner costs for units without a mortgage: $512
Residents with income below the poverty level in 2022:
This zip code:
4.2%
Whole state:
11.8%
Residents with income below 50% of the poverty level in 2022:
This zip code:
1.0%
Whole state:
6.1%
Median number of rooms in houses and condos:
Here:
6.5
State:
6.8
Median number of rooms in apartments:
Here:
4.3
State:
4.3
Notable locations in this zip code not listed on our city pages
In group quarters: 45 (-1 institutionalized population)
Size of family households: 436 2-persons, 179 3-persons, 100 4-persons, 73 5-persons
Size of nonfamily households: 501 1-person, 97 2-persons, 11 5-persons
313 married couples with children.
116 single-parent households (60 men, 56 women).
99.3% of residents of 15697 zip code speak English at home.
Foreign born population: 3 (0.1%) (100.0% of them are naturalized citizens)
This zip code:
0.1%
Whole state:
7.5%
100%England
67%Sweden
33%German
13%Italian
10%European
8%American
4%Irish
4%English
3%Pennsylvania German
Year of entry for the foreign-born population
02010 or later
02000 to 2009
01990 to 1999
2Before 1990
Facilities with environmental interests located in this zip code:
BELL ATLANTIC YOUNGWOOD FAC (3 DEPOT ST in YOUNGWOOD, PA)
STATE MASTER (Pennsylvania database) - RCRIS-PAD987342839, HAZARDOUS WASTE PROGRAM HAZARDOUS WASTE BIENNIAL REPORTER (Resource Conservation and Recovery Act (tracking hazardous waste)) (Resource Conservation and Recovery Act (tracking hazardous waste)) Organizations: OPERNAME (CONTACT/OPERATOR)
Alternative names: BELL ATLANTIC OF PA YOUNGWOOD MRC, BELL ATLANTIC PENNSYLVANIA YOUNGWOOD MRC
ALL METAL FABRICATING CO INC (N 7TH ST EXT in YOUNGWOOD, PA)
(Resource Conservation and Recovery Act (tracking hazardous waste)) Business NAICS classification: PLATE WORK MANUFACTURING.; ORNAMENTAL AND ARCHITECTURAL METAL WORK MANUFACTURING. Organizations: OPERNAME (CONTACT/OPERATOR)
, OWNERNAME (CONTACT/OWNER)
ALBERT AUTOMOBILE (318 N FOURTH ST in YOUNGWOOD, PA)
(Resource Conservation and Recovery Act (tracking hazardous waste)) Organizations: THOMAS ALBERT (CONTACT/OWNER)
BANDOS GEORGE SERVICE (RT 119 & N 3RD ST in YOUNGWOOD, PA)
Conditionally Exempt Small Quantity Generators, less than 100 kg/month of hazardous waste (Resource Conservation and Recovery Act (tracking hazardous waste)) - notification Organizations: GEORGE BANDO (CONTACT/OWNER)
Alternative names: GEORGE BANDOS SVC
Housing units lacking complete plumbing facilities: 1.9% Housing units lacking complete kitchen facilities: 4.8%
63.6%Utility gas
30.7%Electricity
5.8%Fuel oil, kerosene, etc.
Population in 1990: 3,319. Population change in the 1990s: +1,021 (+30.8%).
Place of birth for U.S.-born residents:
This state: 2,483
Northeast: 82
Midwest: 66
South: 166
West: 113
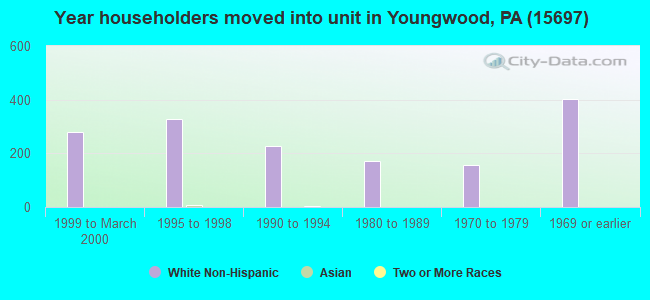
54% of the 15697 zip code residents lived in the same house 5 years ago. Out of people who lived in different houses, 38% lived in this county. Out of people who lived in different counties, 50% lived in Pennsylvania.
95% of the 15697 zip code residents lived in the same house 1 year ago. Out of people who lived in different houses, 42% moved from this county. Out of people who lived in different houses, 26% moved from different county within same state. Out of people who lived in different houses, 36% moved from different state.
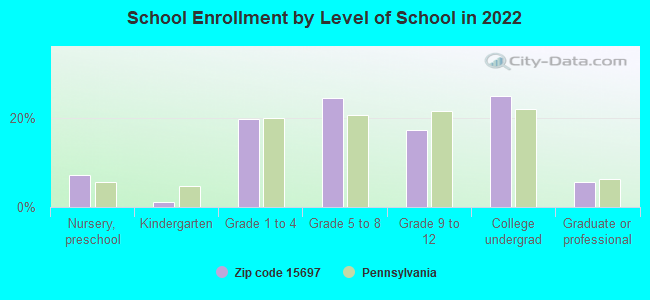
Private vs. public school enrollment:
Students in private schools in grades 1 to 8 (elementary and middle school):
Here:
0.0%
Pennsylvania:
15.7%
Students in private schools in grades 9 to 12 (high school):
Here:
0.0%
Pennsylvania:
13.4%
Students in private undergraduate colleges: 68
Here:
37.7%
Pennsylvania:
39.8%
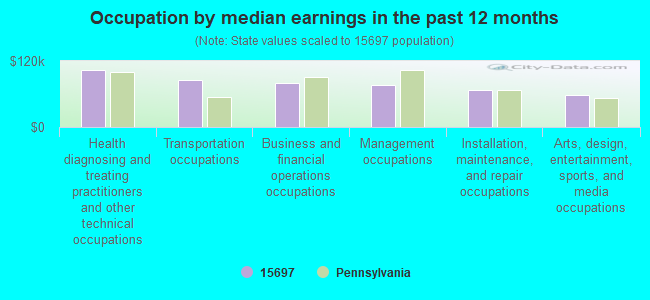
Occupation by median earnings in the past 12 months ($)
103,341Health diagnosing and treating practitioners and other technical occupations
85,663Transportation occupations
79,230Business and financial operations occupations
76,572Management occupations
66,882Installation, maintenance, and repair occupations
58,002Arts, design, entertainment, sports, and media occupations
Companies with federal contracts located in this zip code:
POWEREX, INC (200 E HILLIS ST in YOUNGWOOD, PA; small business) : $303,605 in 7 contractsfrom 1999 to 2005
Contracts for Semiconductor Devices and Associated Hardware, Converters, Electrical, Nonrotating by Army, Defense Logistics Agency Signed by year:2000: $56,700; 2001: $0; 2002: $36,250; 2003: $0; 2004: $80,000; 2005: $19,138; 2006: $0.
Biggest contracts:
$80,000 with Army for Semiconductor Devices and Associated Hardware. Signed on 2004-07-02. Completion date: 2004-12-01.
$79,980 with Defense Logistics Agency for Semiconductor Devices and Associated Hardware. Signed on 1999-11-05. Completion date: 2000-05-03.
$56,700 with Defense Logistics Agency for Converters, Electrical, Nonrotating. Signed on 2000-05-10. Completion date: 2000-10-11.
$36,250, same as above.Signed on 2002-05-08. Completion date: 2002-12-12.
DEBORAH J KRALL (25 SOUTH FIFTH STREET in YOUNGWOOD, PA; small business) : $80,000 in 2 contractsfrom 2002 to 2003
$40,000 with Army for Personal Care Services (includes such services as barber and beauty shop, shoe repairs, tailoring, etc.). Signed on 2003-07-02. Completion date: 2004-03-31.
$40,000, same as above.Signed on 2002-03-19. Completion date: 2004-03-31.
Top industries in this zip code by the number of employees in 2005:
Administrative and Support and Waste Management and Remediation Services: Security Guards and Patrol Services (100-249 employees: 1 establishment)
Wholesale Trade: Other Grocery and Related Products Merchant Wholesalers (50-99: 1, 1-4: 1)
Wholesale Trade: Industrial Machinery and Equipment Merchant Wholesalers (50-99: 1)
Administrative and Support and Waste Management and Remediation Services: Temporary Help Services (50-99: 1)
Other Services (except Public Administration): Commercial and Industrial Machinery and Equipment (except Automotive and Electronic) Repair and Maintenance (20-49: 1, 5-9: 1)
People in group quarters in 2010:
38 people in nursing facilities/skilled-nursing facilities
14 people in group homes intended for adults
People in group quarters in 2000:
834 people in state prisons
73 people in other noninstitutional group quarters
3 people in homes for the mentally retarded
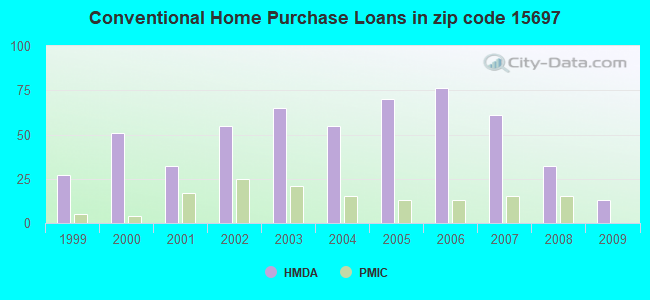
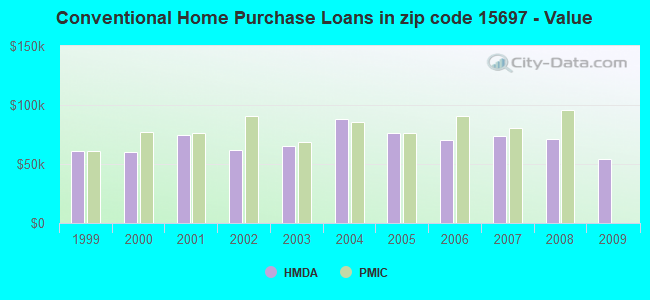
Home Mortgage Disclosure Act Aggregated Statistics For Year 2009 (Based on 2 partial tracts)
A) FHA, FSA/RHS & VA Home Purchase Loans
B) Conventional Home Purchase Loans
C) Refinancings
D) Home Improvement Loans
F) Non-occupant Loans on < 5 Family Dwellings (A B C & D)
G) Loans On Manufactured Home Dwelling (A B C & D)
Number
Average Value
Number
Average Value
Number
Average Value
Number
Average Value
Number
Average Value
Number
Average Value
LOANS ORIGINATED
25
$98,044
13
$54,622
40
$86,054
8
$28,479
6
$54,743
0
$0
APPLICATIONS APPROVED, NOT ACCEPTED
0
$0
0
$0
8
$93,981
2
$5,695
0
$0
0
$0
APPLICATIONS DENIED
0
$0
2
$9,495
63
$90,651
19
$17,687
2
$64,550
4
$92,558
APPLICATIONS WITHDRAWN
2
$57,905
2
$33,225
15
$99,613
2
$14,240
0
$0
0
$0
FILES CLOSED FOR INCOMPLETENESS
0
$0
0
$0
4
$85,438
2
$14,240
0
$0
0
$0
Aggregated Statistics For Year 2008 (Based on 2 partial tracts)
A) FHA, FSA/RHS & VA Home Purchase Loans
B) Conventional Home Purchase Loans
C) Refinancings
D) Home Improvement Loans
E) Loans on Dwellings For 5+ Families
F) Non-occupant Loans on < 5 Family Dwellings (A B C & D)
G) Loans On Manufactured Home Dwelling (A B C & D)
Number
Average Value
Number
Average Value
Number
Average Value
Number
Average Value
Number
Average Value
Number
Average Value
Number
Average Value
LOANS ORIGINATED
38
$97,878
32
$70,782
36
$100,098
17
$19,433
2
$189,860
8
$52,924
2
$67,400
APPLICATIONS APPROVED, NOT ACCEPTED
0
$0
0
$0
11
$83,365
4
$35,125
0
$0
2
$51,260
0
$0
APPLICATIONS DENIED
6
$92,398
4
$97,302
53
$88,840
23
$29,387
0
$0
4
$41,295
2
$5,695
APPLICATIONS WITHDRAWN
2
$60,755
0
$0
11
$89,752
4
$30,852
0
$0
2
$65,500
0
$0
FILES CLOSED FOR INCOMPLETENESS
0
$0
2
$67,400
2
$18,985
0
$0
0
$0
0
$0
0
$0
Aggregated Statistics For Year 2007 (Based on 2 partial tracts)
A) FHA, FSA/RHS & VA Home Purchase Loans
B) Conventional Home Purchase Loans
C) Refinancings
D) Home Improvement Loans
E) Loans on Dwellings For 5+ Families
F) Non-occupant Loans on < 5 Family Dwellings (A B C & D)
G) Loans On Manufactured Home Dwelling (A B C & D)
Number
Average Value
Number
Average Value
Number
Average Value
Number
Average Value
Number
Average Value
Number
Average Value
Number
Average Value
LOANS ORIGINATED
11
$100,281
61
$73,361
82
$67,840
15
$18,859
0
$0
13
$45,128
2
$94,930
APPLICATIONS APPROVED, NOT ACCEPTED
0
$0
11
$52,298
17
$122,181
6
$55,377
2
$117,715
2
$113,915
0
$0
APPLICATIONS DENIED
0
$0
13
$61,924
82
$90,021
28
$42,176
0
$0
4
$261,058
4
$66,450
APPLICATIONS WITHDRAWN
0
$0
4
$53,160
25
$87,032
4
$37,022
0
$0
2
$47,465
0
$0
FILES CLOSED FOR INCOMPLETENESS
0
$0
0
$0
4
$74,045
0
$0
0
$0
0
$0
0
$0
Aggregated Statistics For Year 2006 (Based on 2 partial tracts)
A) FHA, FSA/RHS & VA Home Purchase Loans
B) Conventional Home Purchase Loans
C) Refinancings
D) Home Improvement Loans
E) Loans on Dwellings For 5+ Families
F) Non-occupant Loans on < 5 Family Dwellings (A B C & D)
G) Loans On Manufactured Home Dwelling (A B C & D)
Number
Average Value
Number
Average Value
Number
Average Value
Number
Average Value
Number
Average Value
Number
Average Value
Number
Average Value
LOANS ORIGINATED
15
$100,246
76
$70,223
93
$87,091
28
$20,071
4
$87,810
19
$64,253
4
$43,668
APPLICATIONS APPROVED, NOT ACCEPTED
0
$0
8
$49,364
25
$57,718
2
$9,495
0
$0
4
$58,858
0
$0
APPLICATIONS DENIED
0
$0
13
$80,618
87
$91,897
21
$68,621
0
$0
8
$96,829
0
$0
APPLICATIONS WITHDRAWN
2
$78,790
11
$78,878
66
$96,541
2
$23,735
0
$0
2
$100,625
0
$0
FILES CLOSED FOR INCOMPLETENESS
0
$0
0
$0
21
$80,103
0
$0
0
$0
8
$83,776
0
$0
Aggregated Statistics For Year 2005 (Based on 2 partial tracts)
A) FHA, FSA/RHS & VA Home Purchase Loans
B) Conventional Home Purchase Loans
C) Refinancings
D) Home Improvement Loans
E) Loans on Dwellings For 5+ Families
F) Non-occupant Loans on < 5 Family Dwellings (A B C & D)
G) Loans On Manufactured Home Dwelling (A B C & D)
Number
Average Value
Number
Average Value
Number
Average Value
Number
Average Value
Number
Average Value
Number
Average Value
Number
Average Value
LOANS ORIGINATED
9
$86,281
70
$76,297
99
$72,262
40
$41,105
0
$0
15
$73,286
8
$49,601
APPLICATIONS APPROVED, NOT ACCEPTED
0
$0
13
$66,889
27
$73,201
4
$36,548
0
$0
0
$0
4
$31,328
APPLICATIONS DENIED
0
$0
9
$57,591
112
$99,253
38
$19,885
2
$265,805
21
$56,777
6
$32,277
APPLICATIONS WITHDRAWN
2
$117,715
8
$115,102
70
$87,878
6
$68,667
2
$379,720
8
$119,611
0
$0
FILES CLOSED FOR INCOMPLETENESS
0
$0
4
$61,705
21
$93,303
0
$0
0
$0
9
$78,264
0
$0
Aggregated Statistics For Year 2004 (Based on 2 partial tracts)
A) FHA, FSA/RHS & VA Home Purchase Loans
B) Conventional Home Purchase Loans
C) Refinancings
D) Home Improvement Loans
F) Non-occupant Loans on < 5 Family Dwellings (A B C & D)
G) Loans On Manufactured Home Dwelling (A B C & D)
Number
Average Value
Number
Average Value
Number
Average Value
Number
Average Value
Number
Average Value
Number
Average Value
LOANS ORIGINATED
2
$58,855
55
$88,199
133
$74,202
51
$34,473
19
$87,935
4
$32,750
APPLICATIONS APPROVED, NOT ACCEPTED
0
$0
8
$152,125
25
$81,640
6
$90,817
0
$0
0
$0
APPLICATIONS DENIED
0
$0
9
$67,083
84
$83,674
42
$21,291
11
$111,155
0
$0
APPLICATIONS WITHDRAWN
0
$0
11
$110,292
78
$90,111
4
$26,105
4
$59,805
0
$0
FILES CLOSED FOR INCOMPLETENESS
0
$0
0
$0
9
$107,798
0
$0
2
$122,460
0
$0
Aggregated Statistics For Year 2003 (Based on 2 partial tracts)
A) FHA, FSA/RHS & VA Home Purchase Loans
B) Conventional Home Purchase Loans
C) Refinancings
D) Home Improvement Loans
E) Loans on Dwellings For 5+ Families
F) Non-occupant Loans on < 5 Family Dwellings (A B C & D)
Number
Average Value
Number
Average Value
Number
Average Value
Number
Average Value
Number
Average Value
Number
Average Value
LOANS ORIGINATED
17
$89,569
65
$65,078
222
$72,019
44
$18,209
2
$66,450
23
$70,743
APPLICATIONS APPROVED, NOT ACCEPTED
0
$0
6
$90,500
42
$68,847
11
$9,665
0
$0
4
$88,760
APPLICATIONS DENIED
2
$84,490
13
$55,205
95
$79,961
28
$13,832
0
$0
8
$74,995
APPLICATIONS WITHDRAWN
4
$75,470
9
$91,766
47
$87,457
2
$18,985
0
$0
8
$66,926
FILES CLOSED FOR INCOMPLETENESS
0
$0
6
$56,958
8
$115,340
2
$56,960
0
$0
2
$101,575
Aggregated Statistics For Year 2002 (Based on 2 partial tracts)
A) FHA, FSA/RHS & VA Home Purchase Loans
B) Conventional Home Purchase Loans
C) Refinancings
D) Home Improvement Loans
F) Non-occupant Loans on < 5 Family Dwellings (A B C & D)
Number
Average Value
Number
Average Value
Number
Average Value
Number
Average Value
Number
Average Value
LOANS ORIGINATED
23
$85,850
55
$61,825
158
$65,213
38
$17,637
21
$57,139
APPLICATIONS APPROVED, NOT ACCEPTED
4
$71,672
4
$57,432
53
$66,415
9
$31,643
2
$63,605
APPLICATIONS DENIED
4
$54,110
21
$54,427
87
$69,768
25
$15,492
0
$0
APPLICATIONS WITHDRAWN
0
$0
0
$0
57
$76,544
6
$23,417
2
$82,590
FILES CLOSED FOR INCOMPLETENESS
0
$0
2
$10,440
2
$73,095
0
$0
0
$0
Aggregated Statistics For Year 2001 (Based on 2 partial tracts)
A) FHA, FSA/RHS & VA Home Purchase Loans
B) Conventional Home Purchase Loans
C) Refinancings
D) Home Improvement Loans
F) Non-occupant Loans on < 5 Family Dwellings (A B C & D)
Number
Average Value
Number
Average Value
Number
Average Value
Number
Average Value
Number
Average Value
LOANS ORIGINATED
25
$77,007
32
$74,995
137
$58,358
51
$19,395
6
$59,490
APPLICATIONS APPROVED, NOT ACCEPTED
0
$0
6
$64,552
42
$64,326
9
$36,707
0
$0
APPLICATIONS DENIED
0
$0
11
$51,607
68
$68,685
27
$12,165
2
$51,260
APPLICATIONS WITHDRAWN
0
$0
4
$69,772
47
$68,188
4
$33,225
0
$0
FILES CLOSED FOR INCOMPLETENESS
0
$0
0
$0
9
$121,510
2
$18,985
0
$0
Aggregated Statistics For Year 2000 (Based on 2 partial tracts)
A) FHA, FSA/RHS & VA Home Purchase Loans
B) Conventional Home Purchase Loans
C) Refinancings
D) Home Improvement Loans
F) Non-occupant Loans on < 5 Family Dwellings (A B C & D)
Number
Average Value
Number
Average Value
Number
Average Value
Number
Average Value
Number
Average Value
LOANS ORIGINATED
13
$64,115
51
$60,085
68
$51,123
38
$14,789
6
$42,085
APPLICATIONS APPROVED, NOT ACCEPTED
2
$125,310
8
$26,818
25
$47,693
4
$31,802
2
$43,670
APPLICATIONS DENIED
6
$78,475
13
$47,465
44
$55,750
34
$26,189
0
$0
APPLICATIONS WITHDRAWN
2
$51,260
8
$94,455
32
$60,637
4
$15,190
0
$0
FILES CLOSED FOR INCOMPLETENESS
0
$0
0
$0
8
$60,280
0
$0
0
$0
Aggregated Statistics For Year 1999 (Based on 1 partial tract)
A) FHA, FSA/RHS & VA Home Purchase Loans
B) Conventional Home Purchase Loans
C) Refinancings
D) Home Improvement Loans
E) Loans on Dwellings For 5+ Families
F) Non-occupant Loans on < 5 Family Dwellings (A B C & D)
Detailed PMIC statistics for the following Tracts:8046.00
2004 - 2018 National Fire Incident Reporting System (NFIRS) incidents
According to the data from the years 2004 - 2018 the average number of fires per year is 16. The highest number of fire incidents - 33 took place in 2008, and the least - 2 in 2018. The data has a dropping trend.
When looking into fire subcategories, the most reports belonged to: Structure Fires (42.1%), and Other (24.4%).
Fire incident types reported to NFIRS in Zip Code 15697

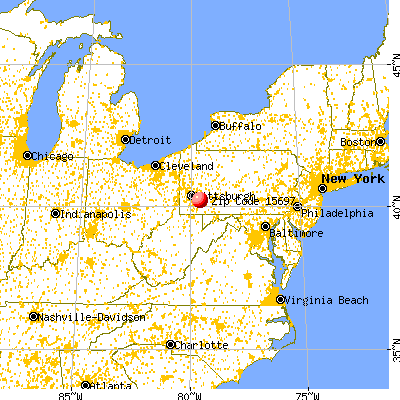


 Nearest zip codes: 15616, 15639, 15672, 15688, 15617, 15634.


 According to the data from the years 2004 - 2018 the average number of fires per year is 16. The highest number of fire incidents - 33 took place in 2008, and the least - 2 in 2018. The data has a dropping trend.
 When looking into fire subcategories, the most reports belonged to: Structure Fires (42.1%), and Other (24.4%).