Estimated zip code population in 2022: 2,259 Zip code population in 2010: 2,412 Zip code population in 2000: 2,843
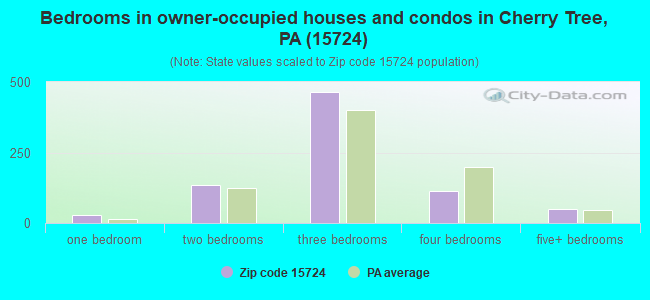
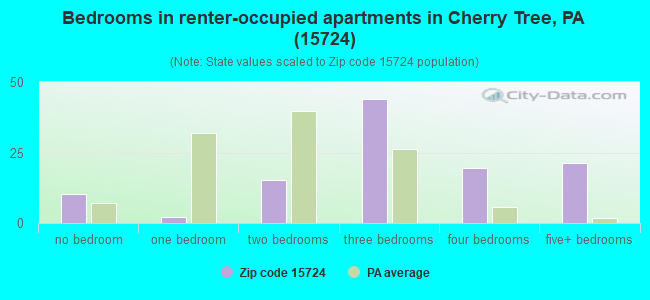
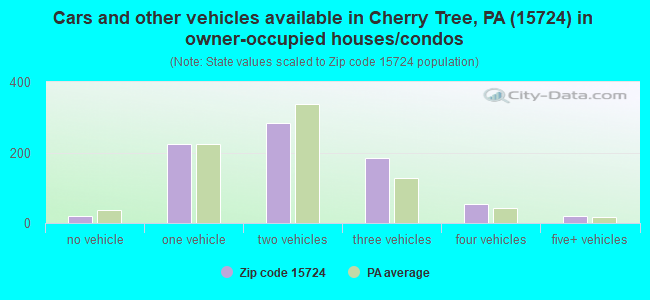
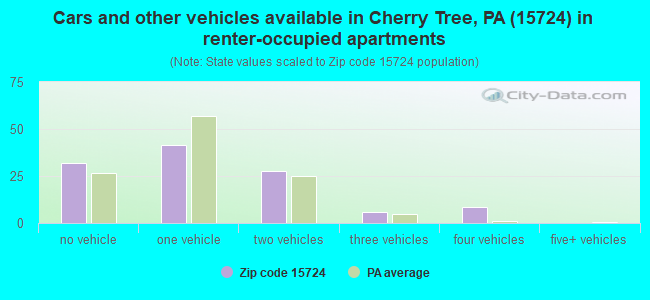
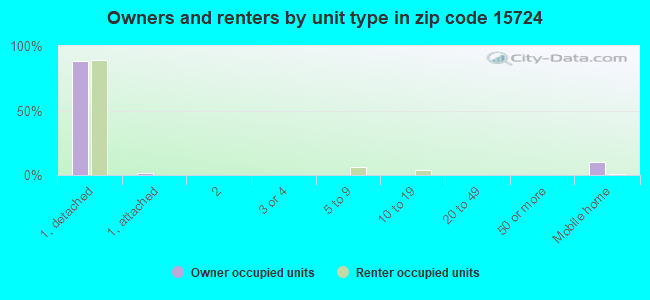
Houses and condos: 1,027 Renter-occupied apartments: 115
% of renters here:
13%
State:
31%
March 2022 cost of living index in zip code 15724: 90.2 (less than average, U.S. average is 100)
Land area: 47.2 sq. mi. Water area: 0.2 sq. mi.
Population density: 48 people per square mile
(very low).
OSM Map
General Map
Google Map
MSN Map
OSM Map
General Map
Google Map
MSN Map
OSM Map
General Map
Google Map
MSN Map
OSM Map
General Map
Google Map
MSN Map
Please wait while loading the map...
Real estate property taxes paid for housing units in 2022:
This zip code:
1.2% ($1,405)
Pennsylvania:
1.3% ($3,094)
Median real estate property taxes paid for housing units with mortgages in 2022: $1,497 (1.3%) Median real estate property taxes paid for housing units with no mortgage in 2022: $1,306 (1.1%)
Business Search- 14 Million verified businesses
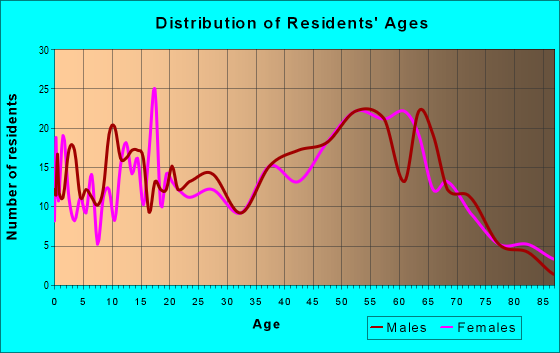
Males: 1,174
(52.0%)
Females: 1,083
(48.0%)
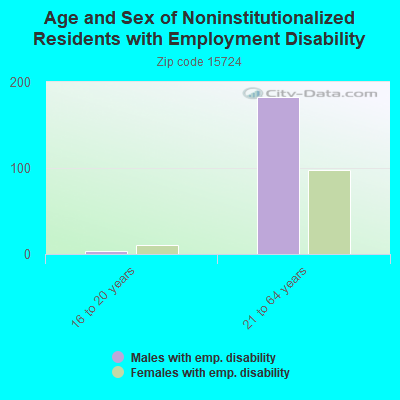
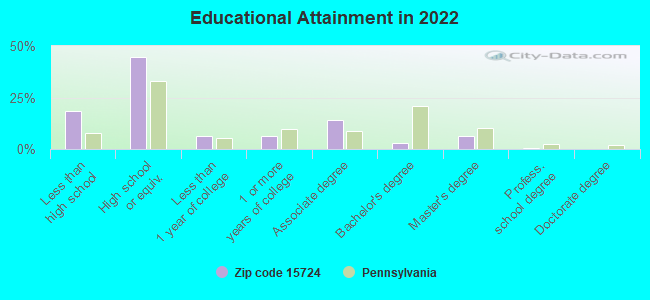
For population 25 years and over in 15724:
High school or higher: 79.5%
Bachelor's degree or higher: 9.7%
Graduate or professional degree: 6.6%
Unemployed: 6.5%
Mean travel time to work (commute): 33.3 minutes
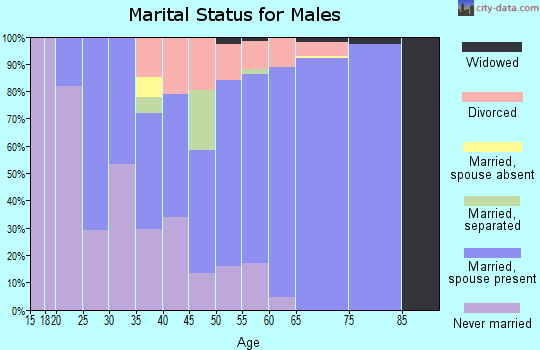
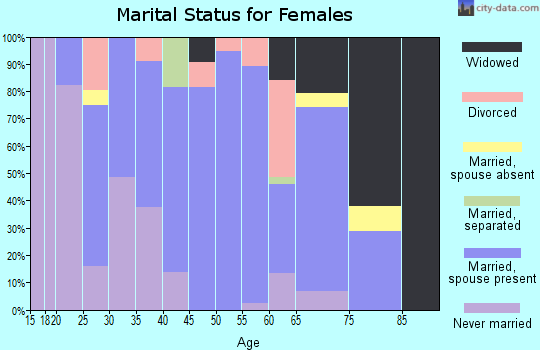
For population 15 years and over in 15724:
Never married: 31.4%
Now married: 49.0%
Separated: 2.2%
Widowed: 10.9%
Divorced: 6.6%
Zip code 15724 compared to state average:
Median house value below state average.
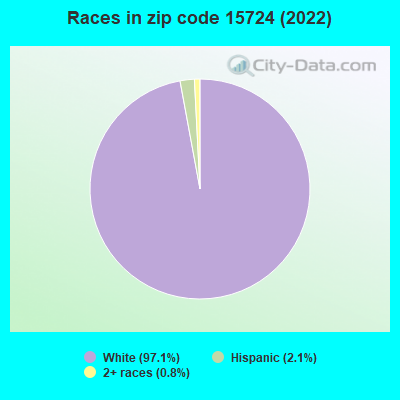
Black race population percentage significantly below state average.
Hispanic race population percentage significantly below state average.
Median age significantly above state average.
Foreign-born population percentage significantly below state average.
Renting percentage significantly below state average.
Length of stay since moving in significantly above state average.
Number of college students significantly below state average.
Percentage of population with a bachelor's degree or higher significantly below state average.
Averages for the 2020 tax year for zip code 15724, filed in 2021:
Average Adjusted Gross Income (AGI) in 2020: $50,191 (Individual Income Tax Returns)
Here:
$50,191
State:
$75,707
Salary/wage: $45,343 (reported on 74.7% of returns)
Here:
$45,343
State:
$62,806
(% of AGI for various income ranges: 930.5% for AGIs below $25k, 3281.4% for AGIs $25k-50k, 6080.9% for AGIs $50k-75k, 7878.7% for AGIs $75k-100k, 14236.3% for AGIs $100k-200k)
Taxable interest for individuals: $712 (reported on 26.3% of returns)
This zip code:
$712
Pennsylvania:
$1,633
(% of AGI for various income ranges: 22.9% for AGIs below $25k, 18.2% for AGIs $25k-50k, 16.4% for AGIs $50k-75k, 75.0% for AGIs $75k-100k, 23.8% for AGIs $100k-200k)
Ordinary dividends: $1,185 (reported on 13.1% of returns)
Here:
$1,185
State:
$7,382
(% of AGI for various income ranges: 21.4% for AGIs below $25k, 3.6% for AGIs $25k-50k, 32.7% for AGIs $50k-75k, 32.5% for AGIs $75k-100k, 48.8% for AGIs $100k-200k)
Net capital gain/loss in AGI: +$4,740 (reported on 10.1% of returns)
Here:
+$4,740
State:
+$23,522
(% of AGI for various income ranges: 34.5% for AGIs $25k-50k, 282.7% for AGIs $50k-75k, 108.7% for AGIs $100k-200k)
Profit/loss from business: +$9,633 (reported on 15.2% of returns)
Here:
+$9,633
State:
+$16,274
(% of AGI for various income ranges: 105.7% for AGIs below $25k, 241.4% for AGIs $25k-50k, 434.5% for AGIs $50k-75k, 267.5% for AGIs $100k-200k)
Taxable individual retirement arrangement distribution: $11,411 (reported on 9.1% of returns)
15724:
$11,411
Pennsylvania:
$18,583
(% of AGI for various income ranges: 82.4% for AGIs below $25k, 144.1% for AGIs $25k-50k, 671.2% for AGIs $75k-100k)
Earned income credit: $2,108 (reported on 12.1% of returns)
Here:
$2,108
State:
$2,100
(% of AGI for various income ranges: 60.0% for AGIs below $25k, 57.7% for AGIs $25k-50k)
Percentage of individuals using paid preparers for their 2020 taxes: 97.0%
Here:
97%
State:
92%
(% for various income ranges: 94.1% for AGIs below $25k, 96.4% for AGIs $25k-50k, 100.0% for AGIs $50k-75k, 100.0% for AGIs $75k-100k, 100.0% for AGIs $100k-200k)
Averages for the 2012 tax year for zip code 15724, filed in 2013:
Average Adjusted Gross Income (AGI) in 2012: $41,200 (Individual Income Tax Returns)
Here:
$41,200
State:
$61,346
Salary/wage: $37,733 (reported on 80.4% of returns)
Here:
$37,733
State:
$51,902
(% of AGI for various income ranges: 61.5% for AGIs below $25k, 75.9% for AGIs $25k-50k, 78.4% for AGIs $50k-75k, 87.6% for AGIs $75k-100k, 62.1% for AGIs $100k-200k)
Taxable interest for individuals: $673 (reported on 32.4% of returns)
This zip code:
$673
Pennsylvania:
$1,588
(% of AGI for various income ranges: 1.8% for AGIs below $25k, 0.6% for AGIs $25k-50k, 0.4% for AGIs $50k-75k, 0.3% for AGIs $75k-100k, 0.2% for AGIs $100k-200k)
Ordinary dividends: $1,094 (reported on 15.7% of returns)
Here:
$1,094
State:
$5,827
(% of AGI for various income ranges: 1.2% for AGIs below $25k, 0.3% for AGIs $25k-50k, 0.5% for AGIs $50k-75k, 0.3% for AGIs $100k-200k)
Net capital gain/loss in AGI: +$6,378 (reported on 8.8% of returns)
Here:
+$6,378
State:
+$14,495
(% of AGI for various income ranges: 0.2% for AGIs $50k-75k, 7.3% for AGIs $75k-100k)
Profit/loss from business: +$7,600 (reported on 13.7% of returns)
Here:
+$7,600
State:
+$16,268
(% of AGI for various income ranges: 5.0% for AGIs below $25k, 4.0% for AGIs $25k-50k, 3.0% for AGIs $50k-75k, 1.5% for AGIs $75k-100k)
Taxable individual retirement arrangement distribution: $8,886 (reported on 6.9% of returns)
15724:
$8,886
Pennsylvania:
$14,550
Total itemized deductions: $18,442 (19% of AGI, reported on 11.8% of returns)
Here:
$18,442
State:
$23,538
Here:
18.7% of AGI
State:
18.4% of AGI
(% of AGI for various income ranges: 6.8% for AGIs below $25k, 5.5% for AGIs $50k-75k, 8.2% for AGIs $75k-100k, 6.9% for AGIs $100k-200k)
Charity contributions: $3,689 (reported on 8.8% of returns)
Here:
$3,689
State:
$4,025
(% of AGI for various income ranges: 1.0% for AGIs $25k-50k, 0.9% for AGIs $75k-100k, 1.8% for AGIs $100k-200k)
Taxes paid: $5,608 (reported on 11.8% of returns)
15724:
$5,608
State:
$9,982
(% of AGI for various income ranges: 1.2% for AGIs below $25k, 1.3% for AGIs $50k-75k, 2.6% for AGIs $75k-100k, 2.9% for AGIs $100k-200k)
Earned income credit: $1,779 (reported on 18.6% of returns)
Here:
$1,779
State:
$2,106
(% of AGI for various income ranges: 4.6% for AGIs below $25k, 0.9% for AGIs $25k-50k)
Percentage of individuals using paid preparers for their 2012 taxes: 67.6%
Here:
68%
State:
53%
(% for various income ranges: 62.2% for AGIs below $25k, 68.0% for AGIs $25k-50k, 70.6% for AGIs $50k-75k, 77.8% for AGIs $75k-100k, 83.3% for AGIs $100k-200k)
Averages for the 2004 tax year for zip code 15724, filed in 2005:
Average Adjusted Gross Income (AGI) in 2004: $28,993 (Individual Income Tax Returns)
Here:
$28,993
State:
$48,049
Salary/wage: $26,865 (reported on 84.2% of returns)
Here:
$26,865
State:
$42,646
(% of AGI for various income ranges: 79.8% for AGIs below $10k, 70.5% for AGIs $10k-25k, 80.0% for AGIs $25k-50k, 84.4% for AGIs $50k-75k, 77.7% for AGIs $75k-100k, 68.0% for AGIs over 100k)
Taxable interest for individuals: $1,246 (reported on 37.6% of returns)
This zip code:
$1,246
Pennsylvania:
$1,657
(% of AGI for various income ranges: 2.3% for AGIs below $10k, 2.6% for AGIs $10k-25k, 1.8% for AGIs $25k-50k, 0.9% for AGIs $50k-75k, 0.9% for AGIs $75k-100k, 1.3% for AGIs over 100k)
Taxable dividends: $865 (reported on 17.3% of returns)
Here:
$865
State:
$3,566
(% of AGI for various income ranges: 2.4% for AGIs below $10k, 0.7% for AGIs $10k-25k, 0.7% for AGIs $25k-50k, 0.1% for AGIs $50k-75k, 0.3% for AGIs $75k-100k)
Net capital gain/loss: +$6,739 (reported on 11.1% of returns)
Here:
+$6,739
State:
+$9,716
(% of AGI for various income ranges: -1.3% for AGIs below $10k, 0.1% for AGIs $10k-25k, 1.0% for AGIs $25k-50k, 1.6% for AGIs $50k-75k, 17.0% for AGIs $75k-100k)
Profit/loss from business: +$6,767 (reported on 13.7% of returns)
Here:
+$6,767
State:
+$14,267
(% of AGI for various income ranges: 3.7% for AGIs below $10k, 4.9% for AGIs $10k-25k, 4.4% for AGIs $25k-50k, 2.5% for AGIs $50k-75k)
IRA payment deduction: $2,206 (reported on 3.2% of returns)
15724:
$2,206
Pennsylvania:
$2,903
Total itemized deductions: $13,974 (23% of AGI, reported on 10.8% of returns)
Here:
$13,974
State:
$18,804
Here:
22.6% of AGI
State:
19.5% of AGI
(% of AGI for various income ranges: 1.9% for AGIs $10k-25k, 4.2% for AGIs $25k-50k, 7.2% for AGIs $50k-75k, 8.2% for AGIs $75k-100k, 9.9% for AGIs over 100k)
Charity contributions deductions: $2,885 (4% of AGI, reported on 8.1% of returns)
Here:
$2,885
State:
$3,337
Here:
4.4% of AGI
State:
3.3% of AGI
(% of AGI for various income ranges: 0.7% for AGIs $25k-50k, 1.2% for AGIs $50k-75k, 1.6% for AGIs $75k-100k, 1.1% for AGIs over 100k)
Total tax: $2,974 (reported on 68.6% of returns)
15724:
$2,974
State:
$8,008
(% of AGI for various income ranges: 1.8% for AGIs below $10k, 3.9% for AGIs $10k-25k, 6.0% for AGIs $25k-50k, 8.2% for AGIs $50k-75k, 10.8% for AGIs $75k-100k, 13.2% for AGIs over 100k)
Earned income credit: $1,522 (reported on 19.2% of returns)
Here:
$1,522
State:
$1,643
Percentage of individuals using paid preparers for their 2004 taxes: 69.4%
Here:
69%
State:
56%
(% for various income ranges: 62.9% for AGIs below $10k, 67.0% for AGIs $10k-25k, 74.5% for AGIs $25k-50k, 71.9% for AGIs $50k-75k, 77.5% for AGIs $75k-100k, 84.2% for AGIs over 100k)
Household received Food Stamps/SNAP in the past 12 months: 105 Household did not receive Food Stamps/SNAP in the past 12 months: 800
Women who had a birth in the past 12 months: 22 (1 now married, 18 unmarried) Women who did not have a birth in the past 12 months: 393 (155 now married, 238 unmarried)
Housing units in zip code 15724 with a mortgage: 298 (52 second mortgage, 52 both second mortgage and home equity loan) Houses without a mortgage: 30
Median monthly owner costs for units with a mortgage: $854 Median monthly owner costs for units without a mortgage: $408
Residents with income below the poverty level in 2022:
This zip code:
6.8%
Whole state:
11.8%
Residents with income below 50% of the poverty level in 2022:
This zip code:
4.9%
Whole state:
6.1%
Median number of rooms in houses and condos:
Here:
6.1
State:
6.8
Median number of rooms in apartments:
Here:
6.7
State:
4.3
Notable locations in this zip code not listed on our city pages
Notable locations in zip code 15724: Chetremon Golf Course (A), Sharkstown (B), Living Waters Camp (C), Grant (D), Beringer (E), Cherry Tree Volunteer Fire Company (F). Display/hide their locations on the map
Streams, rivers, and creeks: Bakers Run (A), Shryock Run (B), Sawmill Run (C), Rock Run (D), Powell Run (E), Isenberg Run (F), Patchin Run (G), Hazelet Run (H), Boiling Spring Run (I). Display/hide their locations on the map
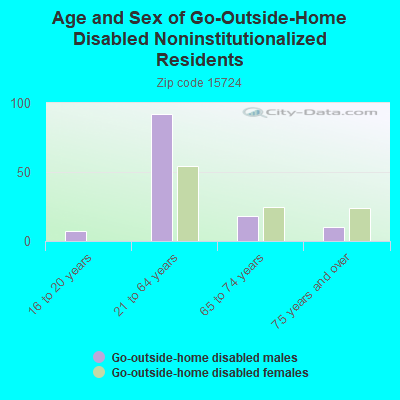
In group quarters: 5 (-1 institutionalized population)
Size of family households: 332 2-persons, 180 3-persons, 103 4-persons, 22 5-persons, 2 6-persons, 4 7-or-more-persons
Size of nonfamily households: 216 1-person, 33 2-persons, 9 3-persons
224 married couples with children.
93 single-parent households (11 men, 82 women).
97.5% of residents of 15724 zip code speak English at home.
1.5% of residents speak Spanish at home (100% very well).
0.7% of residents speak other Indo-European language at home (100% very well).
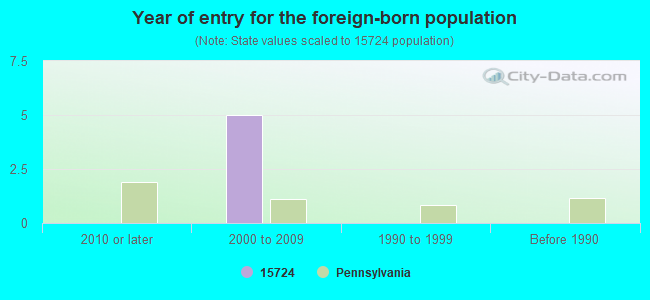
Foreign born population: 5 (0.2%) (20.7% of them are naturalized citizens)
This zip code:
0.2%
Whole state:
7.5%
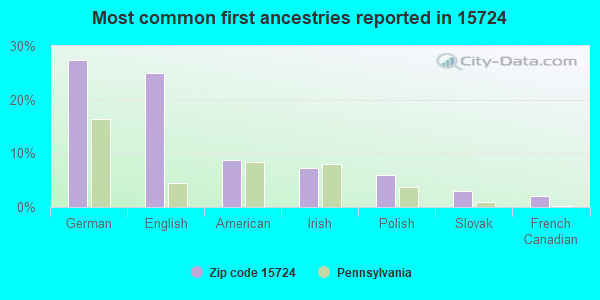
27%German
25%English
9%American
7%Irish
6%Polish
3%Slovak
2%French Canadian
Year of entry for the foreign-born population
02010 or later
52000 to 2009
01990 to 1999
0Before 1990
Housing units lacking complete plumbing facilities: 2.5% Housing units lacking complete kitchen facilities: 4.0%
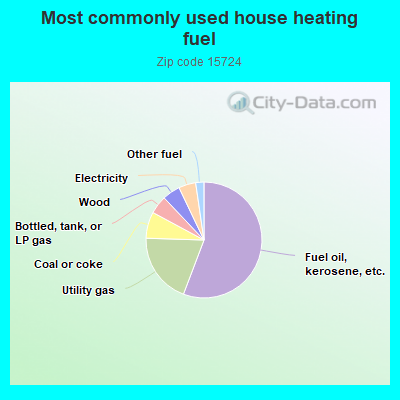
56.0%Fuel oil, kerosene, etc.
19.8%Utility gas
7.4%Coal or coke
5.1%Bottled, tank, or LP gas
5.0%Wood
4.8%Electricity
2.3%Other fuel
Population in 1990: 2,220. Population change in the 1990s: +623 (+28.1%).
Place of birth for U.S.-born residents:
This state: 2,041
Northeast: 41
Midwest: 46
South: 44
West: 63
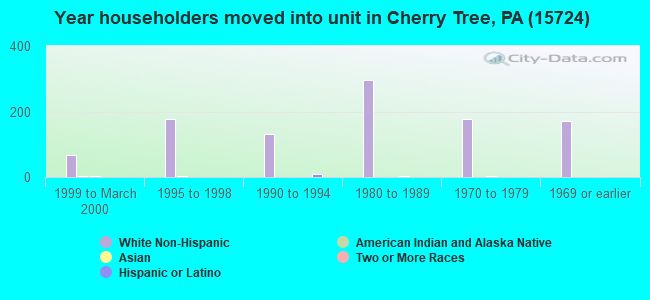
79% of the 15724 zip code residents lived in the same house 5 years ago. Out of people who lived in different houses, 51% lived in this county. Out of people who lived in different counties, 50% lived in Pennsylvania.
94% of the 15724 zip code residents lived in the same house 1 year ago. Out of people who lived in different houses, 26% moved from this county. Out of people who lived in different houses, 54% moved from different county within same state. Out of people who lived in different houses, 22% moved from different state.
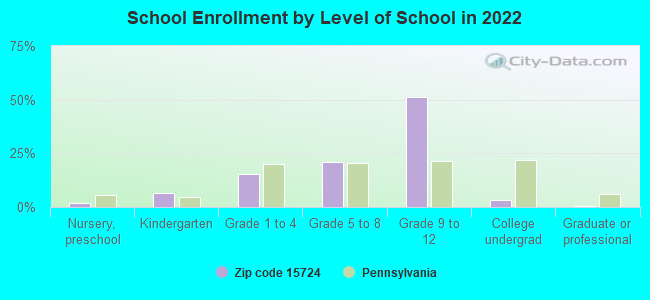
Private vs. public school enrollment:
Students in private schools in grades 1 to 8 (elementary and middle school): 40
Here:
32.8%
Pennsylvania:
15.7%
Students in private schools in grades 9 to 12 (high school): 13
Here:
7.7%
Pennsylvania:
13.4%
Students in private undergraduate colleges: 2
Here:
16.8%
Pennsylvania:
39.8%
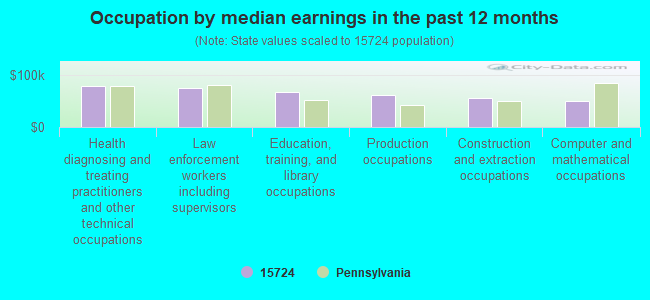
Occupation by median earnings in the past 12 months ($)
78,251Health diagnosing and treating practitioners and other technical occupations
74,915Law enforcement workers including supervisors
66,838Education, training, and library occupations
61,524Production occupations
55,389Construction and extraction occupations
50,261Computer and mathematical occupations
Companies with federal contracts located in this zip code:
SPACE CHEMICAL, INC (RD2, BOX 187A in CHERRY TREE, PA; small business) : $1,003,436 in 24 contractsfrom 2000 to 2006
Contracts for Miscellaneous Chemical Specialties, Cleaning and Polishing Compounds and Preparations by Defense Logistics Agency, Federal Supply Service Signed by year:2000: $75,968; 2001: $142,959; 2002: $135,186; 2003: $125,868; 2004: $443,869; 2005: $42,214; 2006: $37,372.
Biggest contracts:
$175,076 with Defense Logistics Agency for Miscellaneous Chemical Specialties. Signed on 2004-04-15. Completion date: 2004-04-15.
$85,268, same as above.Signed on 2004-05-17. Completion date: 2004-06-16.
$76,870, same as above.Signed on 2002-04-08. Completion date: 2002-05-08.
$75,968, same as above.Signed on 2000-06-22. Completion date: 2000-07-22.
Top industries in this zip code by the number of employees in 2005:
Health Care and Social Assistance: Nursing Care Facilities (10-19 employees: 1 establishment)
Accommodation and Food Services: Full-Service Restaurants (10-19: 1)
Other Services (except Public Administration): Religious Organizations (1-4: 5)
Finance and Insurance: Insurance Agencies and Brokerages (5-9: 1)
Administrative and Support and Waste Management and Remediation Services: Carpet and Upholstery Cleaning Services (5-9: 1)
Finance and Insurance: Commercial Banking (5-9: 1)
People in group quarters in 2010:
5 people in group homes intended for adults
People in group quarters in 2000:
61 people in nursing homes
7 people in homes for the mentally retarded
Fatal accident statistics in 2014:
Fatal accident count: 3
Vehicles involved in fatal accidents: 4
Fatal accidents caused by drunken drivers: 1
Fatalities: 3
Persons involved in fatal accidents: 6
Pedestrians involved in fatal accidents: 0
Fatal accident statistics in 2011:
Fatal accident count: 1
Vehicles involved in fatal accidents: 1
Fatal accidents caused by drunken drivers: 0
Fatalities: 1
Persons involved in fatal accidents: 1
Pedestrians involved in fatal accidents: 0
Home Mortgage Disclosure Act Aggregated Statistics For Year 2009 (Based on 2 partial tracts)
A) FHA, FSA/RHS & VA Home Purchase Loans
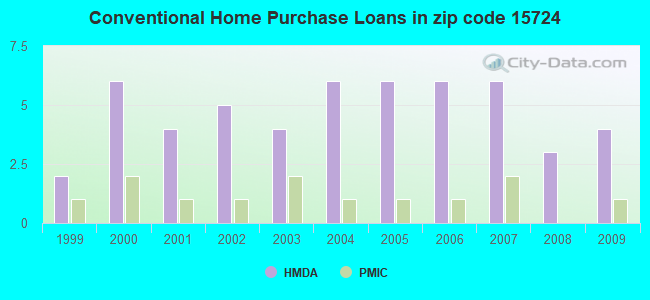
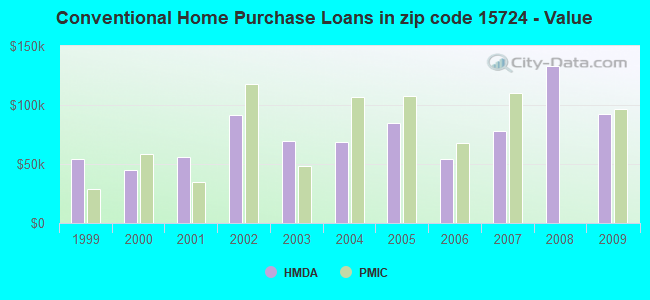
B) Conventional Home Purchase Loans
C) Refinancings
D) Home Improvement Loans
Number
Average Value
Number
Average Value
Number
Average Value
Number
Average Value
LOANS ORIGINATED
1
$79,120
4
$92,128
10
$81,313
3
$26,017
APPLICATIONS APPROVED, NOT ACCEPTED
0
$0
0
$0
1
$119,110
0
$0
APPLICATIONS DENIED
0
$0
0
$0
5
$62,264
2
$19,995
APPLICATIONS WITHDRAWN
0
$0
1
$66,860
4
$114,918
0
$0
FILES CLOSED FOR INCOMPLETENESS
0
$0
0
$0
0
$0
0
$0
Aggregated Statistics For Year 2008 (Based on 2 partial tracts)
A) FHA, FSA/RHS & VA Home Purchase Loans
B) Conventional Home Purchase Loans
C) Refinancings
D) Home Improvement Loans
F) Non-occupant Loans on < 5 Family Dwellings (A B C & D)
G) Loans On Manufactured Home Dwelling (A B C & D)
Number
Average Value
Number
Average Value
Number
Average Value
Number
Average Value
Number
Average Value
Number
Average Value
LOANS ORIGINATED
1
$46,440
3
$133,300
9
$75,441
7
$29,394
1
$42,350
0
$0
APPLICATIONS APPROVED, NOT ACCEPTED
0
$0
0
$0
2
$75,035
1
$12,040
0
$0
0
$0
APPLICATIONS DENIED
0
$0
0
$0
9
$77,018
4
$47,245
0
$0
1
$74,170
APPLICATIONS WITHDRAWN
0
$0
1
$149,640
3
$80,697
0
$0
0
$0
0
$0
FILES CLOSED FOR INCOMPLETENESS
0
$0
0
$0
1
$79,980
0
$0
0
$0
0
$0
Aggregated Statistics For Year 2007 (Based on 2 partial tracts)
B) Conventional Home Purchase Loans
C) Refinancings
D) Home Improvement Loans
F) Non-occupant Loans on < 5 Family Dwellings (A B C & D)
G) Loans On Manufactured Home Dwelling (A B C & D)
Number
Average Value
Number
Average Value
Number
Average Value
Number
Average Value
Number
Average Value
LOANS ORIGINATED
6
$78,332
11
$65,535
6
$32,358
1
$38,910
1
$15,050
APPLICATIONS APPROVED, NOT ACCEPTED
0
$0
3
$51,387
1
$18,700
0
$0
0
$0
APPLICATIONS DENIED
3
$73,030
13
$68,833
5
$43,688
1
$39,990
1
$52,240
APPLICATIONS WITHDRAWN
0
$0
3
$75,823
1
$27,730
0
$0
0
$0
FILES CLOSED FOR INCOMPLETENESS
0
$0
1
$72,030
0
$0
0
$0
0
$0
Aggregated Statistics For Year 2006 (Based on 2 partial tracts)
B) Conventional Home Purchase Loans
C) Refinancings
D) Home Improvement Loans
F) Non-occupant Loans on < 5 Family Dwellings (A B C & D)
G) Loans On Manufactured Home Dwelling (A B C & D)
Number
Average Value
Number
Average Value
Number
Average Value
Number
Average Value
Number
Average Value
LOANS ORIGINATED
6
$54,180
16
$67,469
13
$24,444
1
$40,850
2
$34,510
APPLICATIONS APPROVED, NOT ACCEPTED
1
$86,860
3
$70,663
1
$15,910
0
$0
0
$0
APPLICATIONS DENIED
1
$113,090
14
$88,734
4
$42,300
1
$155,230
1
$36,550
APPLICATIONS WITHDRAWN
1
$45,580
6
$89,045
0
$0
0
$0
0
$0
FILES CLOSED FOR INCOMPLETENESS
0
$0
2
$103,200
0
$0
0
$0
0
$0
Aggregated Statistics For Year 2005 (Based on 2 partial tracts)
B) Conventional Home Purchase Loans
C) Refinancings
D) Home Improvement Loans
F) Non-occupant Loans on < 5 Family Dwellings (A B C & D)
G) Loans On Manufactured Home Dwelling (A B C & D)
Number
Average Value
Number
Average Value
Number
Average Value
Number
Average Value
Number
Average Value
LOANS ORIGINATED
6
$85,068
13
$67,725
7
$23,466
1
$30,750
1
$49,230
APPLICATIONS APPROVED, NOT ACCEPTED
1
$78,690
2
$46,010
1
$23,430
0
$0
0
$0
APPLICATIONS DENIED
2
$74,925
14
$70,796
3
$32,823
0
$0
1
$33,110
APPLICATIONS WITHDRAWN
1
$106,640
8
$77,508
2
$73,100
0
$0
0
$0
FILES CLOSED FOR INCOMPLETENESS
0
$0
1
$92,020
0
$0
0
$0
0
$0
Aggregated Statistics For Year 2004 (Based on 2 partial tracts)
B) Conventional Home Purchase Loans
C) Refinancings
D) Home Improvement Loans
F) Non-occupant Loans on < 5 Family Dwellings (A B C & D)
G) Loans On Manufactured Home Dwelling (A B C & D)
Number
Average Value
Number
Average Value
Number
Average Value
Number
Average Value
Number
Average Value
LOANS ORIGINATED
6
$68,835
15
$63,038
11
$25,175
1
$11,180
2
$37,515
APPLICATIONS APPROVED, NOT ACCEPTED
0
$0
3
$93,310
2
$17,525
0
$0
0
$0
APPLICATIONS DENIED
2
$97,505
12
$65,485
5
$22,488
0
$0
2
$37,625
APPLICATIONS WITHDRAWN
0
$0
6
$65,288
0
$0
0
$0
0
$0
FILES CLOSED FOR INCOMPLETENESS
0
$0
2
$85,250
0
$0
0
$0
0
$0
Aggregated Statistics For Year 2003 (Based on 2 partial tracts)
B) Conventional Home Purchase Loans
C) Refinancings
D) Home Improvement Loans
F) Non-occupant Loans on < 5 Family Dwellings (A B C & D)
Number
Average Value
Number
Average Value
Number
Average Value
Number
Average Value
LOANS ORIGINATED
4
$69,500
24
$61,427
13
$26,958
1
$37,410
APPLICATIONS APPROVED, NOT ACCEPTED
0
$0
6
$47,658
0
$0
0
$0
APPLICATIONS DENIED
3
$42,570
15
$64,815
3
$14,260
1
$38,910
APPLICATIONS WITHDRAWN
0
$0
5
$60,846
0
$0
0
$0
FILES CLOSED FOR INCOMPLETENESS
0
$0
0
$0
0
$0
0
$0
Aggregated Statistics For Year 2002 (Based on 2 partial tracts)
A) FHA, FSA/RHS & VA Home Purchase Loans
B) Conventional Home Purchase Loans
C) Refinancings
D) Home Improvement Loans
F) Non-occupant Loans on < 5 Family Dwellings (A B C & D)
Number
Average Value
Number
Average Value
Number
Average Value
Number
Average Value
Number
Average Value
LOANS ORIGINATED
1
$60,410
5
$91,762
17
$69,306
6
$24,905
1
$44,080
APPLICATIONS APPROVED, NOT ACCEPTED
0
$0
1
$42,780
4
$90,515
1
$22,360
0
$0
APPLICATIONS DENIED
0
$0
2
$24,510
14
$62,396
2
$16,880
1
$17,410
APPLICATIONS WITHDRAWN
0
$0
1
$47,730
4
$76,162
0
$0
0
$0
FILES CLOSED FOR INCOMPLETENESS
0
$0
0
$0
2
$62,995
0
$0
0
$0
Aggregated Statistics For Year 2001 (Based on 2 partial tracts)
A) FHA, FSA/RHS & VA Home Purchase Loans
B) Conventional Home Purchase Loans
C) Refinancings
D) Home Improvement Loans
Number
Average Value
Number
Average Value
Number
Average Value
Number
Average Value
LOANS ORIGINATED
1
$38,270
4
$55,845
10
$53,385
10
$22,360
APPLICATIONS APPROVED, NOT ACCEPTED
0
$0
0
$0
3
$45,793
1
$18,060
APPLICATIONS DENIED
0
$0
2
$34,290
9
$48,327
2
$4,515
APPLICATIONS WITHDRAWN
0
$0
0
$0
5
$59,900
1
$27,310
FILES CLOSED FOR INCOMPLETENESS
0
$0
0
$0
1
$47,730
0
$0
Aggregated Statistics For Year 2000 (Based on 2 partial tracts)
A) FHA, FSA/RHS & VA Home Purchase Loans
B) Conventional Home Purchase Loans
C) Refinancings
D) Home Improvement Loans
F) Non-occupant Loans on < 5 Family Dwellings (A B C & D)
Number
Average Value
Number
Average Value
Number
Average Value
Number
Average Value
Number
Average Value
LOANS ORIGINATED
1
$99,110
6
$45,115
7
$56,483
8
$13,169
1
$37,410
APPLICATIONS APPROVED, NOT ACCEPTED
0
$0
1
$47,090
2
$62,885
1
$15,480
0
$0
APPLICATIONS DENIED
0
$0
3
$36,337
8
$46,844
2
$13,760
0
$0
APPLICATIONS WITHDRAWN
0
$0
1
$38,060
3
$42,070
0
$0
0
$0
FILES CLOSED FOR INCOMPLETENESS
0
$0
0
$0
1
$55,260
0
$0
0
$0
Aggregated Statistics For Year 1999 (Based on 1 partial tract)
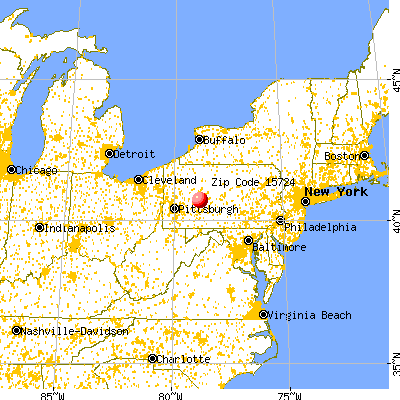


 Nearest zip codes: 15738, 15712, 15746, 15721, 15714, 15760.


 : $1,003,436 in 24 contracts from 2000 to 2006