Estimated zip code population in 2022: 7,102 Zip code population in 2010: 6,671 Zip code population in 2000: 6,559
Houses and condos: 3,139 Renter-occupied apartments: 671
% of renters here:
24%
State:
31%
March 2022 cost of living index in zip code 15851: 90.2 (less than average, U.S. average is 100)
Land area: 93.6 sq. mi. Water area: 0.4 sq. mi.
Population density: 76 people per square mile
(very low).
OSM Map
General Map
Google Map
MSN Map
OSM Map
General Map
Google Map
MSN Map
OSM Map
General Map
Google Map
MSN Map
OSM Map
General Map
Google Map
MSN Map
Please wait while loading the map...
Real estate property taxes paid for housing units in 2022:
This zip code:
1.1% ($1,321)
Pennsylvania:
1.3% ($3,094)
Median real estate property taxes paid for housing units with mortgages in 2022: $1,425 (1.1%) Median real estate property taxes paid for housing units with no mortgage in 2022: $1,193 (1.1%)
Averages for the 2020 tax year for zip code 15851, filed in 2021:
Average Adjusted Gross Income (AGI) in 2020: $48,624 (Individual Income Tax Returns)
Here:
$48,624
State:
$75,707
Salary/wage: $42,658 (reported on 77.7% of returns)
Here:
$42,658
State:
$62,806
(% of AGI for various income ranges: 1070.1% for AGIs below $25k, 3394.2% for AGIs $25k-50k, 6057.1% for AGIs $50k-75k, 8401.4% for AGIs $75k-100k, 12484.5% for AGIs $100k-200k)
Taxable interest for individuals: $752 (reported on 29.2% of returns)
This zip code:
$752
Pennsylvania:
$1,633
(% of AGI for various income ranges: 20.6% for AGIs below $25k, 16.6% for AGIs $25k-50k, 41.8% for AGIs $50k-75k, 40.0% for AGIs $75k-100k, 34.0% for AGIs $100k-200k)
Ordinary dividends: $3,133 (reported on 16.7% of returns)
Here:
$3,133
State:
$7,382
(% of AGI for various income ranges: 23.5% for AGIs below $25k, 27.3% for AGIs $25k-50k, 91.8% for AGIs $50k-75k, 94.1% for AGIs $75k-100k, 205.0% for AGIs $100k-200k)
Net capital gain/loss in AGI: +$7,362 (reported on 12.1% of returns)
Here:
+$7,362
State:
+$23,522
(% of AGI for various income ranges: 6.4% for AGIs below $25k, 36.6% for AGIs $25k-50k, 114.7% for AGIs $50k-75k, 146.8% for AGIs $75k-100k, 468.5% for AGIs $100k-200k)
Profit/loss from business: +$16,055 (reported on 13.8% of returns)
Here:
+$16,055
State:
+$16,274
(% of AGI for various income ranges: 113.3% for AGIs below $25k, 273.9% for AGIs $25k-50k, 631.5% for AGIs $50k-75k, 382.3% for AGIs $75k-100k, 620.5% for AGIs $100k-200k)
Taxable individual retirement arrangement distribution: $10,729 (reported on 11.5% of returns)
15851:
$10,729
Pennsylvania:
$18,583
(% of AGI for various income ranges: 92.6% for AGIs below $25k, 101.6% for AGIs $25k-50k, 176.2% for AGIs $50k-75k, 308.2% for AGIs $75k-100k, 590.5% for AGIs $100k-200k)
Total itemized deductions: $39,100 (reported on 0.7% of returns)
Here:
$39,100
State:
$34,850
(% of AGI for various income ranges: 355.5% for AGIs $75k-100k)
Taxes paid: $5,567 (reported on 1.0% of returns)
15851:
$5,567
State:
$8,200
(% of AGI for various income ranges: 75.9% for AGIs $75k-100k)
Earned income credit: $2,024 (reported on 16.7% of returns)
Here:
$2,024
State:
$2,100
(% of AGI for various income ranges: 88.2% for AGIs below $25k, 64.0% for AGIs $25k-50k)
Percentage of individuals using paid preparers for their 2020 taxes: 93.4%
Here:
93%
State:
92%
(% for various income ranges: 92.1% for AGIs below $25k, 94.0% for AGIs $25k-50k, 93.8% for AGIs $50k-75k, 93.1% for AGIs $75k-100k, 96.3% for AGIs $100k-200k, 100.0% for AGIs over 200k)
Averages for the 2012 tax year for zip code 15851, filed in 2013:
Average Adjusted Gross Income (AGI) in 2012: $38,794 (Individual Income Tax Returns)
Here:
$38,794
State:
$61,346
Salary/wage: $34,913 (reported on 81.7% of returns)
Here:
$34,913
State:
$51,902
(% of AGI for various income ranges: 68.7% for AGIs below $25k, 78.2% for AGIs $25k-50k, 78.4% for AGIs $50k-75k, 75.4% for AGIs $75k-100k, 91.5% for AGIs $100k-200k)
Taxable interest for individuals: $976 (reported on 31.2% of returns)
This zip code:
$976
Pennsylvania:
$1,588
(% of AGI for various income ranges: 1.5% for AGIs below $25k, 0.7% for AGIs $25k-50k, 0.6% for AGIs $50k-75k, 0.4% for AGIs $75k-100k, 1.5% for AGIs $100k-200k)
Ordinary dividends: $2,195 (reported on 18.0% of returns)
Here:
$2,195
State:
$5,827
(% of AGI for various income ranges: 0.9% for AGIs below $25k, 0.8% for AGIs $25k-50k, 0.6% for AGIs $50k-75k, 1.0% for AGIs $75k-100k, 2.7% for AGIs $100k-200k)
Net capital gain/loss in AGI: +$5,390 (reported on 10.0% of returns)
Here:
+$5,390
State:
+$14,495
(% of AGI for various income ranges: 0.6% for AGIs below $25k, 0.4% for AGIs $25k-50k, 0.9% for AGIs $50k-75k, 1.5% for AGIs $75k-100k, 5.0% for AGIs $100k-200k)
Profit/loss from business: +$10,679 (reported on 13.5% of returns)
Here:
+$10,679
State:
+$16,268
(% of AGI for various income ranges: 5.8% for AGIs below $25k, 2.9% for AGIs $25k-50k, 2.3% for AGIs $50k-75k, 4.5% for AGIs $75k-100k, 6.5% for AGIs $100k-200k)
Taxable individual retirement arrangement distribution: $7,525 (reported on 11.6% of returns)
15851:
$7,525
Pennsylvania:
$14,550
(% of AGI for various income ranges: 3.9% for AGIs below $25k, 2.6% for AGIs $25k-50k, 1.5% for AGIs $50k-75k, 2.1% for AGIs $75k-100k, 2.5% for AGIs $100k-200k)
Total itemized deductions: $18,606 (21% of AGI, reported on 10.3% of returns)
Here:
$18,606
State:
$23,538
Here:
20.9% of AGI
State:
18.4% of AGI
(% of AGI for various income ranges: 2.4% for AGIs below $25k, 2.9% for AGIs $25k-50k, 4.5% for AGIs $50k-75k, 5.3% for AGIs $75k-100k, 13.3% for AGIs $100k-200k)
Charity contributions: $3,990 (reported on 6.4% of returns)
Here:
$3,990
State:
$4,025
(% of AGI for various income ranges: 0.4% for AGIs $25k-50k, 0.6% for AGIs $50k-75k, 1.0% for AGIs $75k-100k, 1.7% for AGIs $100k-200k)
Taxes paid: $5,462 (reported on 10.3% of returns)
15851:
$5,462
State:
$9,982
(% of AGI for various income ranges: 0.6% for AGIs below $25k, 0.8% for AGIs $25k-50k, 1.0% for AGIs $50k-75k, 1.8% for AGIs $75k-100k, 4.4% for AGIs $100k-200k)
Earned income credit: $1,862 (reported on 18.0% of returns)
Here:
$1,862
State:
$2,106
(% of AGI for various income ranges: 4.8% for AGIs below $25k, 0.9% for AGIs $25k-50k)
Percentage of individuals using paid preparers for their 2012 taxes: 61.1%
Here:
61%
State:
53%
(% for various income ranges: 53.5% for AGIs below $25k, 63.0% for AGIs $25k-50k, 72.0% for AGIs $50k-75k, 72.7% for AGIs $75k-100k, 78.6% for AGIs $100k-200k)
Averages for the 2004 tax year for zip code 15851, filed in 2005:
Average Adjusted Gross Income (AGI) in 2004: $30,142 (Individual Income Tax Returns)
Here:
$30,142
State:
$48,049
Salary/wage: $27,668 (reported on 81.7% of returns)
Here:
$27,668
State:
$42,646
(% of AGI for various income ranges: 116.5% for AGIs below $10k, 69.0% for AGIs $10k-25k, 79.7% for AGIs $25k-50k, 81.7% for AGIs $50k-75k, 75.7% for AGIs $75k-100k, 43.8% for AGIs over 100k)
Taxable interest for individuals: $1,327 (reported on 40.4% of returns)
This zip code:
$1,327
Pennsylvania:
$1,657
(% of AGI for various income ranges: 7.2% for AGIs below $10k, 2.4% for AGIs $10k-25k, 1.5% for AGIs $25k-50k, 1.1% for AGIs $50k-75k, 1.0% for AGIs $75k-100k, 2.7% for AGIs over 100k)
Taxable dividends: $1,521 (reported on 21.7% of returns)
Here:
$1,521
State:
$3,566
(% of AGI for various income ranges: 4.1% for AGIs below $10k, 1.4% for AGIs $10k-25k, 0.7% for AGIs $25k-50k, 0.6% for AGIs $50k-75k, 0.9% for AGIs $75k-100k, 2.4% for AGIs over 100k)
Net capital gain/loss: +$3,065 (reported on 14.8% of returns)
Here:
+$3,065
State:
+$9,716
(% of AGI for various income ranges: 2.0% for AGIs below $10k, 0.7% for AGIs $10k-25k, 0.6% for AGIs $25k-50k, 1.1% for AGIs $50k-75k, 2.0% for AGIs $75k-100k, 5.5% for AGIs over 100k)
Profit/loss from business: +$9,410 (reported on 15.7% of returns)
Here:
+$9,410
State:
+$14,267
(% of AGI for various income ranges: -4.3% for AGIs below $10k, 6.8% for AGIs $10k-25k, 4.5% for AGIs $25k-50k, 4.5% for AGIs $50k-75k, 1.5% for AGIs $75k-100k, 9.9% for AGIs over 100k)
IRA payment deduction: $2,263 (reported on 3.3% of returns)
15851:
$2,263
Pennsylvania:
$2,903
Total itemized deductions: $13,943 (21% of AGI, reported on 11.0% of returns)
Here:
$13,943
State:
$18,804
Here:
21.4% of AGI
State:
19.5% of AGI
(% of AGI for various income ranges: 5.5% for AGIs below $10k, 3.1% for AGIs $10k-25k, 3.9% for AGIs $25k-50k, 5.4% for AGIs $50k-75k, 8.0% for AGIs $75k-100k, 7.6% for AGIs over 100k)
Charity contributions deductions: $2,947 (4% of AGI, reported on 8.1% of returns)
Here:
$2,947
State:
$3,337
Here:
4.0% of AGI
State:
3.3% of AGI
(% of AGI for various income ranges: 0.5% for AGIs below $10k, 0.3% for AGIs $10k-25k, 0.3% for AGIs $25k-50k, 0.7% for AGIs $50k-75k, 1.5% for AGIs $75k-100k, 2.3% for AGIs over 100k)
Total tax: $3,584 (reported on 68.3% of returns)
15851:
$3,584
State:
$8,008
(% of AGI for various income ranges: 2.9% for AGIs below $10k, 4.0% for AGIs $10k-25k, 5.9% for AGIs $25k-50k, 8.5% for AGIs $50k-75k, 10.8% for AGIs $75k-100k, 17.7% for AGIs over 100k)
Earned income credit: $1,506 (reported on 18.7% of returns)
Here:
$1,506
State:
$1,643
Percentage of individuals using paid preparers for their 2004 taxes: 65.4%
Here:
65%
State:
56%
(% for various income ranges: 59.2% for AGIs below $10k, 64.7% for AGIs $10k-25k, 69.6% for AGIs $25k-50k, 67.6% for AGIs $50k-75k, 68.9% for AGIs $75k-100k, 76.3% for AGIs over 100k)
Likely homosexual households (counted as self-reported same-sex unmarried-partner households)
Lesbian couples: 0.0% of all households
Gay men: 0.2% of all households
Household received Food Stamps/SNAP in the past 12 months: 471 Household did not receive Food Stamps/SNAP in the past 12 months: 2,359
Women who had a birth in the past 12 months: 95 (96 now married, 5 unmarried) Women who did not have a birth in the past 12 months: 1,287 (495 now married, 792 unmarried)
Housing units in zip code 15851 with a mortgage: 1,093 (132 second mortgage, 11 home equity loan, 114 both second mortgage and home equity loan) Houses without a mortgage: 120
Median monthly owner costs for units with a mortgage: $1,013 Median monthly owner costs for units without a mortgage: $391
Residents with income below the poverty level in 2022:
This zip code:
15.9%
Whole state:
11.8%
Residents with income below 50% of the poverty level in 2022:
This zip code:
7.4%
Whole state:
6.1%
Median number of rooms in houses and condos:
Here:
6.5
State:
6.8
Median number of rooms in apartments:
Here:
4.8
State:
4.3
Notable locations in this zip code not listed on our city pages
Churches in zip code 15851 include: Trinity Church (A), Saint Christophers Church (B), Saint Pauls Church (C), Panic Church (D), Paradise Church (E), Bollinger Church (F). Display/hide their locations on the map
Cemeteries: Lakelawn Memorial Park (1), Beulah Cemetery (2), Soldier Hill Cemetery (3), Holy Trinity Cemetery (4), Reynoldsville Cemetery (5), Prospect Cemetery (6). Display/hide their locations on the map
Streams, rivers, and creeks: O'Donnell Run (A), Soldier Run (B), Turnip Run (C), Trout Run (D), Panther Run (E), Horm Run (F), Front Run (G), Fehley Run (H), McCreight Run (I). Display/hide their locations on the map
1,081 married couples with children.
295 single-parent households (74 men, 221 women).
92.4% of residents of 15851 zip code speak English at home.
0.1% of residents speak Spanish at home (38% very well, 62% not well).
6.6% of residents speak other Indo-European language at home (79% very well, 12% well, 7% not well, 2% not at all).
0.2% of residents speak Asian or Pacific Island language at home (100% very well).
Foreign born population: 34 (0.5%) (40.4% of them are naturalized citizens)
This zip code:
0.5%
Whole state:
7.5%
18%France
12%Hungary
9%Sweden
41%German
11%American
6%Irish
5%Italian
5%Pennsylvania German
4%English
3%Swiss
Year of entry for the foreign-born population
252010 or later
02000 to 2009
01990 to 1999
49Before 1990
Facilities with environmental interests located in this zip code:
C G JOHNSON EL SCH ( in REYNOLDSVILLE, PA)
(National Center for Education Statistics) - STATE ID-2385 Organizations: DUBOIS AREA SD (SCHOOL DISTRICT)
Housing units lacking complete plumbing facilities: 6.1% Housing units lacking complete kitchen facilities: 7.0%
57.1%Utility gas
10.1%Bottled, tank, or LP gas
10.1%Electricity
8.9%Wood
8.5%Fuel oil, kerosene, etc.
2.8%Coal or coke
2.7%Other fuel
Population in 1990: 8,758.
Place of birth for U.S.-born residents:
This state: 6,159
Northeast: 384
Midwest: 122
South: 248
West: 63
74% of the 15851 zip code residents lived in the same house 5 years ago. Out of people who lived in different houses, 51% lived in this county. Out of people who lived in different counties, 50% lived in Pennsylvania.
96% of the 15851 zip code residents lived in the same house 1 year ago. Out of people who lived in different houses, 22% moved from this county. Out of people who lived in different houses, 51% moved from different county within same state. Out of people who lived in different houses, 32% moved from different state. Out of people who lived in different houses, 3% moved from abroad.
Private vs. public school enrollment:
Students in private schools in grades 1 to 8 (elementary and middle school): 219
Here:
29.7%
Pennsylvania:
15.7%
Students in private schools in grades 9 to 12 (high school): 23
Here:
5.6%
Pennsylvania:
13.4%
Students in private undergraduate colleges: 14
Here:
14.0%
Pennsylvania:
39.8%
Occupation by median earnings in the past 12 months ($)
81,993Computer and mathematical occupations
62,463Installation, maintenance, and repair occupations
62,410Health diagnosing and treating practitioners and other technical occupations
53,743Community and social service occupations
53,400Transportation occupations
52,492Business and financial operations occupations
Top industries in this zip code by the number of employees in 2005:
Other Services (except Public Administration): Commercial and Industrial Machinery and Equipment (except Automotive and Electronic) Repair and Maintenance (50-99 employees: 1 establishment, 1-4 employees: 1 establishment)
Accommodation and Food Services: Full-Service Restaurants (10-19: 3, 1-4: 1)
Finance and Insurance: Commercial Banking (20-49: 1, 5-9: 1)
Construction: Commercial and Institutional Building Construction (20-49: 1)
Administrative and Support and Waste Management and Remediation Services: Janitorial Services (10-19: 1, 5-9: 1, 1-4: 1)
People in group quarters in 2010:
8 people in group homes intended for adults
People in group quarters in 2000:
39 people in other noninstitutional group quarters
7 people in homes for the mentally retarded
Fatal accident statistics in 2014:
Fatal accident count: 2
Vehicles involved in fatal accidents: 3
Fatal accidents caused by drunken drivers: 1
Fatalities: 2
Persons involved in fatal accidents: 3
Pedestrians involved in fatal accidents: 0
Fatal accident statistics in 2013:
Fatal accident count: 3
Vehicles involved in fatal accidents: 4
Fatal accidents caused by drunken drivers: 0
Fatalities: 3
Persons involved in fatal accidents: 5
Pedestrians involved in fatal accidents: 0
2005 - 2018 National Fire Incident Reporting System (NFIRS) incidents
Based on the data from the years 2005 - 2018 the average number of fires per year is 11. The highest number of fires - 27 took place in 2018, and the least - 2 in 2010. The data has a rising trend.
When looking into fire subcategories, the most incidents belonged to: Structure Fires (73.0%), and Outside Fires (15.8%).
Fire incident types reported to NFIRS in Zip Code 15851


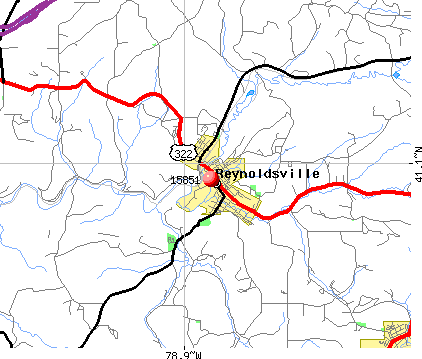 Nearest zip codes: 15711, 15865, 15840, 15863, 15847, 15733.


 Based on the data from the years 2005 - 2018 the average number of fires per year is 11. The highest number of fires - 27 took place in 2018, and the least - 2 in 2010. The data has a rising trend.
 When looking into fire subcategories, the most incidents belonged to: Structure Fires (73.0%), and Outside Fires (15.8%).