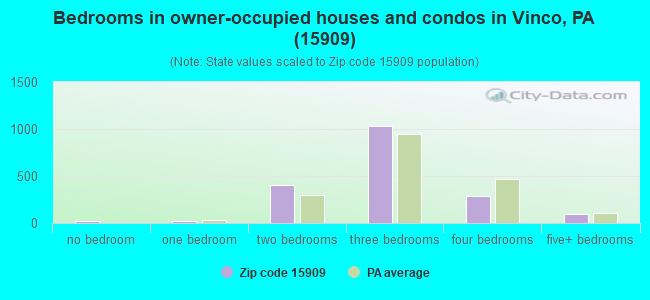
Estimated zip code population in 2022: 4,905 Zip code population in 2010: 5,611 Zip code population in 2000: 6,551
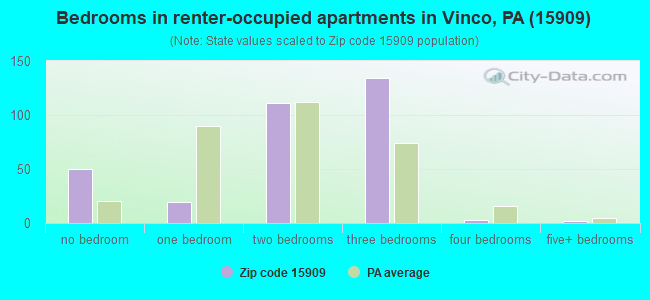
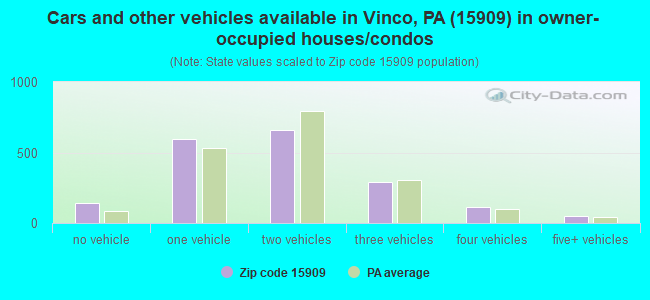
Houses and condos: 2,553 Renter-occupied apartments: 317
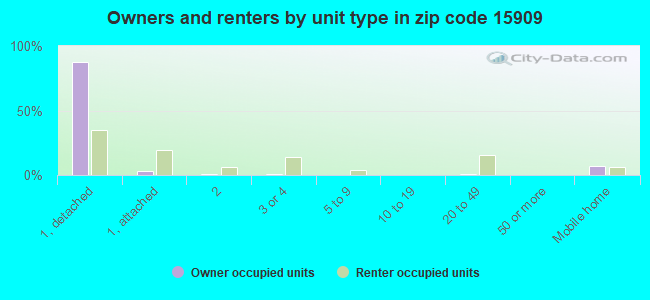
% of renters here:
15%
State:
31%
March 2022 cost of living index in zip code 15909: 89.2 (less than average, U.S. average is 100)
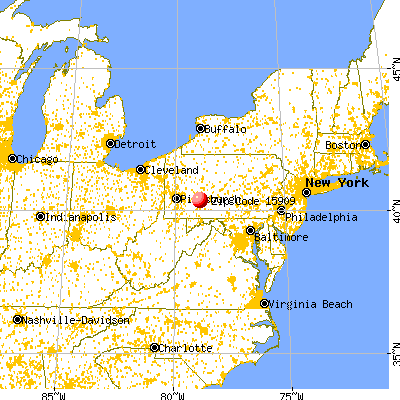
Land area: 17.2 sq. mi. Water area: 0.1 sq. mi.
Population density: 286 people per square mile
(very low).
OSM Map
General Map
Google Map
MSN Map
OSM Map
General Map
Google Map
MSN Map
OSM Map
General Map
Google Map
MSN Map
OSM Map
General Map
Google Map
MSN Map
Please wait while loading the map...
Real estate property taxes paid for housing units in 2022:
This zip code:
1.2% ($1,322)
Pennsylvania:
1.3% ($3,094)
Median real estate property taxes paid for housing units with mortgages in 2022: $1,430 (1.0%) Median real estate property taxes paid for housing units with no mortgage in 2022: $1,240 (1.3%)
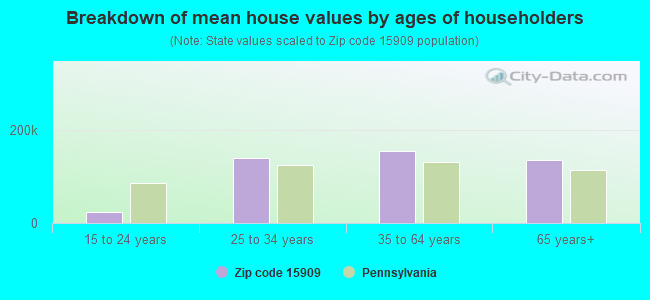
Estimated median house/condo value in 2022: $112,222
15909:
$112,222
Pennsylvania:
$245,500
According to our research of Pennsylvania and other state lists, there were 9 registered sex offenders living in 15909 zip code as of May 22, 2024. The ratio of all residents to sex offenders in zip code 15909 is 591 to 1. The ratio of registered sex offenders to all residents in this zip code is near the state average.
Median resident age:
This zip code:
48.7 years
Pennsylvania median age:
40.9 years
Average household size:
This zip code:
2.3 people
Pennsylvania:
2.4 people
Averages for the 2020 tax year for zip code 15909, filed in 2021:
Average Adjusted Gross Income (AGI) in 2020: $47,127 (Individual Income Tax Returns)
Here:
$47,127
State:
$75,707
Salary/wage: $42,782 (reported on 78.7% of returns)
Here:
$42,782
State:
$62,806
(% of AGI for various income ranges: 999.2% for AGIs below $25k, 3009.5% for AGIs $25k-50k, 5975.0% for AGIs $50k-75k, 8373.3% for AGIs $75k-100k, 13402.1% for AGIs $100k-200k)
Taxable interest for individuals: $845 (reported on 33.1% of returns)
This zip code:
$845
Pennsylvania:
$1,633
(% of AGI for various income ranges: 30.3% for AGIs below $25k, 27.1% for AGIs $25k-50k, 30.4% for AGIs $50k-75k, 47.2% for AGIs $75k-100k, 96.3% for AGIs $100k-200k)
Ordinary dividends: $1,563 (reported on 16.1% of returns)
Here:
$1,563
State:
$7,382
(% of AGI for various income ranges: 14.9% for AGIs below $25k, 20.5% for AGIs $25k-50k, 44.6% for AGIs $50k-75k, 38.9% for AGIs $75k-100k, 120.0% for AGIs $100k-200k)
Net capital gain/loss in AGI: +$4,296 (reported on 11.0% of returns)
Here:
+$4,296
State:
+$23,522
(% of AGI for various income ranges: 10.3% for AGIs below $25k, 11.0% for AGIs $25k-50k, 64.6% for AGIs $50k-75k, 114.4% for AGIs $75k-100k, 360.0% for AGIs $100k-200k)
Profit/loss from business: +$8,453 (reported on 7.5% of returns)
Here:
+$8,453
State:
+$16,274
(% of AGI for various income ranges: 28.6% for AGIs below $25k, 59.7% for AGIs $25k-50k, 175.4% for AGIs $50k-75k, 303.7% for AGIs $100k-200k)
Taxable individual retirement arrangement distribution: $9,755 (reported on 13.0% of returns)
15909:
$9,755
Pennsylvania:
$18,583
(% of AGI for various income ranges: 103.2% for AGIs below $25k, 111.5% for AGIs $25k-50k, 184.6% for AGIs $50k-75k, 347.8% for AGIs $75k-100k, 393.2% for AGIs $100k-200k)
Total itemized deductions: $27,067 (reported on 1.2% of returns)
Here:
$27,067
State:
$34,850
(% of AGI for various income ranges: 290.0% for AGIs $50k-75k)
Taxes paid: $5,033 (reported on 1.2% of returns)
15909:
$5,033
State:
$8,200
(% of AGI for various income ranges: 53.9% for AGIs $50k-75k)
Earned income credit: $2,100 (reported on 13.8% of returns)
Here:
$2,100
State:
$2,100
(% of AGI for various income ranges: 68.3% for AGIs below $25k, 49.3% for AGIs $25k-50k)
Percentage of individuals using paid preparers for their 2020 taxes: 94.1%
Here:
94%
State:
92%
(% for various income ranges: 92.6% for AGIs below $25k, 95.8% for AGIs $25k-50k, 94.7% for AGIs $50k-75k, 91.3% for AGIs $75k-100k, 96.0% for AGIs $100k-200k, 100.0% for AGIs over 200k)
Averages for the 2012 tax year for zip code 15909, filed in 2013:
Average Adjusted Gross Income (AGI) in 2012: $39,198 (Individual Income Tax Returns)
Here:
$39,198
State:
$61,346
Salary/wage: $36,934 (reported on 80.9% of returns)
Here:
$36,934
State:
$51,902
(% of AGI for various income ranges: 65.7% for AGIs below $25k, 75.7% for AGIs $25k-50k, 77.9% for AGIs $50k-75k, 81.7% for AGIs $75k-100k, 85.0% for AGIs $100k-200k, 57.8% for AGIs over 200k)
Taxable interest for individuals: $937 (reported on 37.8% of returns)
This zip code:
$937
Pennsylvania:
$1,588
(% of AGI for various income ranges: 1.8% for AGIs below $25k, 0.8% for AGIs $25k-50k, 0.8% for AGIs $50k-75k, 1.1% for AGIs $75k-100k, 0.6% for AGIs $100k-200k)
Ordinary dividends: $1,144 (reported on 18.3% of returns)
Here:
$1,144
State:
$5,827
(% of AGI for various income ranges: 1.0% for AGIs below $25k, 0.4% for AGIs $25k-50k, 0.5% for AGIs $50k-75k, 0.4% for AGIs $75k-100k, 0.7% for AGIs $100k-200k)
Net capital gain/loss in AGI: +$545 (reported on 8.4% of returns)
Here:
+$545
State:
+$14,495
(% of AGI for various income ranges: 0.2% for AGIs $50k-75k, 0.3% for AGIs $75k-100k, 0.3% for AGIs $100k-200k)
Profit/loss from business: +$10,352 (reported on 8.8% of returns)
Here:
+$10,352
State:
+$16,268
(% of AGI for various income ranges: 1.7% for AGIs below $25k, 0.7% for AGIs $25k-50k, 2.4% for AGIs $50k-75k, 1.4% for AGIs $75k-100k, 6.8% for AGIs $100k-200k)
Taxable individual retirement arrangement distribution: $7,307 (reported on 11.5% of returns)
15909:
$7,307
Pennsylvania:
$14,550
(% of AGI for various income ranges: 3.2% for AGIs below $25k, 2.9% for AGIs $25k-50k, 1.9% for AGIs $50k-75k, 1.8% for AGIs $75k-100k, 1.5% for AGIs $100k-200k)
Total itemized deductions: $16,690 (19% of AGI, reported on 11.1% of returns)
Here:
$16,690
State:
$23,538
Here:
18.9% of AGI
State:
18.4% of AGI
(% of AGI for various income ranges: 2.3% for AGIs below $25k, 2.9% for AGIs $25k-50k, 4.8% for AGIs $50k-75k, 4.9% for AGIs $75k-100k, 6.9% for AGIs $100k-200k, 10.9% for AGIs over 200k)
Charity contributions: $3,171 (reported on 8.0% of returns)
Here:
$3,171
State:
$4,025
(% of AGI for various income ranges: 0.6% for AGIs $25k-50k, 0.5% for AGIs $50k-75k, 0.8% for AGIs $75k-100k, 1.6% for AGIs $100k-200k)
Taxes paid: $5,534 (reported on 11.1% of returns)
15909:
$5,534
State:
$9,982
(% of AGI for various income ranges: 0.4% for AGIs below $25k, 0.7% for AGIs $25k-50k, 1.2% for AGIs $50k-75k, 1.5% for AGIs $75k-100k, 3.2% for AGIs $100k-200k, 4.9% for AGIs over 200k)
Earned income credit: $1,991 (reported on 16.4% of returns)
Here:
$1,991
State:
$2,106
(% of AGI for various income ranges: 4.5% for AGIs below $25k, 0.9% for AGIs $25k-50k)
Percentage of individuals using paid preparers for their 2012 taxes: 52.7%
Here:
53%
State:
53%
(% for various income ranges: 47.1% for AGIs below $25k, 54.3% for AGIs $25k-50k, 56.4% for AGIs $50k-75k, 57.9% for AGIs $75k-100k, 84.6% for AGIs $100k-200k)
Averages for the 2004 tax year for zip code 15909, filed in 2005:
Average Adjusted Gross Income (AGI) in 2004: $31,542 (Individual Income Tax Returns)
Here:
$31,542
State:
$48,049
Salary/wage: $30,562 (reported on 81.7% of returns)
Here:
$30,562
State:
$42,646
(% of AGI for various income ranges: 69.6% for AGIs below $10k, 65.2% for AGIs $10k-25k, 83.8% for AGIs $25k-50k, 84.9% for AGIs $50k-75k, 90.1% for AGIs $75k-100k, 64.0% for AGIs over 100k)
Taxable interest for individuals: $1,162 (reported on 48.2% of returns)
This zip code:
$1,162
Pennsylvania:
$1,657
(% of AGI for various income ranges: 4.8% for AGIs below $10k, 3.9% for AGIs $10k-25k, 1.5% for AGIs $25k-50k, 1.2% for AGIs $50k-75k, 0.7% for AGIs $75k-100k, 1.0% for AGIs over 100k)
Taxable dividends: $835 (reported on 21.3% of returns)
Here:
$835
State:
$3,566
(% of AGI for various income ranges: 2.2% for AGIs below $10k, 1.3% for AGIs $10k-25k, 0.3% for AGIs $25k-50k, 0.3% for AGIs $50k-75k, 0.3% for AGIs $75k-100k, 0.6% for AGIs over 100k)
Net capital gain/loss: +$2,621 (reported on 12.7% of returns)
Here:
+$2,621
State:
+$9,716
(% of AGI for various income ranges: -2.0% for AGIs below $10k, 0.7% for AGIs $10k-25k, 0.0% for AGIs $25k-50k, 0.7% for AGIs $50k-75k, -0.1% for AGIs $75k-100k, 7.2% for AGIs over 100k)
Profit/loss from business: +$5,570 (reported on 9.2% of returns)
Here:
+$5,570
State:
+$14,267
(% of AGI for various income ranges: 2.0% for AGIs below $10k, 3.4% for AGIs $10k-25k, 0.9% for AGIs $25k-50k, 1.4% for AGIs $50k-75k, 3.3% for AGIs over 100k)
IRA payment deduction: $2,687 (reported on 3.7% of returns)
15909:
$2,687
Pennsylvania:
$2,903
(% of AGI for various income ranges: 0.2% for AGIs $10k-25k, 0.5% for AGIs $25k-50k, 0.4% for AGIs $50k-75k, 0.3% for AGIs $75k-100k)
Total itemized deductions: $13,586 (20% of AGI, reported on 12.1% of returns)
Here:
$13,586
State:
$18,804
Here:
20.1% of AGI
State:
19.5% of AGI
(% of AGI for various income ranges: 2.9% for AGIs $10k-25k, 3.9% for AGIs $25k-50k, 6.8% for AGIs $50k-75k, 6.9% for AGIs $75k-100k, 8.3% for AGIs over 100k)
Charity contributions deductions: $2,522 (4% of AGI, reported on 10.4% of returns)
Here:
$2,522
State:
$3,337
Here:
3.6% of AGI
State:
3.3% of AGI
(% of AGI for various income ranges: 0.4% for AGIs $10k-25k, 0.6% for AGIs $25k-50k, 1.1% for AGIs $50k-75k, 0.7% for AGIs $75k-100k, 2.0% for AGIs over 100k)
Total tax: $3,592 (reported on 69.2% of returns)
15909:
$3,592
State:
$8,008
(% of AGI for various income ranges: 1.3% for AGIs below $10k, 3.7% for AGIs $10k-25k, 6.4% for AGIs $25k-50k, 8.1% for AGIs $50k-75k, 10.1% for AGIs $75k-100k, 16.8% for AGIs over 100k)
Earned income credit: $1,577 (reported on 15.8% of returns)
Here:
$1,577
State:
$1,643
Percentage of individuals using paid preparers for their 2004 taxes: 56.6%
Here:
57%
State:
56%
(% for various income ranges: 54.9% for AGIs below $10k, 56.9% for AGIs $10k-25k, 55.1% for AGIs $25k-50k, 58.2% for AGIs $50k-75k, 59.0% for AGIs $75k-100k, 70.8% for AGIs over 100k)
Likely homosexual households (counted as self-reported same-sex unmarried-partner households)
Lesbian couples: 0.0% of all households
Gay men: 0.2% of all households
Household received Food Stamps/SNAP in the past 12 months: 324 Household did not receive Food Stamps/SNAP in the past 12 months: 1,849
Women who had a birth in the past 12 months: 29 (20 now married, 8 unmarried) Women who did not have a birth in the past 12 months: 851 (348 now married, 502 unmarried)
Housing units in zip code 15909 with a mortgage: 733 (62 second mortgage, 62 both second mortgage and home equity loan) Houses without a mortgage: 76
Median monthly owner costs for units with a mortgage: $1,089 Median monthly owner costs for units without a mortgage: $502
Residents with income below the poverty level in 2022:
This zip code:
14.3%
Whole state:
11.8%
Residents with income below 50% of the poverty level in 2022:
This zip code:
6.8%
Whole state:
6.1%
Median number of rooms in houses and condos:
Here:
6.6
State:
6.8
Median number of rooms in apartments:
Here:
5.4
State:
4.3
Notable locations in this zip code not listed on our city pages
Notable locations in zip code 15909: Franklin Volunteer Fire Company (A), East Taylor Township Volunteer Fire Department (B), Conemaugh Volunteer Fire Department (C). Display/hide their locations on the map
Churches in zip code 15909 include: Saint Pauls Church (A), Singer Hill Church (B), Summit Chapel (C), Pike Church (D). Display/hide their locations on the map
In group quarters: 12 (-1 institutionalized population)
Size of family households: 750 2-persons, 360 3-persons, 160 4-persons, 79 5-persons, 27 6-persons, 2 7-or-more-persons
Size of nonfamily households: 679 1-person, 101 2-persons, 11 3-persons
431 married couples with children.
364 single-parent households (135 men, 229 women).
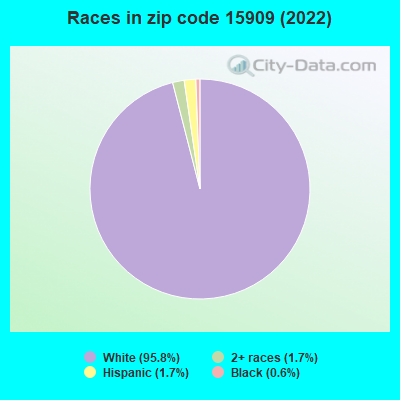
98.8% of residents of 15909 zip code speak English at home.
0.6% of residents speak Spanish at home (47% very well, 50% well, 3% not at all).
0.3% of residents speak other Indo-European language at home (85% very well, 15% well).
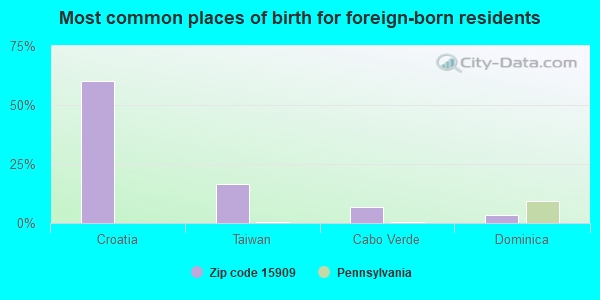
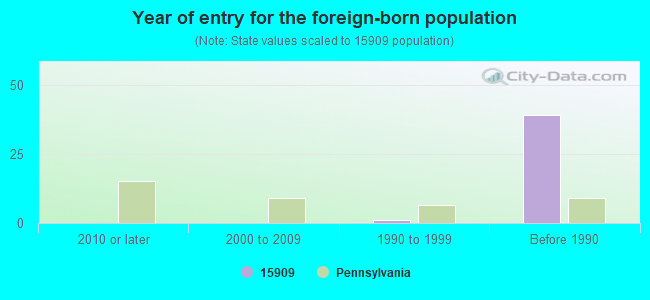
Foreign born population: 30 (0.6%) (96.7% of them are naturalized citizens)
AURANDT MOTOR CO INC (2641 WILLIAM PENN AVE in JOHNSTOWN, PA)
Conditionally Exempt Small Quantity Generators, less than 100 kg/month of hazardous waste (Resource Conservation and Recovery Act (tracking hazardous waste)) - notification Organizations: OPERNAME (CONTACT/OPERATOR)
, AURANDTS MOTOR CO INC (CONTACT/OWNER)
Alternative names: AURANDTS MOTOR CO INC
Housing units lacking complete plumbing facilities: 9.5% Housing units lacking complete kitchen facilities: 9.1%
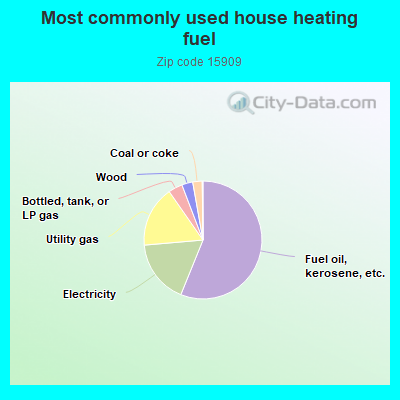
56.2%Fuel oil, kerosene, etc.
17.5%Electricity
16.7%Utility gas
3.9%Bottled, tank, or LP gas
3.0%Wood
2.6%Coal or coke
Population in 1990: 7,944.
Place of birth for U.S.-born residents:
This state: 4,370
Northeast: 73
Midwest: 60
South: 276
West: 39
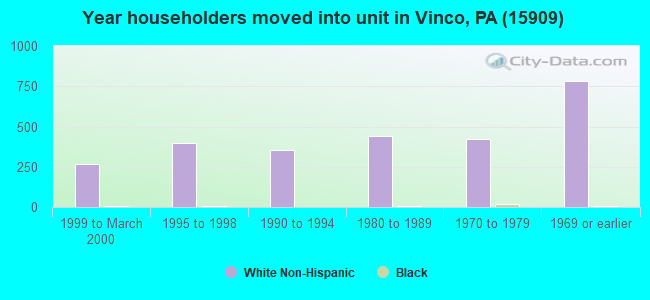
77% of the 15909 zip code residents lived in the same house 5 years ago. Out of people who lived in different houses, 84% lived in this county. Out of people who lived in different counties, 50% lived in Pennsylvania.
96% of the 15909 zip code residents lived in the same house 1 year ago. Out of people who lived in different houses, 69% moved from this county. Out of people who lived in different houses, 30% moved from different county within same state. Out of people who lived in different houses, 4% moved from different state.
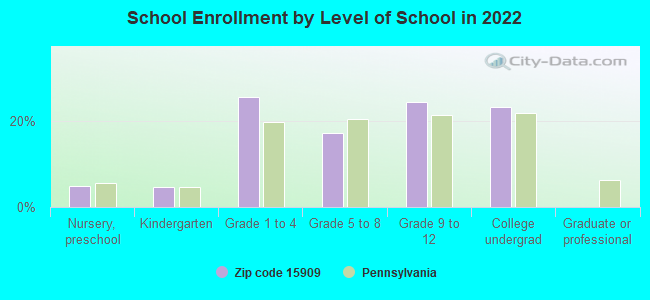
Private vs. public school enrollment:
Students in private schools in grades 1 to 8 (elementary and middle school): 76
Here:
19.1%
Pennsylvania:
15.7%
Students in private schools in grades 9 to 12 (high school): 41
Here:
18.2%
Pennsylvania:
13.4%
Students in private undergraduate colleges: 15
Here:
7.4%
Pennsylvania:
39.8%
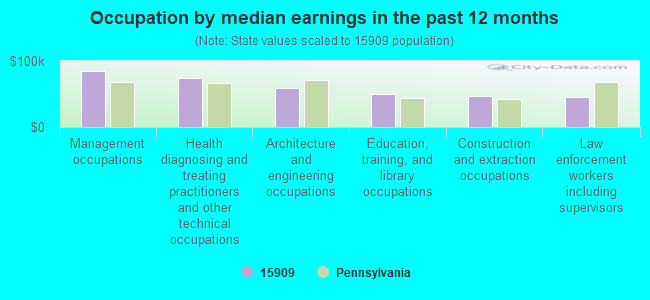
Occupation by median earnings in the past 12 months ($)
85,177Management occupations
74,396Health diagnosing and treating practitioners and other technical occupations
58,390Architecture and engineering occupations
50,357Education, training, and library occupations
47,265Construction and extraction occupations
46,142Law enforcement workers including supervisors
Top industries in this zip code by the number of employees in 2005:
Health Care and Social Assistance: Homes for the Elderly (20-49 employees: 1 establishment, 10-19 employees: 1 establishment)
Other Services (except Public Administration): Religious Organizations (10-19: 1, 5-9: 3, 1-4: 5)
Construction: Site Preparation Contractors (10-19: 1, 5-9: 1, 1-4: 3)
Other Services (except Public Administration): Civic and Social Organizations (5-9: 2, 1-4: 4)
Finance and Insurance: Commercial Banking (5-9: 3)
People in group quarters in 2000:
27 people in other noninstitutional group quarters
Fatal accident statistics in 2014:
Fatal accident count: 3
Vehicles involved in fatal accidents: 4
Fatal accidents caused by drunken drivers: 0
Fatalities: 3
Persons involved in fatal accidents: 5
Pedestrians involved in fatal accidents: 0
Fatal accident statistics in 2013:
Fatal accident count: 1
Vehicles involved in fatal accidents: 2
Fatal accidents caused by drunken drivers: 0
Fatalities: 1
Persons involved in fatal accidents: 2
Pedestrians involved in fatal accidents: 0
Home Mortgage Disclosure Act Aggregated Statistics For Year 2009 (Based on 8 partial tracts)
A) FHA, FSA/RHS & VA Home Purchase Loans
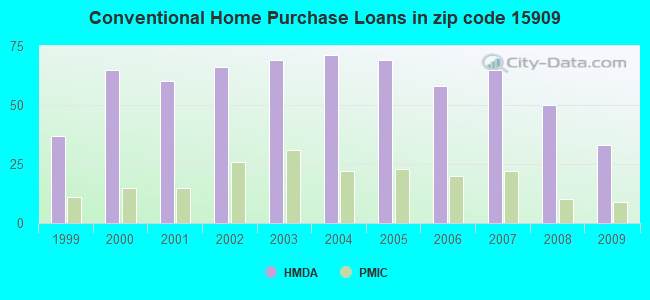
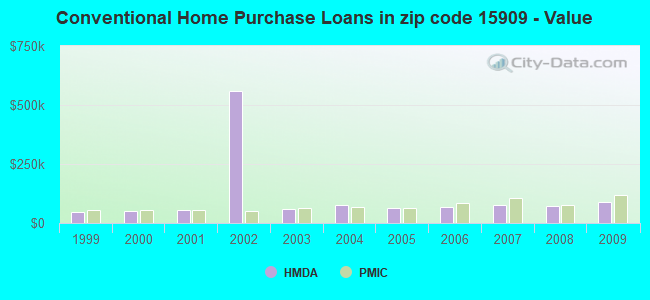
B) Conventional Home Purchase Loans
C) Refinancings
D) Home Improvement Loans
F) Non-occupant Loans on < 5 Family Dwellings (A B C & D)
G) Loans On Manufactured Home Dwelling (A B C & D)
Number
Average Value
Number
Average Value
Number
Average Value
Number
Average Value
Number
Average Value
Number
Average Value
LOANS ORIGINATED
36
$78,724
33
$90,161
110
$85,808
51
$25,705
10
$80,396
4
$21,078
APPLICATIONS APPROVED, NOT ACCEPTED
2
$83,180
6
$73,288
8
$93,405
4
$7,850
2
$18,475
3
$40,997
APPLICATIONS DENIED
4
$81,492
16
$66,360
52
$93,510
23
$25,480
2
$80,745
4
$42,262
APPLICATIONS WITHDRAWN
2
$130,010
5
$128,138
23
$98,854
1
$5,740
2
$73,190
1
$17,000
FILES CLOSED FOR INCOMPLETENESS
4
$44,250
2
$119,940
2
$115,160
0
$0
0
$0
1
$60,440
Aggregated Statistics For Year 2008 (Based on 8 partial tracts)
A) FHA, FSA/RHS & VA Home Purchase Loans
B) Conventional Home Purchase Loans
C) Refinancings
D) Home Improvement Loans
F) Non-occupant Loans on < 5 Family Dwellings (A B C & D)
G) Loans On Manufactured Home Dwelling (A B C & D)
Number
Average Value
Number
Average Value
Number
Average Value
Number
Average Value
Number
Average Value
Number
Average Value
LOANS ORIGINATED
24
$66,079
50
$72,263
81
$74,631
78
$22,391
17
$39,791
6
$60,145
APPLICATIONS APPROVED, NOT ACCEPTED
1
$48,250
2
$40,085
8
$61,512
5
$25,272
1
$51,000
2
$40,085
APPLICATIONS DENIED
6
$78,307
16
$46,495
87
$88,964
50
$41,915
5
$19,260
15
$55,910
APPLICATIONS WITHDRAWN
2
$73,595
8
$64,754
23
$86,880
7
$33,437
0
$0
3
$58,827
FILES CLOSED FOR INCOMPLETENESS
0
$0
3
$57,347
9
$82,618
0
$0
0
$0
0
$0
Aggregated Statistics For Year 2007 (Based on 8 partial tracts)
A) FHA, FSA/RHS & VA Home Purchase Loans
B) Conventional Home Purchase Loans
C) Refinancings
D) Home Improvement Loans
F) Non-occupant Loans on < 5 Family Dwellings (A B C & D)
G) Loans On Manufactured Home Dwelling (A B C & D)
Number
Average Value
Number
Average Value
Number
Average Value
Number
Average Value
Number
Average Value
Number
Average Value
LOANS ORIGINATED
28
$69,306
65
$74,821
102
$70,444
72
$25,767
18
$49,993
9
$48,003
APPLICATIONS APPROVED, NOT ACCEPTED
4
$57,950
9
$56,347
22
$66,260
5
$17,398
2
$118,430
5
$66,296
APPLICATIONS DENIED
2
$79,330
19
$52,160
135
$63,298
43
$31,260
5
$48,920
10
$37,645
APPLICATIONS WITHDRAWN
0
$0
10
$47,179
31
$78,306
6
$15,317
2
$98,225
2
$71,775
FILES CLOSED FOR INCOMPLETENESS
1
$47,100
0
$0
4
$50,058
1
$23,610
0
$0
0
$0
Aggregated Statistics For Year 2006 (Based on 8 partial tracts)
A) FHA, FSA/RHS & VA Home Purchase Loans
B) Conventional Home Purchase Loans
C) Refinancings
D) Home Improvement Loans
F) Non-occupant Loans on < 5 Family Dwellings (A B C & D)
G) Loans On Manufactured Home Dwelling (A B C & D)
Number
Average Value
Number
Average Value
Number
Average Value
Number
Average Value
Number
Average Value
Number
Average Value
LOANS ORIGINATED
32
$67,065
58
$69,323
123
$61,573
93
$26,478
10
$38,762
16
$55,348
APPLICATIONS APPROVED, NOT ACCEPTED
1
$23,550
8
$87,354
24
$64,493
10
$41,476
4
$66,405
2
$102,260
APPLICATIONS DENIED
1
$44,230
23
$68,870
204
$63,515
58
$33,516
9
$43,918
14
$59,241
APPLICATIONS WITHDRAWN
0
$0
13
$71,820
68
$80,298
2
$20,420
4
$61,972
2
$48,165
FILES CLOSED FOR INCOMPLETENESS
0
$0
1
$53,990
11
$83,787
1
$68,930
1
$106,260
0
$0
Aggregated Statistics For Year 2005 (Based on 8 partial tracts)
A) FHA, FSA/RHS & VA Home Purchase Loans
B) Conventional Home Purchase Loans
C) Refinancings
D) Home Improvement Loans
F) Non-occupant Loans on < 5 Family Dwellings (A B C & D)
G) Loans On Manufactured Home Dwelling (A B C & D)
Number
Average Value
Number
Average Value
Number
Average Value
Number
Average Value
Number
Average Value
Number
Average Value
LOANS ORIGINATED
9
$69,102
69
$61,879
136
$65,143
100
$27,082
11
$45,515
13
$38,587
APPLICATIONS APPROVED, NOT ACCEPTED
1
$95,380
9
$45,487
32
$67,496
7
$29,693
2
$45,205
7
$36,510
APPLICATIONS DENIED
1
$32,740
12
$54,393
173
$66,523
36
$21,729
2
$76,970
14
$60,311
APPLICATIONS WITHDRAWN
1
$24,700
13
$66,367
85
$79,368
20
$81,250
3
$53,797
2
$37,775
FILES CLOSED FOR INCOMPLETENESS
0
$0
4
$62,878
12
$71,802
2
$48,625
1
$70,830
0
$0
Aggregated Statistics For Year 2004 (Based on 8 partial tracts)
A) FHA, FSA/RHS & VA Home Purchase Loans
B) Conventional Home Purchase Loans
C) Refinancings
D) Home Improvement Loans
F) Non-occupant Loans on < 5 Family Dwellings (A B C & D)
G) Loans On Manufactured Home Dwelling (A B C & D)
Number
Average Value
Number
Average Value
Number
Average Value
Number
Average Value
Number
Average Value
Number
Average Value
LOANS ORIGINATED
8
$59,366
71
$74,276
166
$57,621
86
$29,920
12
$26,035
9
$32,234
APPLICATIONS APPROVED, NOT ACCEPTED
0
$0
12
$61,610
42
$51,607
14
$31,425
0
$0
6
$37,492
APPLICATIONS DENIED
1
$76,400
24
$47,474
159
$63,372
51
$22,005
7
$23,579
14
$49,751
APPLICATIONS WITHDRAWN
0
$0
9
$97,679
88
$76,116
22
$38,925
2
$96,905
4
$39,772
FILES CLOSED FOR INCOMPLETENESS
0
$0
0
$0
18
$100,517
2
$25,575
0
$0
0
$0
Aggregated Statistics For Year 2003 (Based on 8 partial tracts)
A) FHA, FSA/RHS & VA Home Purchase Loans
B) Conventional Home Purchase Loans
C) Refinancings
D) Home Improvement Loans
F) Non-occupant Loans on < 5 Family Dwellings (A B C & D)
Number
Average Value
Number
Average Value
Number
Average Value
Number
Average Value
Number
Average Value
LOANS ORIGINATED
20
$58,120
69
$58,486
274
$64,480
87
$29,348
6
$45,663
APPLICATIONS APPROVED, NOT ACCEPTED
0
$0
4
$42,040
53
$59,210
8
$53,721
2
$16,530
APPLICATIONS DENIED
3
$36,800
17
$40,971
118
$61,011
28
$22,116
6
$31,410
APPLICATIONS WITHDRAWN
2
$28,485
17
$51,131
74
$71,333
4
$22,258
2
$27,230
FILES CLOSED FOR INCOMPLETENESS
0
$0
1
$77,540
5
$71,360
2
$66,110
0
$0
Aggregated Statistics For Year 2002 (Based on 8 partial tracts)
A) FHA, FSA/RHS & VA Home Purchase Loans
B) Conventional Home Purchase Loans
C) Refinancings
D) Home Improvement Loans
F) Non-occupant Loans on < 5 Family Dwellings (A B C & D)
Number
Average Value
Number
Average Value
Number
Average Value
Number
Average Value
Number
Average Value
LOANS ORIGINATED
15
$71,301
66
$558,060
187
$61,389
67
$18,175
8
$25,265
APPLICATIONS APPROVED, NOT ACCEPTED
0
$0
3
$38,680
53
$60,435
3
$15,390
2
$29,175
APPLICATIONS DENIED
4
$71,065
25
$28,743
106
$54,538
37
$17,183
3
$6,297
APPLICATIONS WITHDRAWN
1
$53,419,200
10
$37,940
67
$48,905
2
$39,535
0
$0
FILES CLOSED FOR INCOMPLETENESS
0
$0
3
$28,397
22
$63,849
0
$0
0
$0
Aggregated Statistics For Year 2001 (Based on 8 partial tracts)
A) FHA, FSA/RHS & VA Home Purchase Loans
B) Conventional Home Purchase Loans
C) Refinancings
D) Home Improvement Loans
F) Non-occupant Loans on < 5 Family Dwellings (A B C & D)
Number
Average Value
Number
Average Value
Number
Average Value
Number
Average Value
Number
Average Value
LOANS ORIGINATED
14
$55,429
60
$55,051
168
$53,698
91
$19,899
6
$39,498
APPLICATIONS APPROVED, NOT ACCEPTED
0
$0
4
$22,125
51
$48,067
15
$21,514
4
$79,068
APPLICATIONS DENIED
1
$61,390
20
$42,492
139
$47,959
33
$19,429
0
$0
APPLICATIONS WITHDRAWN
0
$0
7
$65,500
71
$58,977
8
$15,770
0
$0
FILES CLOSED FOR INCOMPLETENESS
2
$45,710
0
$0
15
$56,053
2
$14,590
0
$0
Aggregated Statistics For Year 2000 (Based on 8 partial tracts)
A) FHA, FSA/RHS & VA Home Purchase Loans
B) Conventional Home Purchase Loans
C) Refinancings
D) Home Improvement Loans
E) Loans on Dwellings For 5+ Families
F) Non-occupant Loans on < 5 Family Dwellings (A B C & D)
Number
Average Value
Number
Average Value
Number
Average Value
Number
Average Value
Number
Average Value
Number
Average Value
LOANS ORIGINATED
8
$54,746
65
$52,402
68
$43,243
85
$16,101
1
$28,720
6
$19,462
APPLICATIONS APPROVED, NOT ACCEPTED
1
$46,530
3
$40,907
33
$49,374
12
$21,492
0
$0
0
$0
APPLICATIONS DENIED
0
$0
26
$27,077
93
$44,519
32
$12,269
0
$0
3
$37,150
APPLICATIONS WITHDRAWN
0
$0
2
$45,725
45
$43,733
7
$20,396
0
$0
1
$14,930
FILES CLOSED FOR INCOMPLETENESS
0
$0
5
$63,428
11
$56,737
1
$8,620
0
$0
1
$130,330
Aggregated Statistics For Year 1999 (Based on 4 partial tracts)
A) FHA, FSA/RHS & VA Home Purchase Loans
B) Conventional Home Purchase Loans
C) Refinancings
D) Home Improvement Loans
F) Non-occupant Loans on < 5 Family Dwellings (A B C & D)
2003 - 2018 National Fire Incident Reporting System (NFIRS) incidents
According to the data from the years 2003 - 2018 the average number of fire incidents per year is 19. The highest number of fires - 60 took place in 2010, and the least - 0 in 2006. The data has an increasing trend.
When looking into fire subcategories, the most reports belonged to: Structure Fires (60.1%), and Outside Fires (21.5%).
Fire incident types reported to NFIRS in Zip Code 15909


 Nearest zip codes: 15945, 15942, 15943, 15902, 15960, 15906.


 According to the data from the years 2003 - 2018 the average number of fire incidents per year is 19. The highest number of fires - 60 took place in 2010, and the least - 0 in 2006. The data has an increasing trend.
 When looking into fire subcategories, the most reports belonged to: Structure Fires (60.1%), and Outside Fires (21.5%).