Estimated zip code population in 2022: 878 Zip code population in 2010: 1,034 Zip code population in 2000: 1,212
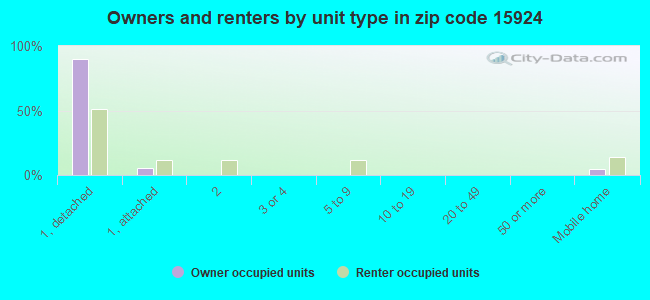
Houses and condos: 441 Renter-occupied apartments: 35
% of renters here:
10%
State:
31%
March 2022 cost of living index in zip code 15924: 90.0 (less than average, U.S. average is 100)
Land area: 26.6 sq. mi. Water area: 0.0 sq. mi.
Population density: 33 people per square mile
(very low).
OSM Map
General Map
Google Map
MSN Map
OSM Map
General Map
Google Map
MSN Map
OSM Map
General Map
Google Map
MSN Map
OSM Map
General Map
Google Map
MSN Map
Please wait while loading the map...
Real estate property taxes paid for housing units in 2022:
This zip code:
1.4% ($1,188)
Pennsylvania:
1.3% ($3,094)
Median real estate property taxes paid for housing units with mortgages in 2022: $1,155 (1.2%) Median real estate property taxes paid for housing units with no mortgage in 2022: $1,202 (1.5%)
Business Search- 14 Million verified businesses
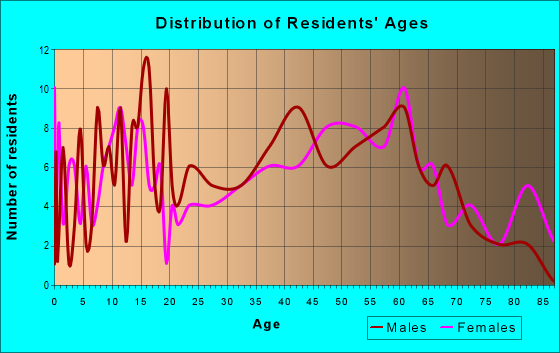
Males: 410
(46.7%)
Females: 468
(53.3%)
For population 25 years and over in 15924:
High school or higher: 89.1%
Bachelor's degree or higher: 8.7%
Graduate or professional degree: 1.9%
Unemployed: 5.1%
Mean travel time to work (commute): 31.1 minutes
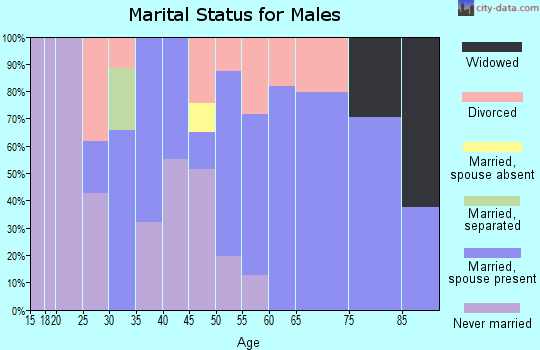
For population 15 years and over in 15924:
Never married: 33.0%
Now married: 47.3%
Separated: 0.6%
Widowed: 8.6%
Divorced: 10.5%
Zip code 15924 compared to state average:
Median house value significantly below state average.
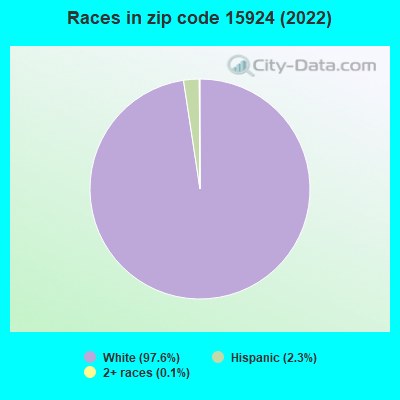
Black race population percentage significantly below state average.
Hispanic race population percentage significantly below state average.
Foreign-born population percentage significantly below state average.
Renting percentage significantly below state average.
Length of stay since moving in significantly above state average.
Number of college students significantly below state average.
Percentage of population with a bachelor's degree or higher significantly below state average.
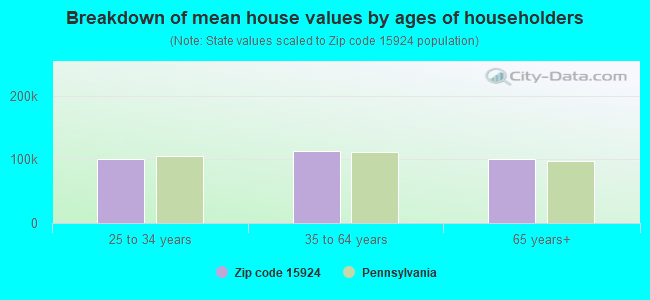
Estimated median house/condo value in 2022: $85,523
15924:
$85,523
Pennsylvania:
$245,500
According to our research of Pennsylvania and other state lists, there was 1 registered sex offender living in 15924 zip code as of May 20, 2024. The ratio of all residents to sex offenders in zip code 15924 is 1,045 to 1. The ratio of registered sex offenders to all residents in this zip code is lower than the state average.
Median resident age:
This zip code:
43.2 years
Pennsylvania median age:
40.9 years
Average household size:
This zip code:
2.4 people
Pennsylvania:
2.4 people
Averages for the 2020 tax year for zip code 15924, filed in 2021:
Average Adjusted Gross Income (AGI) in 2020: $49,124 (Individual Income Tax Returns)
Here:
$49,124
State:
$75,707
Salary/wage: $43,007 (reported on 85.7% of returns)
Here:
$43,007
State:
$62,806
(% of AGI for various income ranges: 1083.6% for AGIs below $25k, 3397.5% for AGIs $25k-50k, 6585.0% for AGIs $50k-75k, 9280.0% for AGIs $75k-100k, 20196.7% for AGIs $100k-200k)
Taxable interest for individuals: $380 (reported on 30.6% of returns)
This zip code:
$380
Pennsylvania:
$1,633
(% of AGI for various income ranges: 6.4% for AGIs below $25k, 10.0% for AGIs $25k-50k, 26.7% for AGIs $50k-75k, 73.3% for AGIs $100k-200k)
Ordinary dividends: $667 (reported on 12.2% of returns)
Here:
$667
State:
$7,382
(% of AGI for various income ranges: 25.8% for AGIs $25k-50k, 30.0% for AGIs $75k-100k)
Net capital gain/loss in AGI: +$1,067 (reported on 6.1% of returns)
Here:
+$1,067
State:
+$23,522
(% of AGI for various income ranges: 26.7% for AGIs $25k-50k)
Profit/loss from business: +$4,050 (reported on 8.2% of returns)
Here:
+$4,050
State:
+$16,274
(% of AGI for various income ranges: 135.0% for AGIs $25k-50k)
Taxable individual retirement arrangement distribution: $9,560 (reported on 10.2% of returns)
15924:
$9,560
Pennsylvania:
$18,583
(% of AGI for various income ranges: 233.6% for AGIs below $25k, 368.3% for AGIs $50k-75k)
Earned income credit: $1,771 (reported on 14.3% of returns)
Here:
$1,771
State:
$2,100
(% of AGI for various income ranges: 68.2% for AGIs below $25k, 40.8% for AGIs $25k-50k)
Percentage of individuals using paid preparers for their 2020 taxes: 91.8%
Here:
92%
State:
92%
(% for various income ranges: 88.2% for AGIs below $25k, 86.7% for AGIs $25k-50k, 100.0% for AGIs $50k-75k, 100.0% for AGIs $75k-100k, 100.0% for AGIs $100k-200k)
Averages for the 2012 tax year for zip code 15924, filed in 2013:
Average Adjusted Gross Income (AGI) in 2012: $39,481 (Individual Income Tax Returns)
Here:
$39,481
State:
$61,346
Salary/wage: $36,580 (reported on 85.4% of returns)
Here:
$36,580
State:
$51,902
(% of AGI for various income ranges: 67.2% for AGIs below $25k, 82.8% for AGIs $25k-50k, 86.2% for AGIs $50k-75k, 77.6% for AGIs $75k-100k, 74.8% for AGIs $100k-200k)
Taxable interest for individuals: $561 (reported on 37.5% of returns)
This zip code:
$561
Pennsylvania:
$1,588
(% of AGI for various income ranges: 2.5% for AGIs below $25k, 0.2% for AGIs $25k-50k, 0.1% for AGIs $50k-75k, 0.7% for AGIs $75k-100k)
Ordinary dividends: $471 (reported on 14.6% of returns)
Here:
$471
State:
$5,827
(% of AGI for various income ranges: 0.3% for AGIs below $25k, 0.4% for AGIs $25k-50k, 0.2% for AGIs $75k-100k)
Profit/loss from business: +$6,875 (reported on 8.3% of returns)
Here:
+$6,875
State:
+$16,268
Taxable individual retirement arrangement distribution: $5,800 (reported on 8.3% of returns)
15924:
$5,800
Pennsylvania:
$14,550
Total itemized deductions: $18,100 (21% of AGI, reported on 10.4% of returns)
Here:
$18,100
State:
$23,538
Here:
21.5% of AGI
State:
18.4% of AGI
(% of AGI for various income ranges: 5.5% for AGIs $25k-50k, 18.0% for AGIs $75k-100k)
Charity contributions: $1,200 (reported on 6.2% of returns)
Here:
$1,200
State:
$4,025
Taxes paid: $4,840 (reported on 10.4% of returns)
15924:
$4,840
State:
$9,982
(% of AGI for various income ranges: 1.2% for AGIs $25k-50k, 5.1% for AGIs $75k-100k)
Earned income credit: $2,262 (reported on 16.7% of returns)
Here:
$2,262
State:
$2,106
(% of AGI for various income ranges: 4.1% for AGIs below $25k, 1.8% for AGIs $25k-50k)
Percentage of individuals using paid preparers for their 2012 taxes: 52.1%
Here:
52%
State:
53%
(% for various income ranges: 45.0% for AGIs below $25k, 46.2% for AGIs $25k-50k, 62.5% for AGIs $50k-75k, 125.0% for AGIs $75k-100k)
Averages for the 2004 tax year for zip code 15924, filed in 2005:
Average Adjusted Gross Income (AGI) in 2004: $28,017 (Individual Income Tax Returns)
Here:
$28,017
State:
$48,049
Salary/wage: $27,611 (reported on 86.5% of returns)
Here:
$27,611
State:
$42,646
(% of AGI for various income ranges: 74.0% for AGIs below $10k, 78.3% for AGIs $10k-25k, 84.6% for AGIs $25k-50k, 92.2% for AGIs $50k-75k, 82.5% for AGIs $75k-100k)
Taxable interest for individuals: $1,011 (reported on 39.3% of returns)
This zip code:
$1,011
Pennsylvania:
$1,657
(% of AGI for various income ranges: 4.4% for AGIs below $10k, 2.0% for AGIs $10k-25k, 1.8% for AGIs $25k-50k, 0.6% for AGIs $50k-75k)
Taxable dividends: $686 (reported on 15.2% of returns)
Here:
$686
State:
$3,566
(% of AGI for various income ranges: 1.9% for AGIs below $10k, 0.8% for AGIs $10k-25k, 0.3% for AGIs $25k-50k, 0.1% for AGIs $50k-75k)
Net capital gain/loss: +$333 (reported on 7.8% of returns)
Here:
+$333
State:
+$9,716
Profit/loss from business: +$2,837 (reported on 9.3% of returns)
Here:
+$2,837
State:
+$14,267
Total itemized deductions: $14,568 (25% of AGI, reported on 8.0% of returns)
Here:
$14,568
State:
$18,804
Here:
25.2% of AGI
State:
19.5% of AGI
Charity contributions deductions: $1,212 (2% of AGI, reported on 7.2% of returns)
Here:
$1,212
State:
$3,337
Here:
2.1% of AGI
State:
3.3% of AGI
Total tax: $2,761 (reported on 66.3% of returns)
15924:
$2,761
State:
$8,008
(% of AGI for various income ranges: 0.6% for AGIs below $10k, 3.8% for AGIs $10k-25k, 5.9% for AGIs $25k-50k, 8.0% for AGIs $50k-75k, 12.3% for AGIs $75k-100k)
Earned income credit: $1,470 (reported on 18.0% of returns)
Here:
$1,470
State:
$1,643
Percentage of individuals using paid preparers for their 2004 taxes: 54.1%
Here:
54%
State:
56%
(% for various income ranges: 49.1% for AGIs below $10k, 55.0% for AGIs $10k-25k, 54.8% for AGIs $25k-50k, 70.8% for AGIs $50k-75k)
Household received Food Stamps/SNAP in the past 12 months: 59 Household did not receive Food Stamps/SNAP in the past 12 months: 313
Women who had a birth in the past 12 months: 10 (10 now married, 0 unmarried) Women who did not have a birth in the past 12 months: 181 (63 now married, 117 unmarried)
Housing units in zip code 15924 with a mortgage: 164 (26 second mortgage, 26 both second mortgage and home equity loan) Houses without a mortgage: 9
Median monthly owner costs for units with a mortgage: $846 Median monthly owner costs for units without a mortgage: $611
Residents with income below the poverty level in 2022:
This zip code:
12.3%
Whole state:
11.8%
Residents with income below 50% of the poverty level in 2022:
This zip code:
10.4%
Whole state:
6.1%
Median number of rooms in houses and condos:
Here:
5.6
State:
6.8
Median number of rooms in apartments:
Here:
5.2
State:
4.3
Notable locations in this zip code not listed on our city pages
Streams, rivers, and creeks: Panther Run (A), Miller Run (B), Dark Shade Creek (C), Shingle Run (D), Coal Run (E), Laurel Run (F), Beaverdam Run (G). Display/hide their locations on the map
Size of family households: 90 2-persons, 47 3-persons, 19 4-persons, 31 5-persons, 8 7-or-more-persons
Size of nonfamily households: 117 1-person, 61 2-persons
187 married couples with children.
10 single-parent households (10 women).
98.9% of residents of 15924 zip code speak English at home.
0.5% of residents speak other Indo-European language at home (100% very well).
Foreign born population: 0 (0.0%)
:
0.0%
Whole state:
7.5%
26%Polish
19%English
13%German
7%Italian
6%Hungarian
5%Irish
4%American
Housing units lacking complete kitchen facilities: 1.0%
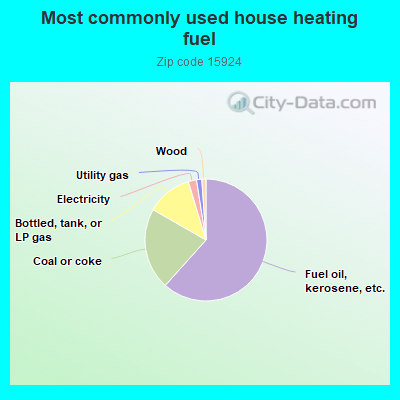
62.0%Fuel oil, kerosene, etc.
21.8%Coal or coke
12.1%Bottled, tank, or LP gas
2.2%Electricity
1.4%Utility gas
1.1%Wood
Population in 1990: 2,178.
Place of birth for U.S.-born residents:
This state: 784
Northeast: 29
Midwest: 8
South: 40
West: 8
70% of the 15924 zip code residents lived in the same house 5 years ago. Out of people who lived in different houses, 70% lived in this county. Out of people who lived in different counties, 50% lived in Pennsylvania.
95% of the 15924 zip code residents lived in the same house 1 year ago. Out of people who lived in different houses, 82% moved from this county. Out of people who lived in different houses, 15% moved from different county within same state.
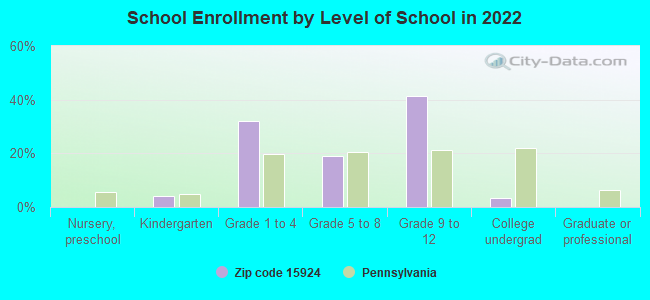
Private vs. public school enrollment:
Students in private schools in grades 1 to 8 (elementary and middle school):
Here:
0.0%
Pennsylvania:
15.7%
Students in private schools in grades 9 to 12 (high school):
Here:
0.0%
Pennsylvania:
13.4%
Students in private undergraduate colleges:
Here:
0.0%
Pennsylvania:
39.8%
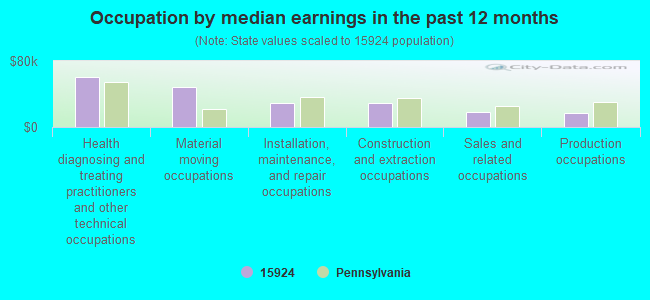
Occupation by median earnings in the past 12 months ($)
61,181Health diagnosing and treating practitioners and other technical occupations
48,855Material moving occupations
29,117Installation, maintenance, and repair occupations
28,486Construction and extraction occupations
18,733Sales and related occupations
16,907Production occupations
Top industries in this zip code by the number of employees in 2005:
Administrative and Support and Waste Management and Remediation Services: Solid Waste Landfill (10-19 employees: 1 establishment)
Mining: Construction Sand and Gravel Mining (10-19: 1)
Health Care and Social Assistance: Homes for the Elderly (5-9: 1, 1-4: 1)
Other Services (except Public Administration): Civic and Social Organizations (5-9: 1)
Utilities: Water Supply and Irrigation Systems (1-4: 1)
Professional, Scientific, and Technical Services: Surveying and Mapping (except Geophysical) Services (1-4: 1)
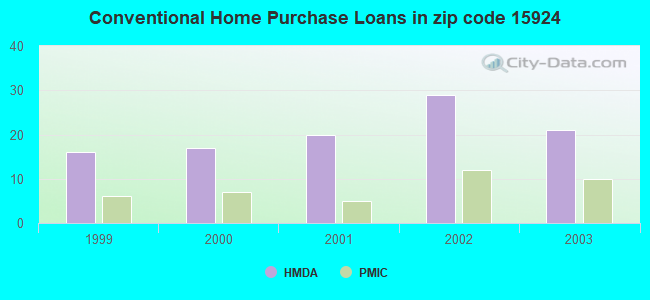
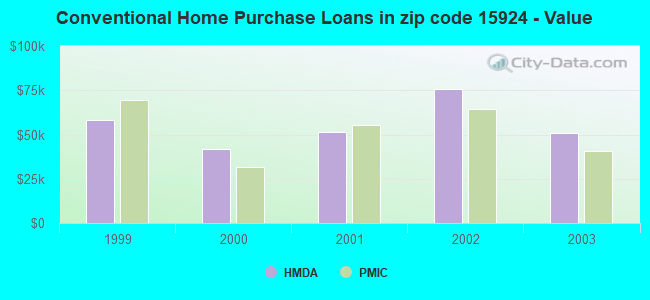
Home Mortgage Disclosure Act Aggregated Statistics For Year 2003 (Based on 2 partial tracts)
A) FHA, FSA/RHS & VA Home Purchase Loans
B) Conventional Home Purchase Loans
C) Refinancings
D) Home Improvement Loans
F) Non-occupant Loans on < 5 Family Dwellings (A B C & D)
Number
Average Value
Number
Average Value
Number
Average Value
Number
Average Value
Number
Average Value
LOANS ORIGINATED
3
$108,633
21
$51,092
80
$65,763
32
$30,961
9
$76,987
APPLICATIONS APPROVED, NOT ACCEPTED
0
$0
1
$49,490
21
$53,271
4
$7,238
0
$0
APPLICATIONS DENIED
2
$91,510
11
$40,833
65
$59,864
12
$29,182
4
$68,868
APPLICATIONS WITHDRAWN
0
$0
6
$58,207
28
$65,833
2
$7,470
1
$11,210
FILES CLOSED FOR INCOMPLETENESS
0
$0
0
$0
5
$70,782
0
$0
0
$0
Aggregated Statistics For Year 2002 (Based on 2 partial tracts)
A) FHA, FSA/RHS & VA Home Purchase Loans
B) Conventional Home Purchase Loans
C) Refinancings
D) Home Improvement Loans
F) Non-occupant Loans on < 5 Family Dwellings (A B C & D)
Number
Average Value
Number
Average Value
Number
Average Value
Number
Average Value
Number
Average Value
LOANS ORIGINATED
2
$44,820
29
$75,702
68
$54,847
28
$22,411
6
$95,248
APPLICATIONS APPROVED, NOT ACCEPTED
0
$0
4
$37,585
23
$72,390
2
$41,555
1
$23,340
APPLICATIONS DENIED
0
$0
13
$56,890
55
$56,571
18
$10,791
2
$14,475
APPLICATIONS WITHDRAWN
0
$0
4
$41,555
19
$71,165
1
$23,340
0
$0
FILES CLOSED FOR INCOMPLETENESS
0
$0
0
$0
4
$82,875
0
$0
0
$0
Aggregated Statistics For Year 2001 (Based on 2 partial tracts)
A) FHA, FSA/RHS & VA Home Purchase Loans
B) Conventional Home Purchase Loans
C) Refinancings
D) Home Improvement Loans
F) Non-occupant Loans on < 5 Family Dwellings (A B C & D)
Number
Average Value
Number
Average Value
Number
Average Value
Number
Average Value
Number
Average Value
LOANS ORIGINATED
12
$57,040
20
$51,405
61
$45,756
39
$19,394
11
$54,160
APPLICATIONS APPROVED, NOT ACCEPTED
0
$0
7
$48,957
28
$65,066
3
$25,213
0
$0
APPLICATIONS DENIED
1
$37,350
7
$34,817
68
$52,911
11
$24,704
5
$17,182
APPLICATIONS WITHDRAWN
1
$14,010
2
$40,155
31
$48,136
0
$0
0
$0
FILES CLOSED FOR INCOMPLETENESS
0
$0
0
$0
7
$48,691
0
$0
0
$0
Aggregated Statistics For Year 2000 (Based on 2 partial tracts)
A) FHA, FSA/RHS & VA Home Purchase Loans
B) Conventional Home Purchase Loans
C) Refinancings
D) Home Improvement Loans
F) Non-occupant Loans on < 5 Family Dwellings (A B C & D)
Number
Average Value
Number
Average Value
Number
Average Value
Number
Average Value
Number
Average Value
LOANS ORIGINATED
7
$48,157
17
$41,801
32
$49,112
31
$12,893
5
$15,688
APPLICATIONS APPROVED, NOT ACCEPTED
1
$28,950
6
$29,415
12
$56,728
4
$32,215
0
$0
APPLICATIONS DENIED
3
$22,723
20
$46,270
37
$37,276
20
$17,042
6
$25,213
APPLICATIONS WITHDRAWN
0
$0
6
$96,803
14
$46,556
4
$21,478
3
$115,170
FILES CLOSED FOR INCOMPLETENESS
0
$0
0
$0
5
$43,516
0
$0
0
$0
Aggregated Statistics For Year 1999 (Based on 1 partial tract)
A) FHA, FSA/RHS & VA Home Purchase Loans
B) Conventional Home Purchase Loans
C) Refinancings
D) Home Improvement Loans
F) Non-occupant Loans on < 5 Family Dwellings (A B C & D)
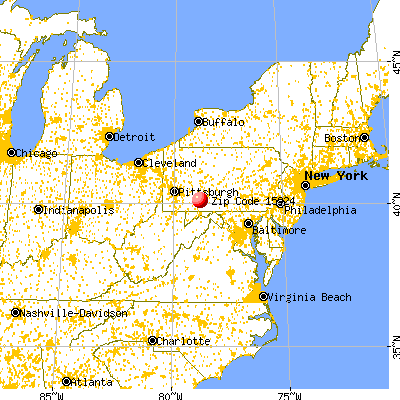


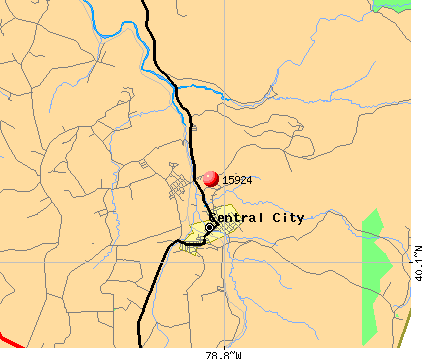 Nearest zip codes: 15559, 15926, 15963, 15936, 15554, 15953.