Estimated zip code population in 2022: 758 Zip code population in 2010: 1,176 Zip code population in 2000: 1,199
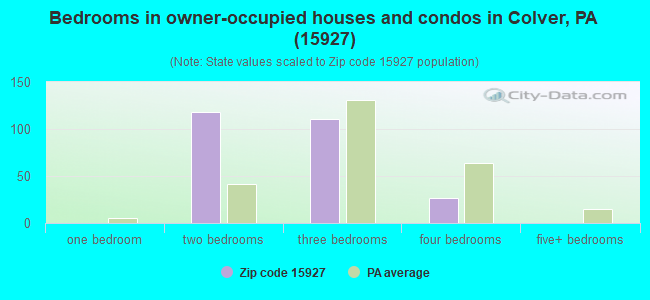
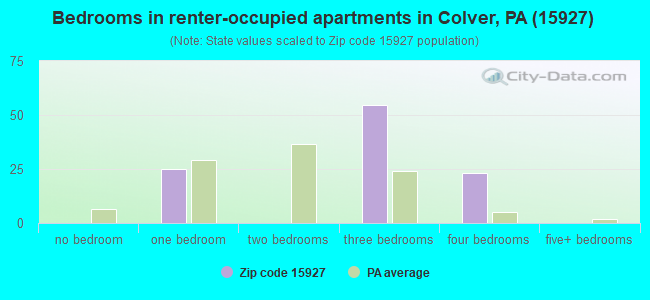
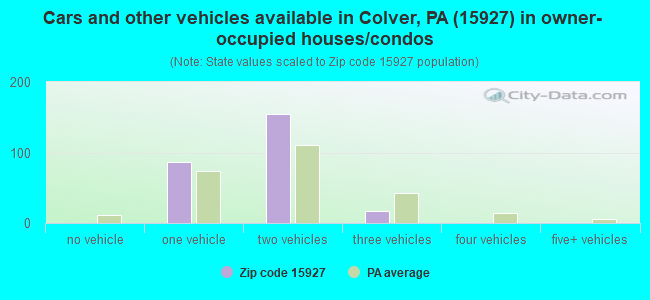
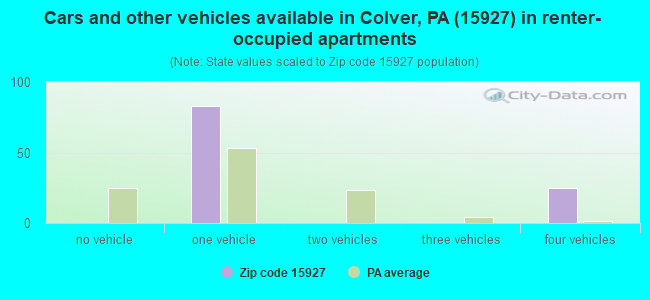
Houses and condos: 411 Renter-occupied apartments: 106
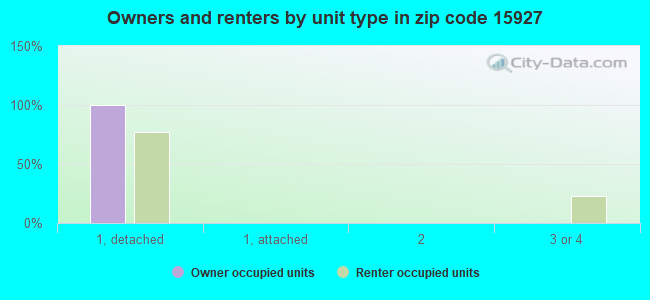
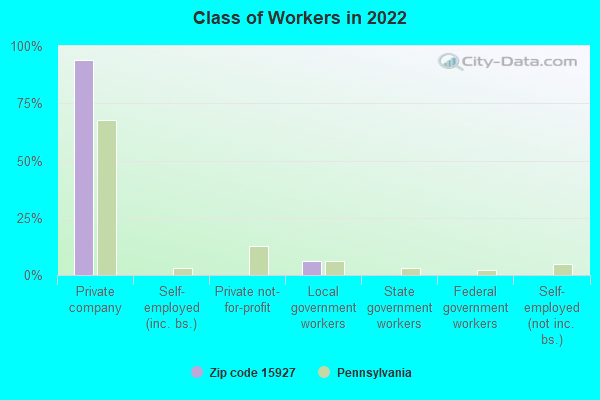
% of renters here:
29%
State:
31%
March 2022 cost of living index in zip code 15927: 91.5 (less than average, U.S. average is 100)
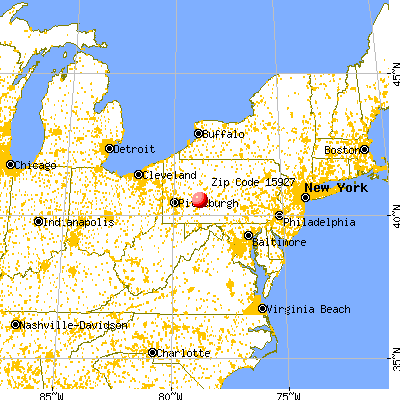
Land area: 4.8 sq. mi. Water area: 0.0 sq. mi.
Population density: 159 people per square mile
(very low).
OSM Map
General Map
Google Map
MSN Map
OSM Map
General Map
Google Map
MSN Map
OSM Map
General Map
Google Map
MSN Map
OSM Map
General Map
Google Map
MSN Map
Please wait while loading the map...
Real estate property taxes paid for housing units in 2022:
This zip code:
1.1% ($860)
Pennsylvania:
1.3% ($3,094)
Median real estate property taxes paid for housing units with mortgages in 2022: $703 (0.7%) Median real estate property taxes paid for housing units with no mortgage in 2022: $979 (1.6%)
Business Search- 14 Million verified businesses
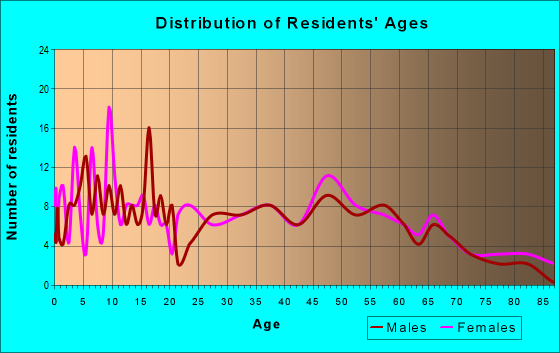
Males: 434
(57.2%)
Females: 324
(42.8%)
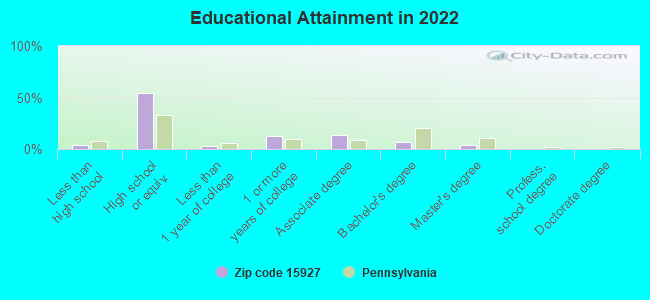
For population 25 years and over in 15927:
High school or higher: 95.6%
Bachelor's degree or higher: 11.5%
Graduate or professional degree: 4.2%
Mean travel time to work (commute): 25.8 minutes
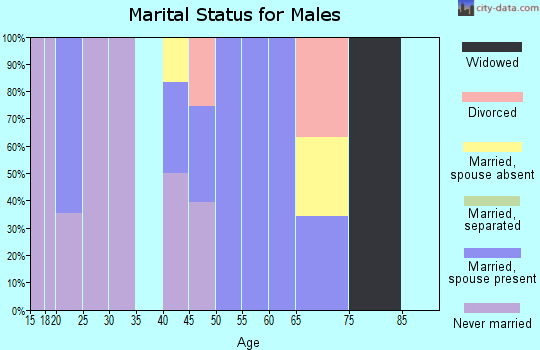
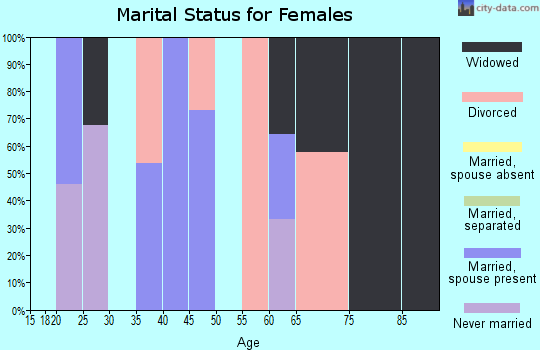
For population 15 years and over in 15927:
Never married: 41.0%
Now married: 47.7%
Separated: 0.0%
Widowed: 2.0%
Divorced: 9.3%
Zip code 15927 compared to state average:
Median household income significantly below state average.
Median house value significantly below state average.
Unemployed percentage significantly below state average.
Black race population percentage significantly below state average.
Hispanic race population percentage significantly below state average.
Median age significantly above state average.
Foreign-born population percentage significantly below state average.
Length of stay since moving in significantly above state average.
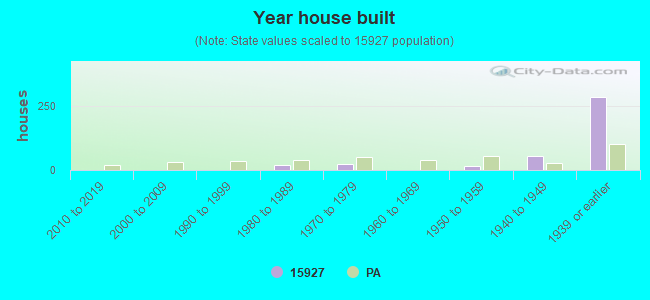
House age above state average.
Percentage of population with a bachelor's degree or higher significantly below state average.
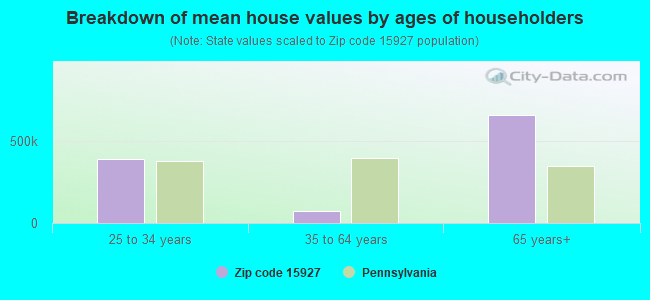
Estimated median house/condo value in 2022: $80,422
15927:
$80,422
Pennsylvania:
$245,500
Median resident age:
This zip code:
55.9 years
Pennsylvania median age:
40.9 years
Average household size:
This zip code:
2.1 people
Pennsylvania:
2.4 people
Averages for the 2020 tax year for zip code 15927, filed in 2021:
Average Adjusted Gross Income (AGI) in 2020: $55,743 (Individual Income Tax Returns)
Here:
$55,743
State:
$75,707
Salary/wage: $43,530 (reported on 88.7% of returns)
Here:
$43,530
State:
$62,806
(% of AGI for various income ranges: 1139.2% for AGIs below $25k, 3350.7% for AGIs $25k-50k, 5880.0% for AGIs $50k-75k, 8740.0% for AGIs $75k-100k, 16135.0% for AGIs $100k-200k)
Taxable interest for individuals: $300 (reported on 24.5% of returns)
This zip code:
$300
Pennsylvania:
$1,633
(% of AGI for various income ranges: 11.7% for AGIs below $25k, 3.3% for AGIs $25k-50k, 12.9% for AGIs $50k-75k, 27.5% for AGIs $100k-200k)
Ordinary dividends: $900 (reported on 11.3% of returns)
Here:
$900
State:
$7,382
(% of AGI for various income ranges: 17.3% for AGIs $25k-50k, 70.0% for AGIs $75k-100k)
Net capital gain/loss in AGI: +$1,225 (reported on 7.5% of returns)
Here:
+$1,225
State:
+$23,522
(% of AGI for various income ranges: 70.0% for AGIs $50k-75k)
Profit/loss from business: +$5,233 (reported on 5.7% of returns)
Here:
+$5,233
State:
+$16,274
(% of AGI for various income ranges: 104.7% for AGIs $25k-50k)
Taxable individual retirement arrangement distribution: $7,350 (reported on 7.5% of returns)
15927:
$7,350
Pennsylvania:
$18,583
(% of AGI for various income ranges: 420.0% for AGIs $50k-75k)
Earned income credit: $2,030 (reported on 18.9% of returns)
Here:
$2,030
State:
$2,100
(% of AGI for various income ranges: 73.3% for AGIs below $25k, 76.7% for AGIs $25k-50k)
Percentage of individuals using paid preparers for their 2020 taxes: 100.0%
Here:
100%
State:
92%
(% for various income ranges: 100.0% for AGIs below $25k, 100.0% for AGIs $25k-50k, 100.0% for AGIs $50k-75k, 100.0% for AGIs $75k-100k, 100.0% for AGIs $100k-200k)
Averages for the 2012 tax year for zip code 15927, filed in 2013:
Average Adjusted Gross Income (AGI) in 2012: $37,489 (Individual Income Tax Returns)
Here:
$37,489
State:
$61,346
Salary/wage: $34,944 (reported on 85.7% of returns)
Here:
$34,944
State:
$51,902
(% of AGI for various income ranges: 70.4% for AGIs below $25k, 83.5% for AGIs $25k-50k, 77.1% for AGIs $50k-75k, 79.5% for AGIs $75k-100k, 86.5% for AGIs $100k-200k)
Taxable interest for individuals: $387 (reported on 26.8% of returns)
This zip code:
$387
Pennsylvania:
$1,588
(% of AGI for various income ranges: 0.6% for AGIs below $25k, 0.4% for AGIs $25k-50k, 0.3% for AGIs $50k-75k, 0.1% for AGIs $75k-100k)
Ordinary dividends: $414 (reported on 12.5% of returns)
Here:
$414
State:
$5,827
Profit/loss from business: +$8,300 (reported on 7.1% of returns)
Here:
+$8,300
State:
+$16,268
Taxable individual retirement arrangement distribution: $7,400 (reported on 7.1% of returns)
15927:
$7,400
Pennsylvania:
$14,550
Total itemized deductions: $15,620 (17% of AGI, reported on 8.9% of returns)
Here:
$15,620
State:
$23,538
Here:
17.0% of AGI
State:
18.4% of AGI
(% of AGI for various income ranges: 7.4% for AGIs $25k-50k, 10.5% for AGIs $100k-200k)
Charity contributions: $1,067 (reported on 5.4% of returns)
Here:
$1,067
State:
$4,025
Taxes paid: $5,580 (reported on 8.9% of returns)
15927:
$5,580
State:
$9,982
(% of AGI for various income ranges: 2.6% for AGIs $25k-50k, 3.8% for AGIs $100k-200k)
Earned income credit: $2,192 (reported on 23.2% of returns)
Here:
$2,192
State:
$2,106
(% of AGI for various income ranges: 6.7% for AGIs below $25k, 1.5% for AGIs $25k-50k)
Percentage of individuals using paid preparers for their 2012 taxes: 51.8%
Here:
52%
State:
53%
(% for various income ranges: 48.0% for AGIs below $25k, 46.7% for AGIs $25k-50k, 62.5% for AGIs $50k-75k, 60.0% for AGIs $75k-100k, 66.7% for AGIs $100k-200k)
Averages for the 2004 tax year for zip code 15927, filed in 2005:
Average Adjusted Gross Income (AGI) in 2004: $29,112 (Individual Income Tax Returns)
Here:
$29,112
State:
$48,049
Salary/wage: $29,376 (reported on 82.5% of returns)
Here:
$29,376
State:
$42,646
(% of AGI for various income ranges: 67.3% for AGIs below $10k, 70.6% for AGIs $10k-25k, 88.4% for AGIs $25k-50k, 84.3% for AGIs $50k-75k, 88.7% for AGIs $75k-100k)
Taxable interest for individuals: $955 (reported on 37.1% of returns)
This zip code:
$955
Pennsylvania:
$1,657
(% of AGI for various income ranges: 4.8% for AGIs below $10k, 4.0% for AGIs $10k-25k, 0.4% for AGIs $25k-50k, 0.3% for AGIs $50k-75k, 0.3% for AGIs $75k-100k)
Taxable dividends: $534 (reported on 18.9% of returns)
Here:
$534
State:
$3,566
(% of AGI for various income ranges: 0.5% for AGIs below $10k, 0.8% for AGIs $10k-25k, 0.2% for AGIs $25k-50k, 0.4% for AGIs $50k-75k, 0.0% for AGIs $75k-100k)
Net capital gain/loss: +$316 (reported on 7.0% of returns)
Here:
+$316
State:
+$9,716
Profit/loss from business: +$8,660 (reported on 8.6% of returns)
Here:
+$8,660
State:
+$14,267
Total itemized deductions: $11,000 (19% of AGI, reported on 9.0% of returns)
Here:
$11,000
State:
$18,804
Here:
19.1% of AGI
State:
19.5% of AGI
Charity contributions deductions: $1,459 (3% of AGI, reported on 6.8% of returns)
Here:
$1,459
State:
$3,337
Here:
2.5% of AGI
State:
3.3% of AGI
Total tax: $3,320 (reported on 64.3% of returns)
15927:
$3,320
State:
$8,008
(% of AGI for various income ranges: 0.8% for AGIs below $10k, 4.1% for AGIs $10k-25k, 5.8% for AGIs $25k-50k, 8.2% for AGIs $50k-75k, 12.9% for AGIs $75k-100k)
Earned income credit: $1,746 (reported on 22.4% of returns)
Here:
$1,746
State:
$1,643
Percentage of individuals using paid preparers for their 2004 taxes: 53.5%
Here:
53%
State:
56%
(% for various income ranges: 49.6% for AGIs below $10k, 55.7% for AGIs $10k-25k, 50.4% for AGIs $25k-50k, 58.7% for AGIs $50k-75k, 60.0% for AGIs $75k-100k)
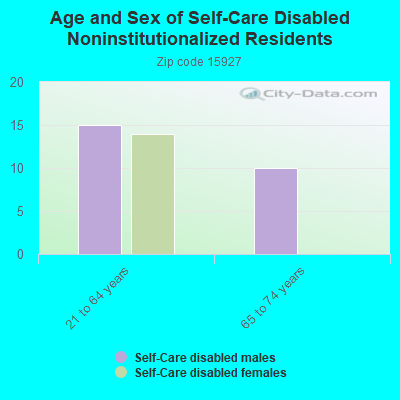
In group quarters: 11 (-1 institutionalized population)
Size of family households: 86 2-persons, 93 3-persons, 23 4-persons
Size of nonfamily households: 157 1-person
23 married couples with children.
26 single-parent households (26 women).
99.2% of residents of 15927 zip code speak English at home.
Foreign born population: 0 (0.0%)
:
0.0%
Whole state:
7.5%
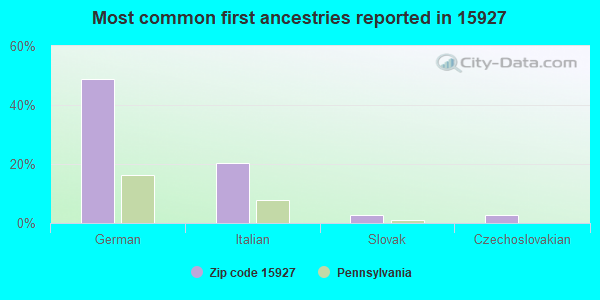
49%German
20%Italian
3%Slovak
3%Czechoslovakian
Facilities with environmental interests located in this zip code:
AURANDTS RESTORATION (89 REESE AVE in COLVER, PA)
Conditionally Exempt Small Quantity Generators, less than 100 kg/month of hazardous waste (Resource Conservation and Recovery Act (tracking hazardous waste)) - notification
Housing units lacking complete plumbing facilities: 10.8% Housing units lacking complete kitchen facilities: 11.3%
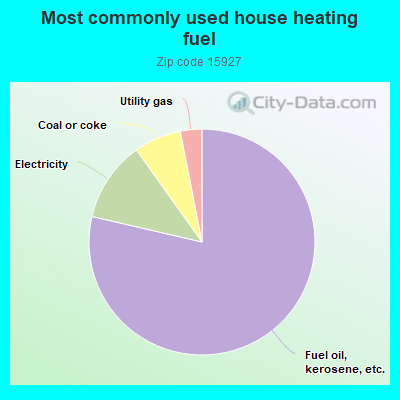
79.1%Fuel oil, kerosene, etc.
11.6%Electricity
6.8%Coal or coke
3.1%Utility gas
Population in 1990: 1,531.
Place of birth for U.S.-born residents:
This state: 643
Midwest: 35
South: 43
West: 34
71% of the 15927 zip code residents lived in the same house 5 years ago. Out of people who lived in different houses, 81% lived in this county. Out of people who lived in different counties, 50% lived in Pennsylvania.
97% of the 15927 zip code residents lived in the same house 1 year ago. Out of people who lived in different houses, 105% moved from this county.
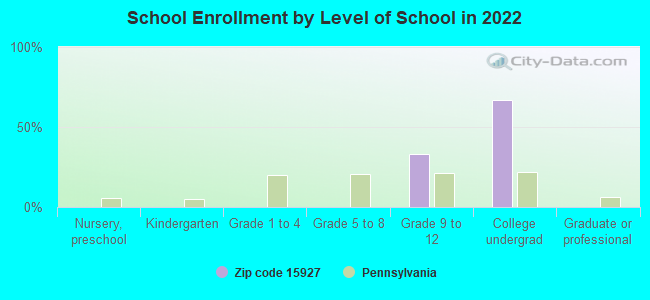
Students in private schools in grades 9 to 12 (high school):
Here:
0.0%
Pennsylvania:
13.4%
Students in private undergraduate colleges:
Here:
0.0%
Pennsylvania:
39.8%
Top industries in this zip code by the number of employees in 2005:
Health Care and Social Assistance: Child Day Care Services (20-49 employees: 1 establishment)
Other Services (except Public Administration): Civic and Social Organizations (5-9: 2, 1-4: 1)
Health Care and Social Assistance: Home Health Care Services (5-9: 1)
Other Services (except Public Administration): Religious Organizations (1-4: 2)
Professional, Scientific, and Technical Services: Veterinary Services (1-4: 1)
Construction: Plumbing, Heating, and Air-Conditioning Contractors (1-4: 1)
Construction: Residential Remodelers (1-4: 1)
Construction: New Single-Family Housing Construction (except Operative Builders) (1-4: 1)
People in group quarters in 2010:
5 people in group homes intended for adults
People in group quarters in 2000:
6 people in homes for the mentally retarded
Home Mortgage Disclosure Act Aggregated Statistics For Year 2009 (Based on 2 partial tracts)
A) FHA, FSA/RHS & VA Home Purchase Loans
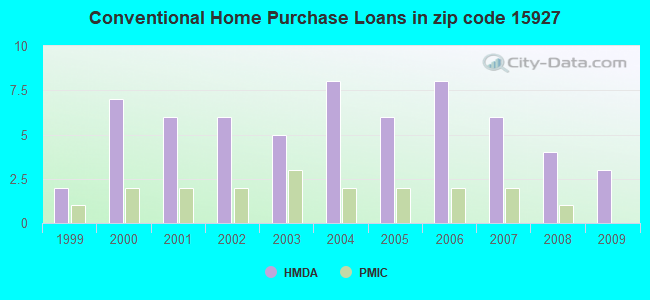
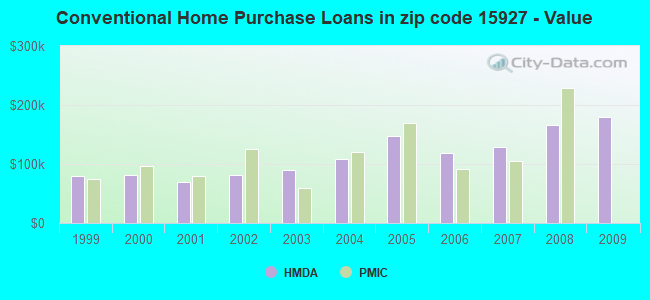
B) Conventional Home Purchase Loans
C) Refinancings
D) Home Improvement Loans
Number
Average Value
Number
Average Value
Number
Average Value
Number
Average Value
LOANS ORIGINATED
2
$84,435
3
$179,203
11
$125,001
6
$31,863
APPLICATIONS APPROVED, NOT ACCEPTED
0
$0
0
$0
1
$66,270
0
$0
APPLICATIONS DENIED
0
$0
1
$28,860
5
$114,816
1
$17,770
APPLICATIONS WITHDRAWN
0
$0
1
$72,680
2
$188,575
0
$0
FILES CLOSED FOR INCOMPLETENESS
0
$0
0
$0
0
$0
0
$0
Aggregated Statistics For Year 2008 (Based on 2 partial tracts)
A) FHA, FSA/RHS & VA Home Purchase Loans
B) Conventional Home Purchase Loans
C) Refinancings
D) Home Improvement Loans
F) Non-occupant Loans on < 5 Family Dwellings (A B C & D)
G) Loans On Manufactured Home Dwelling (A B C & D)
Number
Average Value
Number
Average Value
Number
Average Value
Number
Average Value
Number
Average Value
Number
Average Value
LOANS ORIGINATED
2
$80,495
4
$165,262
7
$100,066
7
$35,519
1
$61,460
1
$86,840
APPLICATIONS APPROVED, NOT ACCEPTED
0
$0
1
$148,300
1
$151,100
1
$17,770
0
$0
0
$0
APPLICATIONS DENIED
1
$32,330
1
$48,900
10
$121,242
5
$48,096
1
$17,640
1
$58,250
APPLICATIONS WITHDRAWN
0
$0
1
$41,280
1
$167,130
0
$0
0
$0
0
$0
FILES CLOSED FOR INCOMPLETENESS
0
$0
0
$0
1
$42,890
0
$0
0
$0
0
$0
Aggregated Statistics For Year 2007 (Based on 2 partial tracts)
A) FHA, FSA/RHS & VA Home Purchase Loans
B) Conventional Home Purchase Loans
C) Refinancings
D) Home Improvement Loans
F) Non-occupant Loans on < 5 Family Dwellings (A B C & D)
G) Loans On Manufactured Home Dwelling (A B C & D)
Number
Average Value
Number
Average Value
Number
Average Value
Number
Average Value
Number
Average Value
Number
Average Value
LOANS ORIGINATED
1
$55,980
6
$128,033
9
$100,467
9
$34,380
1
$74,820
1
$55,710
APPLICATIONS APPROVED, NOT ACCEPTED
0
$0
1
$110,620
2
$106,345
0
$0
0
$0
0
$0
APPLICATIONS DENIED
0
$0
2
$106,345
11
$116,341
3
$44,133
1
$56,510
1
$84,440
APPLICATIONS WITHDRAWN
0
$0
1
$105,810
2
$72,545
1
$34,200
0
$0
0
$0
FILES CLOSED FOR INCOMPLETENESS
0
$0
0
$0
1
$176,350
0
$0
0
$0
0
$0
Aggregated Statistics For Year 2006 (Based on 2 partial tracts)
A) FHA, FSA/RHS & VA Home Purchase Loans
B) Conventional Home Purchase Loans
C) Refinancings
D) Home Improvement Loans
G) Loans On Manufactured Home Dwelling (A B C & D)
Number
Average Value
Number
Average Value
Number
Average Value
Number
Average Value
Number
Average Value
LOANS ORIGINATED
1
$50,100
8
$118,202
11
$89,743
5
$27,896
0
$0
APPLICATIONS APPROVED, NOT ACCEPTED
0
$0
1
$70,810
2
$123,445
1
$24,720
0
$0
APPLICATIONS DENIED
0
$0
3
$82,343
8
$86,706
3
$39,947
1
$71,610
APPLICATIONS WITHDRAWN
0
$0
1
$137,610
3
$146,023
0
$0
0
$0
FILES CLOSED FOR INCOMPLETENESS
0
$0
0
$0
1
$140,150
0
$0
0
$0
Aggregated Statistics For Year 2005 (Based on 2 partial tracts)
A) FHA, FSA/RHS & VA Home Purchase Loans
B) Conventional Home Purchase Loans
C) Refinancings
D) Home Improvement Loans
F) Non-occupant Loans on < 5 Family Dwellings (A B C & D)
G) Loans On Manufactured Home Dwelling (A B C & D)
Number
Average Value
Number
Average Value
Number
Average Value
Number
Average Value
Number
Average Value
Number
Average Value
LOANS ORIGINATED
1
$52,240
6
$147,428
11
$73,213
9
$22,400
1
$54,380
1
$45,290
APPLICATIONS APPROVED, NOT ACCEPTED
0
$0
0
$0
2
$58,050
1
$24,580
0
$0
0
$0
APPLICATIONS DENIED
0
$0
1
$147,900
9
$74,964
1
$66,400
0
$0
1
$77,090
APPLICATIONS WITHDRAWN
0
$0
1
$111,960
3
$97,527
0
$0
0
$0
0
$0
FILES CLOSED FOR INCOMPLETENESS
0
$0
0
$0
1
$88,980
0
$0
0
$0
0
$0
Aggregated Statistics For Year 2004 (Based on 2 partial tracts)
A) FHA, FSA/RHS & VA Home Purchase Loans
B) Conventional Home Purchase Loans
C) Refinancings
D) Home Improvement Loans
G) Loans On Manufactured Home Dwelling (A B C & D)
Number
Average Value
Number
Average Value
Number
Average Value
Number
Average Value
Number
Average Value
LOANS ORIGINATED
1
$31,000
8
$109,085
15
$78,183
7
$29,736
1
$44,360
APPLICATIONS APPROVED, NOT ACCEPTED
0
$0
1
$93,250
3
$94,767
1
$23,510
0
$0
APPLICATIONS DENIED
0
$0
2
$80,495
8
$81,396
1
$26,450
1
$70,670
APPLICATIONS WITHDRAWN
0
$0
1
$120,370
7
$84,436
1
$35,400
0
$0
FILES CLOSED FOR INCOMPLETENESS
0
$0
0
$0
2
$81,430
0
$0
0
$0
Aggregated Statistics For Year 2003 (Based on 2 partial tracts)
B) Conventional Home Purchase Loans
C) Refinancings
D) Home Improvement Loans
Number
Average Value
Number
Average Value
Number
Average Value
LOANS ORIGINATED
5
$89,004
24
$78,061
7
$27,350
APPLICATIONS APPROVED, NOT ACCEPTED
1
$25,650
3
$54,910
1
$34,200
APPLICATIONS DENIED
2
$58,250
8
$69,589
2
$18,370
APPLICATIONS WITHDRAWN
1
$57,580
4
$67,235
1
$29,120
FILES CLOSED FOR INCOMPLETENESS
0
$0
1
$56,510
0
$0
Aggregated Statistics For Year 2002 (Based on 2 partial tracts)
A) FHA, FSA/RHS & VA Home Purchase Loans
B) Conventional Home Purchase Loans
C) Refinancings
D) Home Improvement Loans
Number
Average Value
Number
Average Value
Number
Average Value
Number
Average Value
LOANS ORIGINATED
1
$66,270
6
$82,120
18
$73,339
6
$26,497
APPLICATIONS APPROVED, NOT ACCEPTED
0
$0
1
$30,460
2
$65,730
0
$0
APPLICATIONS DENIED
0
$0
1
$60,790
6
$59,297
1
$26,320
APPLICATIONS WITHDRAWN
0
$0
0
$0
4
$52,338
1
$10,420
FILES CLOSED FOR INCOMPLETENESS
0
$0
0
$0
1
$52,640
0
$0
Aggregated Statistics For Year 2001 (Based on 2 partial tracts)
B) Conventional Home Purchase Loans
C) Refinancings
D) Home Improvement Loans
Number
Average Value
Number
Average Value
Number
Average Value
LOANS ORIGINATED
6
$69,695
12
$70,307
9
$19,164
APPLICATIONS APPROVED, NOT ACCEPTED
1
$25,920
3
$62,303
0
$0
APPLICATIONS DENIED
0
$0
5
$48,364
2
$15,500
APPLICATIONS WITHDRAWN
0
$0
4
$64,060
1
$24,720
FILES CLOSED FOR INCOMPLETENESS
0
$0
1
$24,980
0
$0
Aggregated Statistics For Year 2000 (Based on 2 partial tracts)
B) Conventional Home Purchase Loans
C) Refinancings
D) Home Improvement Loans
F) Non-occupant Loans on < 5 Family Dwellings (A B C & D)
Number
Average Value
Number
Average Value
Number
Average Value
Number
Average Value
LOANS ORIGINATED
7
$80,866
5
$54,028
7
$16,490
1
$86,310
APPLICATIONS APPROVED, NOT ACCEPTED
1
$40,350
1
$100,070
0
$0
0
$0
APPLICATIONS DENIED
3
$36,697
3
$54,330
2
$14,160
0
$0
APPLICATIONS WITHDRAWN
0
$0
1
$68,540
1
$20,980
0
$0
FILES CLOSED FOR INCOMPLETENESS
0
$0
0
$0
0
$0
0
$0
Aggregated Statistics For Year 1999 (Based on 1 partial tract)


 Nearest zip codes: 15931, 15948, 15737, 15762, 15722, 15943.