Estimated zip code population in 2022: 3,144 Zip code population in 2010: 3,472 Zip code population in 2000: 3,487
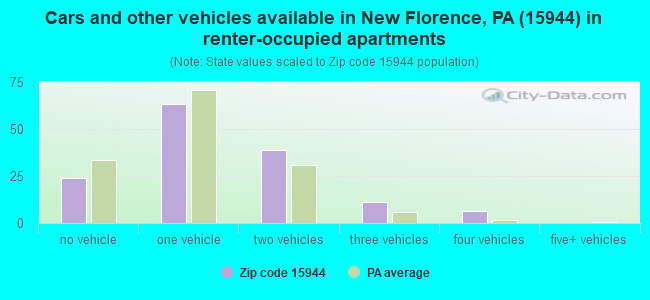
Houses and condos: 1,499 Renter-occupied apartments: 143
% of renters here:
12%
State:
31%
March 2022 cost of living index in zip code 15944: 87.4 (less than average, U.S. average is 100)
Land area: 65.9 sq. mi. Water area: 0.4 sq. mi.
Population density: 48 people per square mile
(very low).
OSM Map
General Map
Google Map
MSN Map
OSM Map
General Map
Google Map
MSN Map
OSM Map
General Map
Google Map
MSN Map
OSM Map
General Map
Google Map
MSN Map
Please wait while loading the map...
Real estate property taxes paid for housing units in 2022:
This zip code:
1.3% ($2,212)
Pennsylvania:
1.3% ($3,094)
Median real estate property taxes paid for housing units with mortgages in 2022: $2,522 (1.2%) Median real estate property taxes paid for housing units with no mortgage in 2022: $1,947 (1.6%)
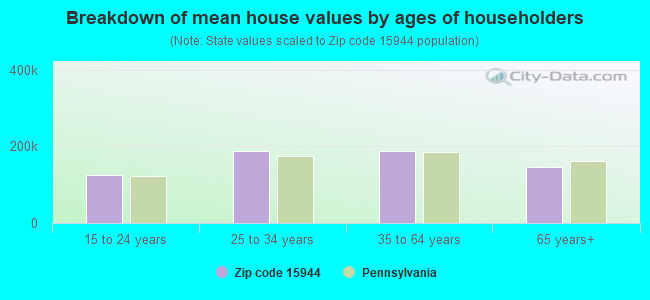
Estimated median house/condo value in 2022: $171,590
15944:
$171,590
Pennsylvania:
$245,500
According to our research of Pennsylvania and other state lists, there were 2 registered sex offenders living in 15944 zip code as of May 20, 2024. The ratio of all residents to sex offenders in zip code 15944 is 1,659 to 1. The ratio of registered sex offenders to all residents in this zip code is much lower than the state average.
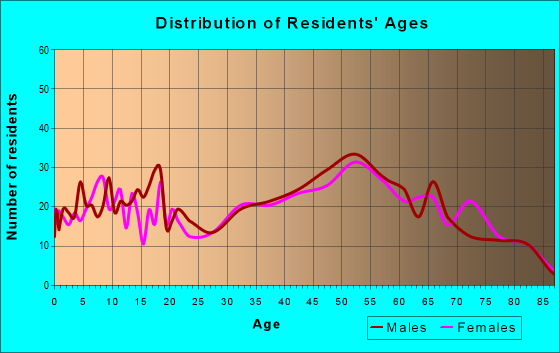
Median resident age:
This zip code:
41.6 years
Pennsylvania median age:
40.9 years
Average household size:
This zip code:
2.6 people
Pennsylvania:
2.4 people
Averages for the 2020 tax year for zip code 15944, filed in 2021:
Average Adjusted Gross Income (AGI) in 2020: $55,566 (Individual Income Tax Returns)
Here:
$55,566
State:
$75,707
Salary/wage: $49,569 (reported on 76.7% of returns)
Here:
$49,569
State:
$62,806
(% of AGI for various income ranges: 944.1% for AGIs below $25k, 3400.4% for AGIs $25k-50k, 5531.1% for AGIs $50k-75k, 9026.4% for AGIs $75k-100k, 12928.5% for AGIs $100k-200k)
Taxable interest for individuals: $842 (reported on 32.0% of returns)
This zip code:
$842
Pennsylvania:
$1,633
(% of AGI for various income ranges: 23.5% for AGIs below $25k, 12.5% for AGIs $25k-50k, 48.9% for AGIs $50k-75k, 31.4% for AGIs $75k-100k, 71.5% for AGIs $100k-200k)
Ordinary dividends: $3,828 (reported on 19.3% of returns)
Here:
$3,828
State:
$7,382
(% of AGI for various income ranges: 22.9% for AGIs below $25k, 29.6% for AGIs $25k-50k, 71.7% for AGIs $50k-75k, 13.6% for AGIs $75k-100k, 302.3% for AGIs $100k-200k)
Net capital gain/loss in AGI: +$6,155 (reported on 13.3% of returns)
Here:
+$6,155
State:
+$23,522
(% of AGI for various income ranges: 3.5% for AGIs below $25k, 31.8% for AGIs $25k-50k, 71.1% for AGIs $50k-75k, 29.3% for AGIs $75k-100k, 739.2% for AGIs $100k-200k)
Profit/loss from business: +$7,453 (reported on 11.3% of returns)
Here:
+$7,453
State:
+$16,274
(% of AGI for various income ranges: 43.8% for AGIs below $25k, 40.0% for AGIs $25k-50k, 195.6% for AGIs $50k-75k, 285.0% for AGIs $75k-100k, 196.2% for AGIs $100k-200k)
Taxable individual retirement arrangement distribution: $10,383 (reported on 12.0% of returns)
15944:
$10,383
Pennsylvania:
$18,583
(% of AGI for various income ranges: 72.1% for AGIs below $25k, 71.4% for AGIs $25k-50k, 201.7% for AGIs $50k-75k, 345.0% for AGIs $75k-100k, 444.6% for AGIs $100k-200k)
Total itemized deductions: $32,500 (reported on 2.0% of returns)
Here:
$32,500
State:
$34,850
(% of AGI for various income ranges: 750.0% for AGIs $100k-200k)
Taxes paid: $7,333 (reported on 2.0% of returns)
15944:
$7,333
State:
$8,200
(% of AGI for various income ranges: 169.2% for AGIs $100k-200k)
Earned income credit: $2,026 (reported on 12.7% of returns)
Here:
$2,026
State:
$2,100
(% of AGI for various income ranges: 69.1% for AGIs below $25k, 53.6% for AGIs $25k-50k)
Percentage of individuals using paid preparers for their 2020 taxes: 92.0%
Here:
92%
State:
92%
(% for various income ranges: 92.0% for AGIs below $25k, 91.9% for AGIs $25k-50k, 91.3% for AGIs $50k-75k, 89.5% for AGIs $75k-100k, 94.4% for AGIs $100k-200k, 100.0% for AGIs over 200k)
Averages for the 2012 tax year for zip code 15944, filed in 2013:
Average Adjusted Gross Income (AGI) in 2012: $46,593 (Individual Income Tax Returns)
Here:
$46,593
State:
$61,346
Salary/wage: $42,961 (reported on 78.8% of returns)
Here:
$42,961
State:
$51,902
(% of AGI for various income ranges: 60.5% for AGIs below $25k, 72.7% for AGIs $25k-50k, 77.5% for AGIs $50k-75k, 83.8% for AGIs $75k-100k, 67.9% for AGIs $100k-200k)
Taxable interest for individuals: $860 (reported on 37.7% of returns)
This zip code:
$860
Pennsylvania:
$1,588
(% of AGI for various income ranges: 2.2% for AGIs below $25k, 0.7% for AGIs $25k-50k, 0.6% for AGIs $50k-75k, 0.3% for AGIs $75k-100k, 0.4% for AGIs $100k-200k)
Ordinary dividends: $1,949 (reported on 23.2% of returns)
Here:
$1,949
State:
$5,827
(% of AGI for various income ranges: 2.0% for AGIs below $25k, 0.5% for AGIs $25k-50k, 1.1% for AGIs $50k-75k, 0.3% for AGIs $75k-100k, 1.1% for AGIs $100k-200k)
Net capital gain/loss in AGI: +$647 (reported on 11.3% of returns)
Here:
+$647
State:
+$14,495
(% of AGI for various income ranges: 0.5% for AGIs $50k-75k, 0.2% for AGIs $100k-200k)
Profit/loss from business: +$8,889 (reported on 11.9% of returns)
Here:
+$8,889
State:
+$16,268
(% of AGI for various income ranges: 3.7% for AGIs below $25k, 3.9% for AGIs $25k-50k, 2.2% for AGIs $50k-75k, 0.8% for AGIs $75k-100k, 1.7% for AGIs $100k-200k)
Taxable individual retirement arrangement distribution: $7,988 (reported on 11.3% of returns)
15944:
$7,988
Pennsylvania:
$14,550
(% of AGI for various income ranges: 4.0% for AGIs below $25k, 2.0% for AGIs $25k-50k, 2.9% for AGIs $50k-75k, 1.5% for AGIs $100k-200k)
Total itemized deductions: $18,584 (18% of AGI, reported on 16.6% of returns)
Here:
$18,584
State:
$23,538
Here:
17.7% of AGI
State:
18.4% of AGI
(% of AGI for various income ranges: 7.0% for AGIs $25k-50k, 5.8% for AGIs $50k-75k, 6.1% for AGIs $75k-100k, 9.3% for AGIs $100k-200k)
Charity contributions: $2,894 (reported on 11.3% of returns)
Here:
$2,894
State:
$4,025
(% of AGI for various income ranges: 1.0% for AGIs below $25k, 0.5% for AGIs $50k-75k, 0.8% for AGIs $75k-100k, 1.1% for AGIs $100k-200k)
Taxes paid: $6,800 (reported on 15.9% of returns)
15944:
$6,800
State:
$9,982
(% of AGI for various income ranges: 1.3% for AGIs $25k-50k, 1.8% for AGIs $50k-75k, 2.4% for AGIs $75k-100k, 3.9% for AGIs $100k-200k)
Earned income credit: $2,095 (reported on 13.9% of returns)
Here:
$2,095
State:
$2,106
(% of AGI for various income ranges: 4.4% for AGIs below $25k, 1.0% for AGIs $25k-50k)
Percentage of individuals using paid preparers for their 2012 taxes: 57.0%
Here:
57%
State:
53%
(% for various income ranges: 54.0% for AGIs below $25k, 55.9% for AGIs $25k-50k, 57.7% for AGIs $50k-75k, 61.5% for AGIs $75k-100k, 66.7% for AGIs $100k-200k)
Averages for the 2004 tax year for zip code 15944, filed in 2005:
Average Adjusted Gross Income (AGI) in 2004: $35,348 (Individual Income Tax Returns)
Here:
$35,348
State:
$48,049
Salary/wage: $33,242 (reported on 84.0% of returns)
Here:
$33,242
State:
$42,646
(% of AGI for various income ranges: 79.6% for AGIs below $10k, 70.6% for AGIs $10k-25k, 80.1% for AGIs $25k-50k, 82.6% for AGIs $50k-75k, 87.7% for AGIs $75k-100k, 65.7% for AGIs over 100k)
Taxable interest for individuals: $1,120 (reported on 46.2% of returns)
This zip code:
$1,120
Pennsylvania:
$1,657
(% of AGI for various income ranges: 4.8% for AGIs below $10k, 3.2% for AGIs $10k-25k, 1.1% for AGIs $25k-50k, 1.4% for AGIs $50k-75k, 0.8% for AGIs $75k-100k, 0.7% for AGIs over 100k)
Taxable dividends: $1,195 (reported on 26.1% of returns)
Here:
$1,195
State:
$3,566
(% of AGI for various income ranges: 2.3% for AGIs below $10k, 1.1% for AGIs $10k-25k, 0.4% for AGIs $25k-50k, 0.4% for AGIs $50k-75k, 0.6% for AGIs $75k-100k, 2.7% for AGIs over 100k)
Net capital gain/loss: +$2,019 (reported on 13.9% of returns)
Here:
+$2,019
State:
+$9,716
(% of AGI for various income ranges: -1.9% for AGIs below $10k, 1.4% for AGIs $10k-25k, -0.1% for AGIs $25k-50k, 0.3% for AGIs $50k-75k, 1.6% for AGIs $75k-100k, 2.7% for AGIs over 100k)
Profit/loss from business: +$6,107 (reported on 12.2% of returns)
Here:
+$6,107
State:
+$14,267
(% of AGI for various income ranges: 0.6% for AGIs below $10k, 2.5% for AGIs $10k-25k, 3.5% for AGIs $25k-50k, 2.7% for AGIs $50k-75k, -0.1% for AGIs $75k-100k, 0.9% for AGIs over 100k)
IRA payment deduction: $2,950 (reported on 3.9% of returns)
15944:
$2,950
Pennsylvania:
$2,903
(% of AGI for various income ranges: 0.4% for AGIs $10k-25k, 0.4% for AGIs $25k-50k, 0.3% for AGIs $50k-75k, 0.5% for AGIs $75k-100k)
Total itemized deductions: $13,915 (22% of AGI, reported on 20.1% of returns)
Here:
$13,915
State:
$18,804
Here:
21.8% of AGI
State:
19.5% of AGI
(% of AGI for various income ranges: 4.8% for AGIs below $10k, 4.3% for AGIs $10k-25k, 7.8% for AGIs $25k-50k, 9.9% for AGIs $50k-75k, 7.7% for AGIs $75k-100k, 8.3% for AGIs over 100k)
Charity contributions deductions: $2,517 (4% of AGI, reported on 17.4% of returns)
Here:
$2,517
State:
$3,337
Here:
3.9% of AGI
State:
3.3% of AGI
(% of AGI for various income ranges: 1.0% for AGIs $10k-25k, 1.3% for AGIs $25k-50k, 1.3% for AGIs $50k-75k, 0.9% for AGIs $75k-100k, 2.0% for AGIs over 100k)
Total tax: $4,193 (reported on 74.5% of returns)
15944:
$4,193
State:
$8,008
(% of AGI for various income ranges: 1.9% for AGIs below $10k, 3.9% for AGIs $10k-25k, 6.4% for AGIs $25k-50k, 8.6% for AGIs $50k-75k, 10.9% for AGIs $75k-100k, 17.7% for AGIs over 100k)
Earned income credit: $1,500 (reported on 14.0% of returns)
Here:
$1,500
State:
$1,643
Percentage of individuals using paid preparers for their 2004 taxes: 58.7%
Here:
59%
State:
56%
(% for various income ranges: 56.8% for AGIs below $10k, 58.0% for AGIs $10k-25k, 60.7% for AGIs $25k-50k, 58.6% for AGIs $50k-75k, 56.2% for AGIs $75k-100k, 67.4% for AGIs over 100k)
Household received Food Stamps/SNAP in the past 12 months: 162 Household did not receive Food Stamps/SNAP in the past 12 months: 1,043
Women who had a birth in the past 12 months: 76 (74 now married, 6 unmarried) Women who did not have a birth in the past 12 months: 500 (260 now married, 238 unmarried)
Housing units in zip code 15944 with a mortgage: 489 (111 second mortgage, 101 both second mortgage and home equity loan) Houses without a mortgage: 35
Median monthly owner costs for units with a mortgage: $1,425 Median monthly owner costs for units without a mortgage: $529
Residents with income below the poverty level in 2022:
This zip code:
8.8%
Whole state:
11.8%
Residents with income below 50% of the poverty level in 2022:
This zip code:
3.9%
Whole state:
6.1%
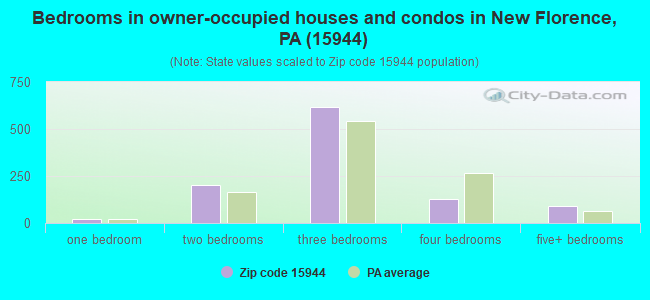
Median number of rooms in houses and condos:
Here:
6.6
State:
6.8
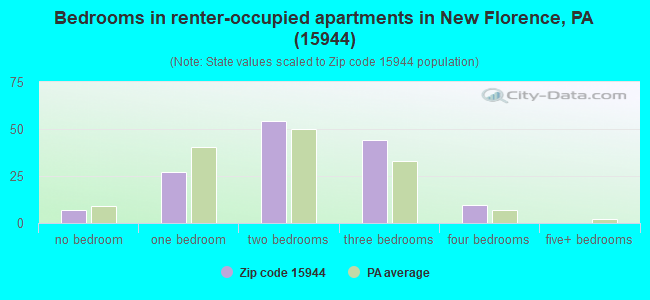
Median number of rooms in apartments:
Here:
5.0
State:
4.3
Notable locations in this zip code not listed on our city pages
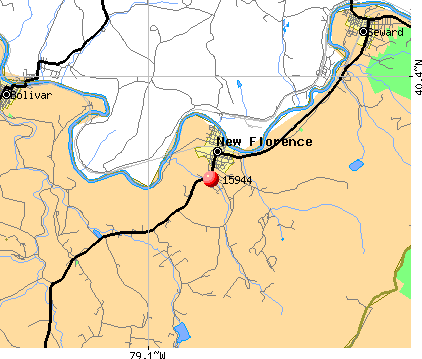
Notable locations in zip code 15944: Camp Twin Echo (A), Clyde Volunteer Fire Company (B), New Florence Volunteer Fire Department (C), Fairfield Township Volunteer Fire Company 1 (D). Display/hide their locations on the map
Lakes and reservoirs: Echo Lake (A), Hedges Lakes (B), Tubmill Reservoir (C), New Florence Reservoir (D), Holiday Lake (E), Sugar Run Reservoir (F), High Ridge Reservoir (G). Display/hide their locations on the map
Streams, rivers, and creeks: West Branch Richards Run (A), Sugar Run (B), East Branch Richards Run (C), Shannon Run (D), Lick Run (E), Powdermill Run (F), Poplar Run (G), Baldwin Creek (H). Display/hide their locations on the map
509 married couples with children.
196 single-parent households (162 men, 34 women).
98.9% of residents of 15944 zip code speak English at home.
0.5% of residents speak Spanish at home (100% very well).
0.1% of residents speak Asian or Pacific Island language at home (100% well).
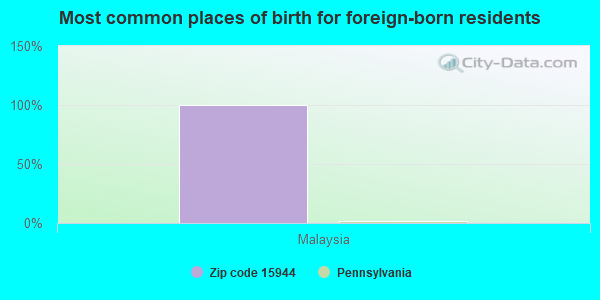
Foreign born population: 3 (0.1%) (0.0% of them are naturalized citizens)
:
0.1%
Whole state:
7.5%
100%Malaysia
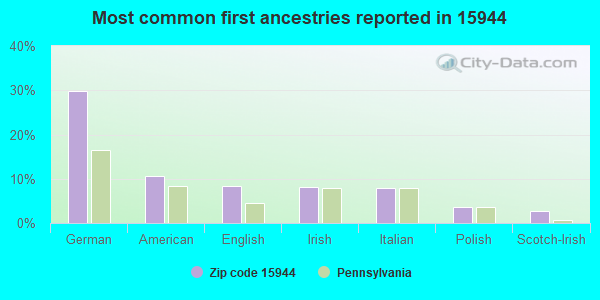
30%German
11%American
8%English
8%Irish
8%Italian
4%Polish
3%Scotch-Irish
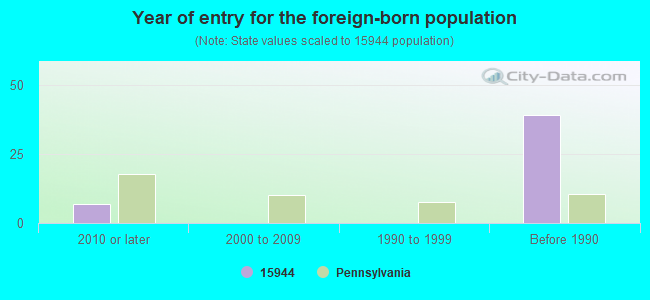
Year of entry for the foreign-born population
72010 or later
02000 to 2009
01990 to 1999
39Before 1990
Facilities with environmental interests located in this zip code:
BROWNIES CUSTOM PAINTING (140 LIGONIER ST in NEW FLORENCE, PA)
Conditionally Exempt Small Quantity Generators, less than 100 kg/month of hazardous waste (Resource Conservation and Recovery Act (tracking hazardous waste)) - notification Organizations: BROWN ALAN M (CONTACT/OWNER)
Housing units lacking complete plumbing facilities: 3.6% Housing units lacking complete kitchen facilities: 4.9%
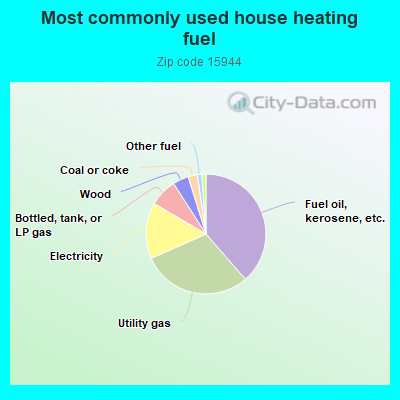
38.8%Fuel oil, kerosene, etc.
29.9%Utility gas
15.2%Electricity
7.5%Bottled, tank, or LP gas
4.3%Wood
2.5%Coal or coke
1.2%Other fuel
1.1%No fuel used
Population in 1990: 3,949.
Place of birth for U.S.-born residents:
This state: 2,644
Northeast: 112
Midwest: 38
South: 210
West: 72
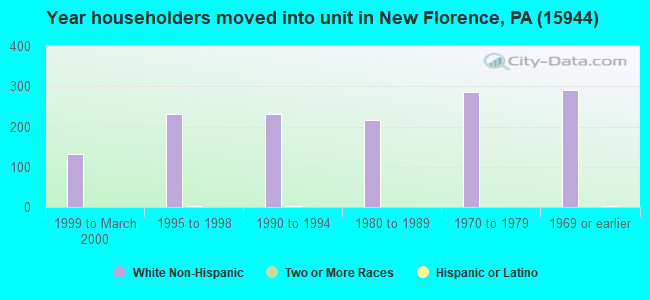
78% of the 15944 zip code residents lived in the same house 5 years ago. Out of people who lived in different houses, 56% lived in this county. Out of people who lived in different counties, 50% lived in Pennsylvania.
89% of the 15944 zip code residents lived in the same house 1 year ago. Out of people who lived in different houses, 28% moved from this county. Out of people who lived in different houses, 56% moved from different county within same state. Out of people who lived in different houses, 15% moved from different state.
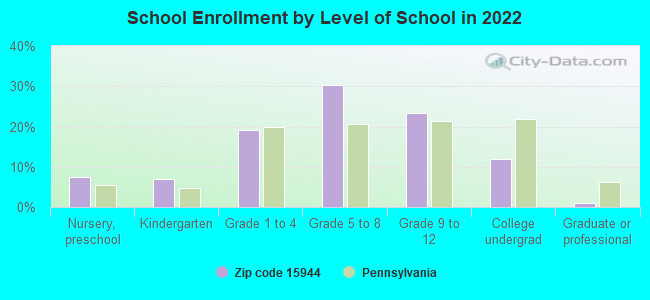
Private vs. public school enrollment:
Students in private schools in grades 1 to 8 (elementary and middle school): 72
Here:
22.9%
Pennsylvania:
15.7%
Students in private schools in grades 9 to 12 (high school): 5
Here:
3.5%
Pennsylvania:
13.4%
Students in private undergraduate colleges: 22
Here:
29.3%
Pennsylvania:
39.8%
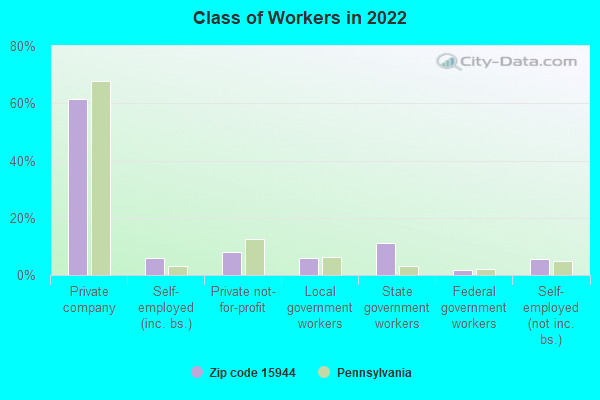
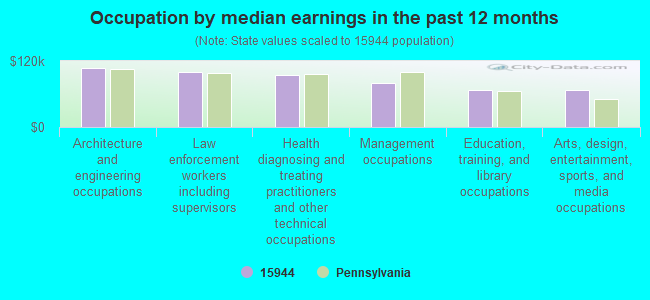
Occupation by median earnings in the past 12 months ($)
106,420Architecture and engineering occupations
99,651Law enforcement workers including supervisors
94,142Health diagnosing and treating practitioners and other technical occupations
80,804Management occupations
67,676Education, training, and library occupations
67,024Arts, design, entertainment, sports, and media occupations
Top industries in this zip code by the number of employees in 2005:
Utilities: Fossil Fuel Electric Power Generation (100-249 employees: 2 establishments, 5-9 employees: 2 establishments, 1-4 employees: 2 establishments)
Mining: Natural Gas Liquid Extraction (50-99: 1)
Management of Companies and Enterprises: Corporate, Subsidiary, and Regional Managing Offices (20-49: 1)
Construction: Industrial Building Construction (20-49: 1)
Health Care and Social Assistance: Ambulance Services (20-49: 1)
Health Care and Social Assistance: Services for the Elderly and Persons with Disabilities (10-19: 1)
People in group quarters in 2000:
20 people in other noninstitutional group quarters
Fatal accident statistics in 2014:
Fatal accident count: 1
Vehicles involved in fatal accidents: 1
Fatal accidents caused by drunken drivers: 0
Fatalities: 1
Persons involved in fatal accidents: 1
Pedestrians involved in fatal accidents: 0
Fatal accident statistics in 2011:
Fatal accident count: 1
Vehicles involved in fatal accidents: 1
Fatal accidents caused by drunken drivers: 1
Fatalities: 1
Persons involved in fatal accidents: 1
Pedestrians involved in fatal accidents: 0
Home Mortgage Disclosure Act Aggregated Statistics For Year 2009 (Based on 2 partial tracts)
A) FHA, FSA/RHS & VA Home Purchase Loans
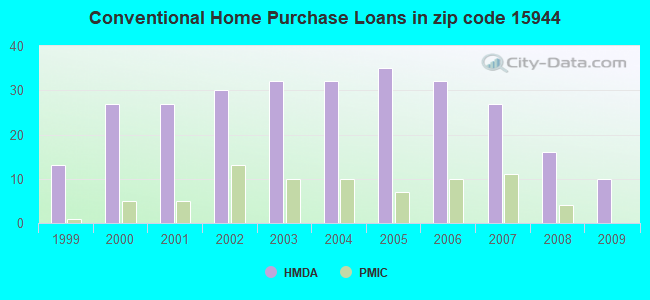
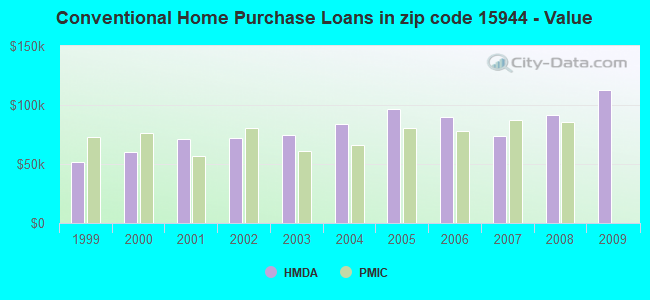
B) Conventional Home Purchase Loans
C) Refinancings
D) Home Improvement Loans
F) Non-occupant Loans on < 5 Family Dwellings (A B C & D)
G) Loans On Manufactured Home Dwelling (A B C & D)
Number
Average Value
Number
Average Value
Number
Average Value
Number
Average Value
Number
Average Value
Number
Average Value
LOANS ORIGINATED
8
$124,018
10
$112,945
51
$117,461
15
$31,447
5
$184,698
5
$59,498
APPLICATIONS APPROVED, NOT ACCEPTED
1
$174,220
0
$0
4
$144,502
1
$184,550
0
$0
0
$0
APPLICATIONS DENIED
4
$81,018
2
$136,565
28
$108,410
6
$29,158
1
$99,660
2
$93,015
APPLICATIONS WITHDRAWN
1
$172,740
1
$603,110
13
$160,871
1
$22,150
0
$0
0
$0
FILES CLOSED FOR INCOMPLETENESS
1
$80,460
0
$0
4
$97,442
0
$0
0
$0
0
$0
Aggregated Statistics For Year 2008 (Based on 2 partial tracts)
A) FHA, FSA/RHS & VA Home Purchase Loans
B) Conventional Home Purchase Loans
C) Refinancings
D) Home Improvement Loans
F) Non-occupant Loans on < 5 Family Dwellings (A B C & D)
G) Loans On Manufactured Home Dwelling (A B C & D)
Number
Average Value
Number
Average Value
Number
Average Value
Number
Average Value
Number
Average Value
Number
Average Value
LOANS ORIGINATED
10
$75,001
16
$91,583
25
$73,141
21
$27,032
3
$42,077
4
$59,978
APPLICATIONS APPROVED, NOT ACCEPTED
1
$45,030
4
$107,962
5
$100,100
1
$66,440
1
$75,300
1
$54,630
APPLICATIONS DENIED
1
$64,220
11
$79,457
40
$85,059
17
$51,718
0
$0
5
$63,042
APPLICATIONS WITHDRAWN
1
$158,710
1
$132,880
14
$93,382
3
$61,763
1
$36,910
1
$181,600
FILES CLOSED FOR INCOMPLETENESS
0
$0
0
$0
5
$93,456
1
$20,670
0
$0
0
$0
Aggregated Statistics For Year 2007 (Based on 2 partial tracts)
A) FHA, FSA/RHS & VA Home Purchase Loans
B) Conventional Home Purchase Loans
C) Refinancings
D) Home Improvement Loans
F) Non-occupant Loans on < 5 Family Dwellings (A B C & D)
G) Loans On Manufactured Home Dwelling (A B C & D)
Number
Average Value
Number
Average Value
Number
Average Value
Number
Average Value
Number
Average Value
Number
Average Value
LOANS ORIGINATED
4
$83,418
27
$73,929
46
$102,369
20
$21,150
4
$54,442
4
$48,352
APPLICATIONS APPROVED, NOT ACCEPTED
1
$142,470
4
$83,785
10
$59,573
4
$27,312
1
$50,200
1
$64,220
APPLICATIONS DENIED
2
$80,835
8
$46,506
84
$110,009
24
$37,371
5
$279,334
13
$51,390
APPLICATIONS WITHDRAWN
2
$124,385
5
$64,518
13
$113,058
1
$24,360
2
$75,665
1
$39,120
FILES CLOSED FOR INCOMPLETENESS
0
$0
1
$77,510
7
$143,316
1
$22,150
0
$0
0
$0
Aggregated Statistics For Year 2006 (Based on 2 partial tracts)
A) FHA, FSA/RHS & VA Home Purchase Loans
B) Conventional Home Purchase Loans
C) Refinancings
D) Home Improvement Loans
F) Non-occupant Loans on < 5 Family Dwellings (A B C & D)
G) Loans On Manufactured Home Dwelling (A B C & D)
Number
Average Value
Number
Average Value
Number
Average Value
Number
Average Value
Number
Average Value
Number
Average Value
LOANS ORIGINATED
10
$87,329
32
$89,668
60
$73,808
33
$23,287
3
$138,043
4
$82,125
APPLICATIONS APPROVED, NOT ACCEPTED
1
$135,830
6
$96,582
7
$53,889
5
$17,864
2
$134,720
2
$60,900
APPLICATIONS DENIED
1
$87,850
18
$64,838
74
$98,031
19
$21,718
1
$40,600
6
$41,708
APPLICATIONS WITHDRAWN
0
$0
5
$85,040
15
$135,337
1
$30,270
1
$69,390
1
$45,770
FILES CLOSED FOR INCOMPLETENESS
0
$0
1
$19,930
4
$77,880
0
$0
0
$0
0
$0
Aggregated Statistics For Year 2005 (Based on 2 partial tracts)
A) FHA, FSA/RHS & VA Home Purchase Loans
B) Conventional Home Purchase Loans
C) Refinancings
D) Home Improvement Loans
F) Non-occupant Loans on < 5 Family Dwellings (A B C & D)
G) Loans On Manufactured Home Dwelling (A B C & D)
Number
Average Value
Number
Average Value
Number
Average Value
Number
Average Value
Number
Average Value
Number
Average Value
LOANS ORIGINATED
5
$97,294
35
$96,831
62
$72,998
19
$24,205
4
$16,240
4
$23,622
APPLICATIONS APPROVED, NOT ACCEPTED
0
$0
4
$56,842
8
$84,524
2
$43,925
1
$14,760
3
$42,323
APPLICATIONS DENIED
0
$0
10
$68,505
79
$97,975
23
$24,810
1
$3,690
10
$47,540
APPLICATIONS WITHDRAWN
0
$0
7
$98,919
29
$115,007
7
$65,911
2
$407,115
1
$172,740
FILES CLOSED FOR INCOMPLETENESS
0
$0
2
$108,885
7
$103,031
1
$44,290
0
$0
0
$0
Aggregated Statistics For Year 2004 (Based on 2 partial tracts)
A) FHA, FSA/RHS & VA Home Purchase Loans
B) Conventional Home Purchase Loans
C) Refinancings
D) Home Improvement Loans
F) Non-occupant Loans on < 5 Family Dwellings (A B C & D)
G) Loans On Manufactured Home Dwelling (A B C & D)
Number
Average Value
Number
Average Value
Number
Average Value
Number
Average Value
Number
Average Value
Number
Average Value
LOANS ORIGINATED
5
$64,372
32
$84,224
66
$67,635
30
$18,234
7
$82,046
8
$40,232
APPLICATIONS APPROVED, NOT ACCEPTED
0
$0
2
$49,830
24
$62,901
4
$34,328
1
$45,770
4
$53,888
APPLICATIONS DENIED
0
$0
9
$76,609
52
$87,874
16
$19,286
1
$17,720
4
$34,510
APPLICATIONS WITHDRAWN
1
$34,700
6
$68,037
35
$83,627
4
$37,648
1
$115,900
1
$110,730
FILES CLOSED FOR INCOMPLETENESS
0
$0
1
$284,210
13
$80,237
1
$22,150
0
$0
0
$0
Aggregated Statistics For Year 2003 (Based on 2 partial tracts)
A) FHA, FSA/RHS & VA Home Purchase Loans
B) Conventional Home Purchase Loans
C) Refinancings
D) Home Improvement Loans
F) Non-occupant Loans on < 5 Family Dwellings (A B C & D)
Number
Average Value
Number
Average Value
Number
Average Value
Number
Average Value
Number
Average Value
LOANS ORIGINATED
3
$91,290
32
$74,743
104
$66,481
32
$18,593
6
$22,268
APPLICATIONS APPROVED, NOT ACCEPTED
0
$0
4
$45,215
18
$74,681
4
$17,718
1
$56,100
APPLICATIONS DENIED
0
$0
13
$54,740
59
$84,768
14
$24,097
0
$0
APPLICATIONS WITHDRAWN
0
$0
6
$92,152
22
$69,760
4
$32,480
1
$48,720
FILES CLOSED FOR INCOMPLETENESS
0
$0
0
$0
6
$86,738
0
$0
0
$0
Aggregated Statistics For Year 2002 (Based on 2 partial tracts)
A) FHA, FSA/RHS & VA Home Purchase Loans
B) Conventional Home Purchase Loans
C) Refinancings
D) Home Improvement Loans
F) Non-occupant Loans on < 5 Family Dwellings (A B C & D)
Number
Average Value
Number
Average Value
Number
Average Value
Number
Average Value
Number
Average Value
LOANS ORIGINATED
4
$66,252
30
$72,417
60
$67,914
27
$22,447
6
$54,380
APPLICATIONS APPROVED, NOT ACCEPTED
1
$44,290
6
$44,292
13
$59,169
4
$23,808
0
$0
APPLICATIONS DENIED
1
$86,370
11
$1,726,315
42
$79,532
16
$21,639
1
$23,620
APPLICATIONS WITHDRAWN
0
$0
4
$92,090
23
$75,072
4
$14,765
0
$0
FILES CLOSED FOR INCOMPLETENESS
0
$0
0
$0
8
$84,616
1
$47,980
0
$0
Aggregated Statistics For Year 2001 (Based on 2 partial tracts)
A) FHA, FSA/RHS & VA Home Purchase Loans
B) Conventional Home Purchase Loans
C) Refinancings
D) Home Improvement Loans
E) Loans on Dwellings For 5+ Families
F) Non-occupant Loans on < 5 Family Dwellings (A B C & D)
Number
Average Value
Number
Average Value
Number
Average Value
Number
Average Value
Number
Average Value
Number
Average Value
LOANS ORIGINATED
7
$52,834
27
$71,031
70
$69,654
32
$18,617
1
$19,190
5
$90,504
APPLICATIONS APPROVED, NOT ACCEPTED
0
$0
3
$42,077
21
$69,039
4
$16,978
0
$0
1
$55,360
APPLICATIONS DENIED
1
$28,790
14
$57,949
53
$65,352
14
$12,549
0
$0
1
$29,530
APPLICATIONS WITHDRAWN
0
$0
2
$67,175
24
$70,498
4
$17,532
0
$0
0
$0
FILES CLOSED FOR INCOMPLETENESS
0
$0
1
$37,650
3
$51,673
0
$0
0
$0
1
$74,560
Aggregated Statistics For Year 2000 (Based on 2 partial tracts)
A) FHA, FSA/RHS & VA Home Purchase Loans
B) Conventional Home Purchase Loans
C) Refinancings
D) Home Improvement Loans
F) Non-occupant Loans on < 5 Family Dwellings (A B C & D)
Number
Average Value
Number
Average Value
Number
Average Value
Number
Average Value
Number
Average Value
LOANS ORIGINATED
5
$48,130
27
$60,450
39
$50,463
27
$14,573
6
$35,803
APPLICATIONS APPROVED, NOT ACCEPTED
0
$0
6
$48,352
11
$51,674
4
$45,400
0
$0
APPLICATIONS DENIED
1
$95,970
10
$42,077
38
$50,101
21
$23,658
1
$45,030
APPLICATIONS WITHDRAWN
1
$38,390
6
$61,148
12
$53,089
3
$24,113
1
$25,840
FILES CLOSED FOR INCOMPLETENESS
0
$0
1
$17,720
4
$51,305
0
$0
0
$0
Aggregated Statistics For Year 1999 (Based on 1 partial tract)
A) FHA, FSA/RHS & VA Home Purchase Loans
B) Conventional Home Purchase Loans
C) Refinancings
D) Home Improvement Loans
F) Non-occupant Loans on < 5 Family Dwellings (A B C & D)
Detailed PMIC statistics for the following Tracts:8083.00
2005 - 2018 National Fire Incident Reporting System (NFIRS) incidents
Based on the data from the years 2005 - 2018 the average number of fire incidents per year is 12. The highest number of reported fires - 27 took place in 2016, and the least - 3 in 2013. The data has an increasing trend.
When looking into fire subcategories, the most incidents belonged to: Structure Fires (50.3%), and Outside Fires (29.4%).
Fire incident types reported to NFIRS in Zip Code 15944
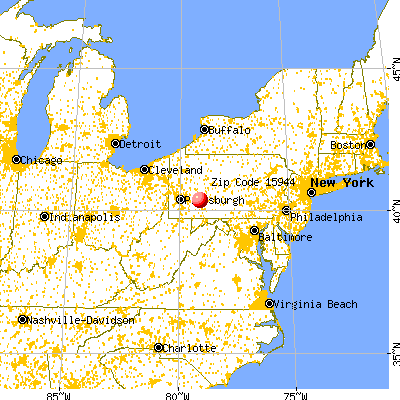


 Nearest zip codes: 15949, 15923, 15954, 15920, 15906, 15929.
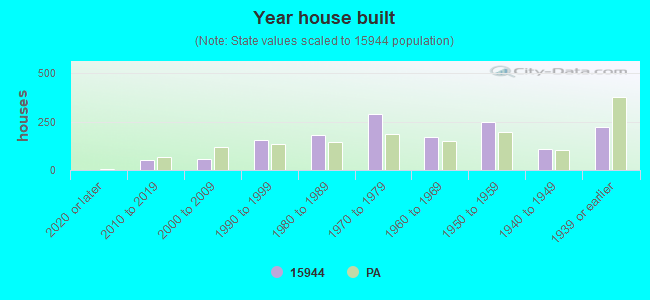


 Based on the data from the years 2005 - 2018 the average number of fire incidents per year is 12. The highest number of reported fires - 27 took place in 2016, and the least - 3 in 2013. The data has an increasing trend.
 When looking into fire subcategories, the most incidents belonged to: Structure Fires (50.3%), and Outside Fires (29.4%).